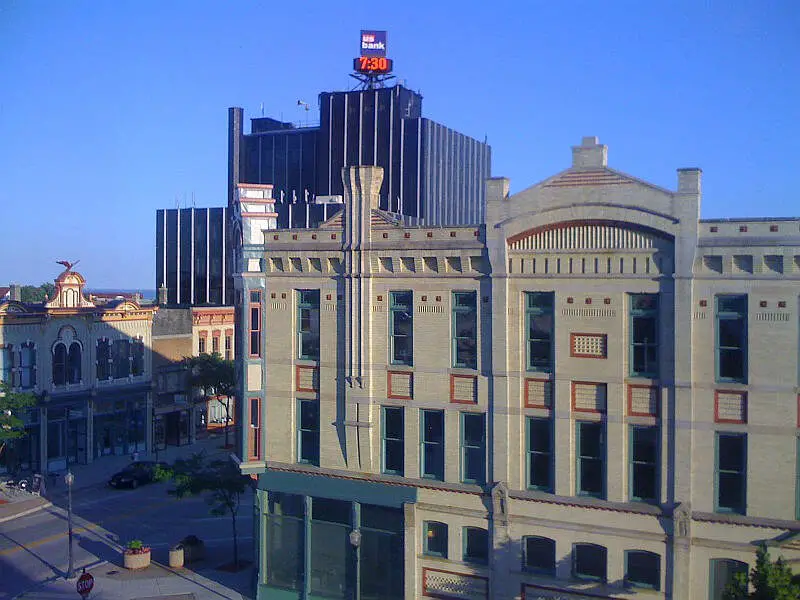
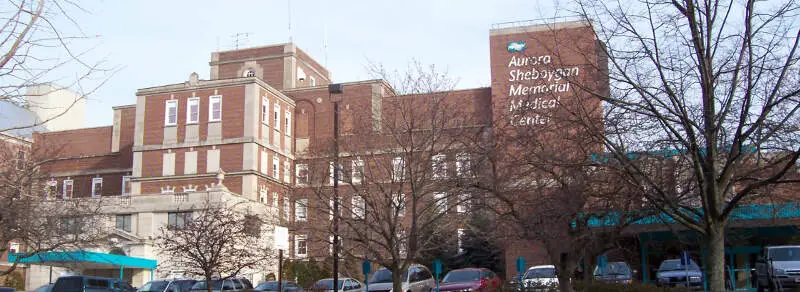
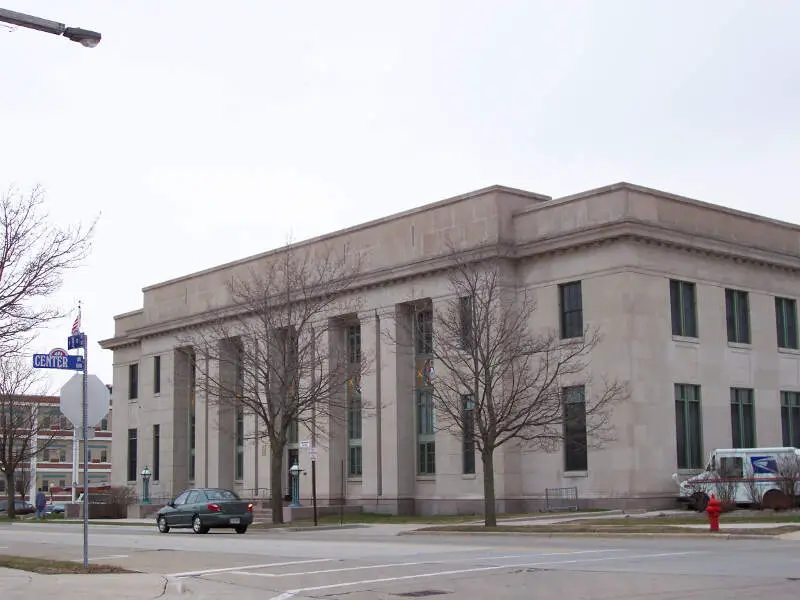
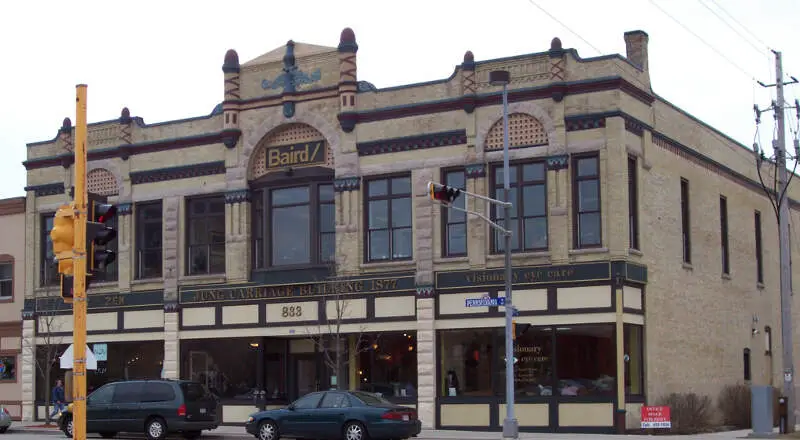
Sheboygan, WI
Demographics And Statistics
Living In Sheboygan, Wisconsin Summary
Life in Sheboygan research summary. HomeSnacks has been using Saturday Night Science to research the quality of life in Sheboygan over the past nine years using Census, FBI, Zillow, and other primary data sources. Based on the most recently available data, we found the following about life in Sheboygan:
The population in Sheboygan is 49,812.
The median home value in Sheboygan is $258,963.
The median income in Sheboygan is $62,953.
The cost of living in Sheboygan is 90 which is 0.9x lower than the national average.
The median rent in Sheboygan is $874.
The unemployment rate in Sheboygan is 2.5%.
The poverty rate in Sheboygan is 12.2%.
The average high in Sheboygan is 54.3° and the average low is 38.3°.
Sheboygan SnackAbility
Overall SnackAbility
Sheboygan, WI Crime Report
Crime in Sheboygan summary. We use data from the FBI to determine the crime rates in Sheboygan. Key points include:
There were 851 total crimes in Sheboygan in the last reporting year.
The overall crime rate per 100,000 people in Sheboygan is 1,715.4 / 100k people.
The violent crime rate per 100,000 people in Sheboygan is 427.3 / 100k people.
The property crime rate per 100,000 people in Sheboygan is 1,288.0 / 100k people.
Overall, crime in Sheboygan is -19.06% below the national average.
Total Crimes
Below National Average
Crime In Sheboygan Comparison Table
| Statistic | Count Raw |
Sheboygan / 100k People |
Wisconsin / 100k People |
National / 100k People |
|---|---|---|---|---|
| Total Crimes Per 100K | 851 | 1,715.4 | 1,432.6 | 2,119.2 |
| Violent Crime | 212 | 427.3 | 278.5 | 359.0 |
| Murder | 2 | 4.0 | 4.2 | 5.0 |
| Robbery | 3 | 6.0 | 39.4 | 61.0 |
| Aggravated Assault | 156 | 314.5 | 200.1 | 256.0 |
| Property Crime | 639 | 1,288.0 | 1,154.1 | 1,760.0 |
| Burglary | 44 | 88.7 | 117.2 | 229.0 |
| Larceny | 574 | 1,157.0 | 875.6 | 1,272.0 |
| Car Theft | 21 | 42.3 | 161.3 | 259.0 |
Sheboygan, WI Cost Of Living
Cost of living in Sheboygan summary. We use data on the cost of living to determine how expensive it is to live in Sheboygan. Real estate prices drive most of the variance in cost of living around Wisconsin. Key points include:
The cost of living in Sheboygan is 90 with 100 being average.
The cost of living in Sheboygan is 0.9x lower than the national average.
The median home value in Sheboygan is $258,963.
The median income in Sheboygan is $62,953.
Sheboygan's Overall Cost Of Living
Lower Than The National Average
Cost Of Living In Sheboygan Comparison Table
| Living Expense | Sheboygan | Wisconsin | National Average | |
|---|---|---|---|---|
| Overall | 90 | 95 | 100 | |
| Services | 95 | 98 | 100 | |
| Groceries | 100 | 100 | 100 | |
| Health | 115 | 111 | 100 | |
| Housing | 67 | 88 | 100 | |
| Transportation | 101 | 100 | 100 | |
| Utilities | 107 | 102 | 100 | |
Sheboygan, WI Weather
The average high in Sheboygan is 54.3° and the average low is 38.3°.
There are 69.8 days of precipitation each year.
Expect an average of 32.2 inches of precipitation each year with 44.2 inches of snow.
| Stat | Sheboygan |
|---|---|
| Average Annual High | 54.3 |
| Average Annual Low | 38.3 |
| Annual Precipitation Days | 69.8 |
| Average Annual Precipitation | 32.2 |
| Average Annual Snowfall | 44.2 |
Average High
Days of Rain
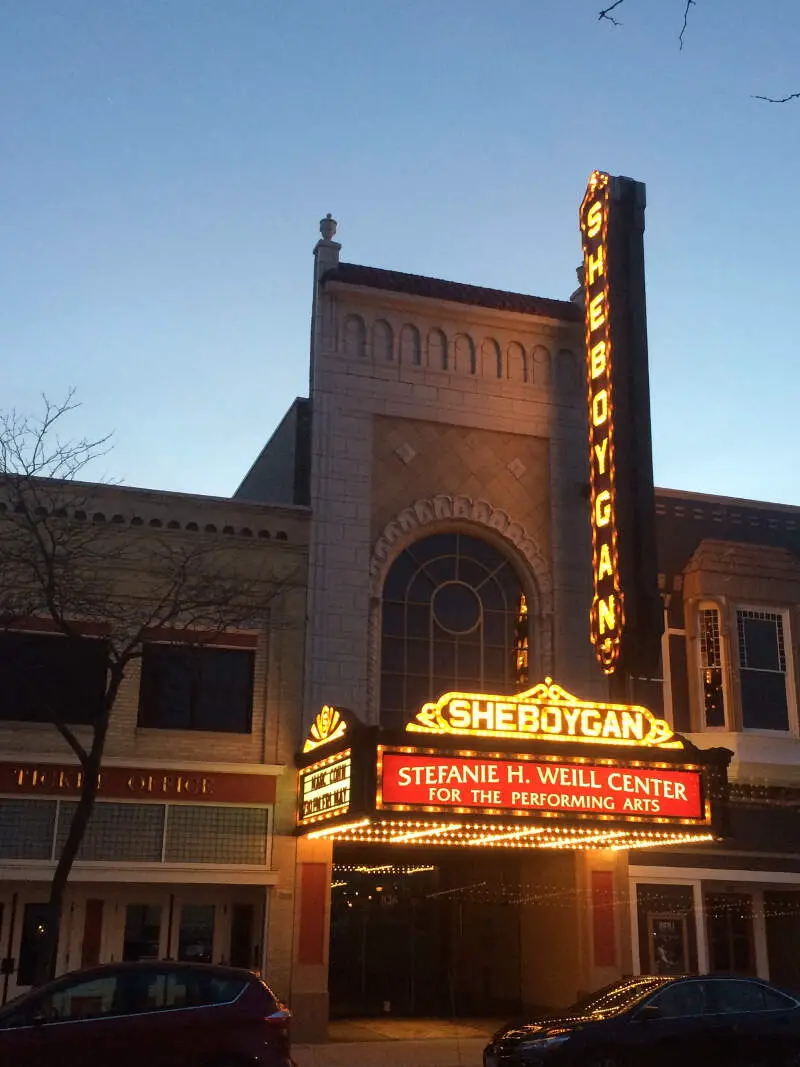
Sheboygan, WI Photos


1 Reviews & Comments About Sheboygan
/5

Kristen Long - None
I'm actually kinda shocked Sheboygan didn't make it on the list of worst places due to the h****n problem running rampant there. I love Sheboygan. It's my hometown. I wouldn't wanna move back there though.
Rankings for Sheboygan in Wisconsin


Locations Around Sheboygan
Map Of Sheboygan, WI
Best Places Around Sheboygan
Whitefish Bay, WI
Population 14,750
Fox Point, WI
Population 6,746
Wauwatosa, WI
Population 47,718
Cedarburg, WI
Population 12,317
Mequon, WI
Population 25,259
Menomonee Falls, WI
Population 38,963
Richfield, WI
Population 11,806
Sheboygan Falls, WI
Population 8,190
Grafton, WI
Population 12,274
Jackson, WI
Population 7,882
Sheboygan Demographics And Statistics
Population over time in Sheboygan
The current population in Sheboygan is 49,812. The population has increased 0.2% from 2010.
| Year | Population | % Change |
|---|---|---|
| 2023 | 49,812 | 0.0% |
| 2022 | 49,805 | -0.1% |
| 2021 | 49,849 | 3.5% |
| 2020 | 48,153 | -0.4% |
| 2019 | 48,327 | -0.4% |
| 2018 | 48,531 | -0.1% |
| 2017 | 48,560 | -0.5% |
| 2016 | 48,813 | -0.1% |
| 2015 | 48,853 | -0.1% |
| 2014 | 48,918 | -0.3% |
| 2013 | 49,069 | -0.5% |
| 2012 | 49,308 | -0.5% |
| 2011 | 49,544 | -0.4% |
| 2010 | 49,734 | - |
Race / Ethnicity in Sheboygan
Sheboygan is:
67.9% White with 33,810 White residents.
3.3% African American with 1,635 African American residents.
0.2% American Indian with 107 American Indian residents.
12.2% Asian with 6,075 Asian residents.
0.2% Hawaiian with 99 Hawaiian residents.
0.0% Other with 19 Other residents.
3.6% Two Or More with 1,803 Two Or More residents.
12.6% Hispanic with 6,264 Hispanic residents.
| Race | Sheboygan | WI | USA |
|---|---|---|---|
| White | 67.9% | 79.2% | 58.2% |
| African American | 3.3% | 6.0% | 12.0% |
| American Indian | 0.2% | 0.6% | 0.5% |
| Asian | 12.2% | 2.9% | 5.7% |
| Hawaiian | 0.2% | 0.0% | 0.2% |
| Other | 0.0% | 0.3% | 0.5% |
| Two Or More | 3.6% | 3.3% | 3.9% |
| Hispanic | 12.6% | 7.8% | 19.0% |
Gender in Sheboygan
Sheboygan is 48.5% female with 24,167 female residents.
Sheboygan is 51.5% male with 25,644 male residents.
| Gender | Sheboygan | WI | USA |
|---|---|---|---|
| Female | 48.5% | 49.9% | 50.5% |
| Male | 51.5% | 50.1% | 49.5% |
Highest level of educational attainment in Sheboygan for adults over 25
4.0% of adults in Sheboygan completed < 9th grade.
5.0% of adults in Sheboygan completed 9-12th grade.
35.0% of adults in Sheboygan completed high school / ged.
22.0% of adults in Sheboygan completed some college.
11.0% of adults in Sheboygan completed associate's degree.
17.0% of adults in Sheboygan completed bachelor's degree.
5.0% of adults in Sheboygan completed master's degree.
1.0% of adults in Sheboygan completed professional degree.
0.0% of adults in Sheboygan completed doctorate degree.
| Education | Sheboygan | WI | USA |
|---|---|---|---|
| < 9th Grade | 4.0% | 2.0% | 5.0% |
| 9-12th Grade | 5.0% | 4.0% | 6.0% |
| High School / GED | 35.0% | 30.0% | 26.0% |
| Some College | 22.0% | 20.0% | 19.0% |
| Associate's Degree | 11.0% | 11.0% | 9.0% |
| Bachelor's Degree | 17.0% | 22.0% | 21.0% |
| Master's Degree | 5.0% | 8.0% | 10.0% |
| Professional Degree | 1.0% | 2.0% | 2.0% |
| Doctorate Degree | 0.0% | 1.0% | 2.0% |
Household Income For Sheboygan, Wisconsin
4.5% of households in Sheboygan earn Less than $10,000.
3.2% of households in Sheboygan earn $10,000 to $14,999.
6.9% of households in Sheboygan earn $15,000 to $24,999.
7.3% of households in Sheboygan earn $25,000 to $34,999.
14.3% of households in Sheboygan earn $35,000 to $49,999.
26.3% of households in Sheboygan earn $50,000 to $74,999.
15.1% of households in Sheboygan earn $75,000 to $99,999.
13.4% of households in Sheboygan earn $100,000 to $149,999.
5.8% of households in Sheboygan earn $150,000 to $199,999.
3.2% of households in Sheboygan earn $200,000 or more.
| Income | Sheboygan | WI | USA |
|---|---|---|---|
| Less than $10,000 | 4.5% | 4.0% | 4.9% |
| $10,000 to $14,999 | 3.2% | 3.2% | 3.6% |
| $15,000 to $24,999 | 6.9% | 6.2% | 6.6% |
| $25,000 to $34,999 | 7.3% | 7.4% | 6.8% |
| $35,000 to $49,999 | 14.3% | 10.9% | 10.4% |
| $50,000 to $74,999 | 26.3% | 17.8% | 15.7% |
| $75,000 to $99,999 | 15.1% | 14.0% | 12.7% |
| $100,000 to $149,999 | 13.4% | 18.9% | 17.4% |
| $150,000 to $199,999 | 5.8% | 8.9% | 9.3% |
| $200,000 or more | 3.2% | 8.6% | 12.6% |


