Superior SnackAbility
Overall SnackAbility
Crime in Superior summary. We use data from the FBI to determine the crime rates in Superior. Key points include:
There were 638 total crimes in Superior in the last reporting year.
The overall crime rate per 100,000 people in Superior is 2,424.9 / 100k people.
The violent crime rate per 100,000 people in Superior is 220.4 / 100k people.
The property crime rate per 100,000 people in Superior is 2,204.5 / 100k people.
Overall, crime in Superior is 14.43% above the national average.
Total Crimes
Above National Average
Crime In Superior Comparison Table
| Statistic | Count Raw |
Superior / 100k People |
Wisconsin / 100k People |
National / 100k People |
|---|---|---|---|---|
| Total Crimes Per 100K | 638 | 2,424.9 | 1,432.6 | 2,119.2 |
| Violent Crime | 58 | 220.4 | 278.5 | 359.0 |
| Murder | 1 | 3.8 | 4.2 | 5.0 |
| Robbery | 3 | 11.4 | 39.4 | 61.0 |
| Aggravated Assault | 40 | 152.0 | 200.1 | 256.0 |
| Property Crime | 580 | 2,204.5 | 1,154.1 | 1,760.0 |
| Burglary | 49 | 186.2 | 117.2 | 229.0 |
| Larceny | 486 | 1,847.2 | 875.6 | 1,272.0 |
| Car Theft | 45 | 171.0 | 161.3 | 259.0 |
Source: FBI Uniform Crime Reporting (2024)
Cost of living in Superior summary. We use data on the cost of living to determine how expensive it is to live in Superior. Real estate prices drive most of the variance in cost of living around Wisconsin. Key points include:
The cost of living in Superior is 93 with 100 being average.
The cost of living in Superior is 0.9x lower than the national average.
The median home value in Superior is $220,786.
The median income in Superior is $64,216.
Superior's Overall Cost Of Living
Lower Than The National Average
Cost Of Living In Superior Comparison Table
| Living Expense | Superior | Wisconsin | National Average |
|---|---|---|---|
| Overall | 93 | 98 | 100 |
| Services | 101 | 98 | 100 |
| Groceries | 97 | 100 | 100 |
| Health | 71 | 91 | 100 |
| Housing | 102 | 99 | 100 |
| Transportation | 108 | 102 | 100 |
| Utilities | 95 | 100 | 100 |
Source: Cost of living index, normalized to US average = 100
Superior, WI Weather
The average high in Superior is 49.4° and the average low is 31.8°.
There are 63.3 days of precipitation each year.
Expect an average of 30.0 inches of precipitation each year with 63.9 inches of snow.
| Stat | Superior |
|---|---|
| Average Annual High | 49.4 |
| Average Annual Low | 31.8 |
| Annual Precipitation Days | 63.3 |
| Average Annual Precipitation | 30.0 |
| Average Annual Snowfall | 63.9 |
Average High
Days of Rain
Source: NOAA climate normals (30-year)
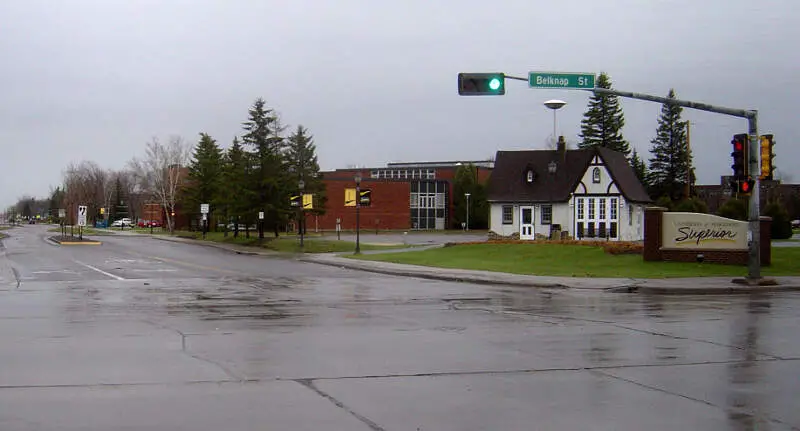
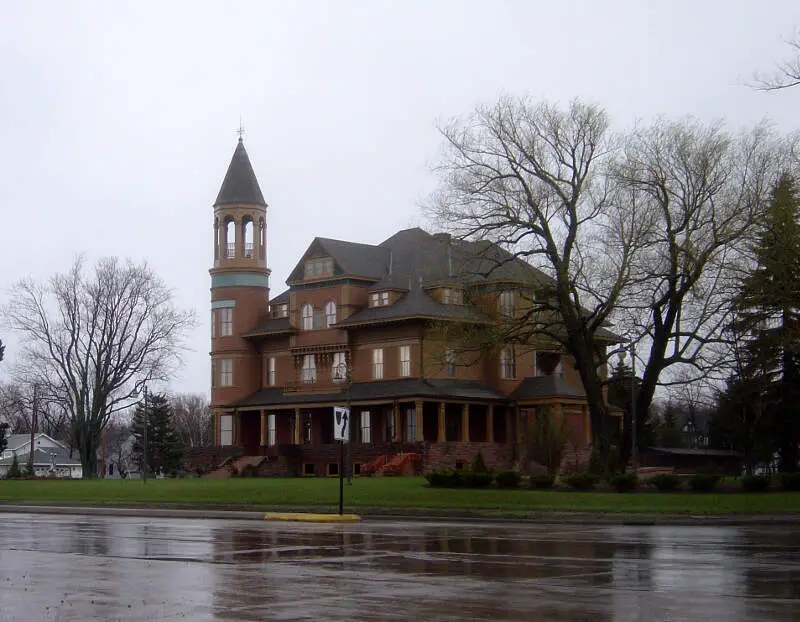
Superior, WI Photos


1 Reviews & Comments About Superior

There are barely any crimes in Superior. I live in superior and I haven't heard of a crime ever. Lies
Rankings & Articles For Superior


Locations Around Superior
Map Of Superior, WI
Best Places Around Superior
Hermantown, MN
Population 10,218
Duluth, MN
Population 87,093
Big Lake, MN
Population 378
Big Lake, MN
Population 378
Cloquet, MN
Population 12,537
Superior Demographics And Statistics
Population over time in Superior
The current population in Superior is 26,677. The population has decreased 1.9% from 2010.
| Year | Population | % Change |
|---|---|---|
| 2024 | 26,677 | 0.5% |
| 2023 | 26,550 | -0.0% |
| 2022 | 26,562 | -0.1% |
| 2021 | 26,601 | 1.3% |
| 2020 | 26,260 | 0.1% |
| 2019 | 26,223 | -0.5% |
| 2018 | 26,346 | -0.5% |
| 2017 | 26,473 | -0.8% |
| 2016 | 26,676 | -0.5% |
| 2015 | 26,817 | -0.4% |
| 2014 | 26,932 | -0.4% |
| 2013 | 27,053 | -0.2% |
| 2012 | 27,095 | -0.3% |
| 2011 | 27,174 | -0.1% |
| 2010 | 27,193 | - |
Race / Ethnicity in Superior
See the full breakdown
Superior is:
88.2% White with 23,520 White residents.
1.0% African American with 279 African American residents.
1.0% American Indian with 255 American Indian residents.
1.1% Asian with 289 Asian residents.
0.0% Hawaiian with 0 Hawaiian residents.
0.2% Other with 57 Other residents.
6.0% Two Or More with 1,596 Two Or More residents.
2.6% Hispanic with 681 Hispanic residents.
| Race | Superior | WI | USA |
|---|---|---|---|
| White | 88.2% | 78.6% | 57.4% |
| African American | 1.0% | 5.9% | 11.9% |
| American Indian | 1.0% | 0.5% | 0.5% |
| Asian | 1.1% | 2.9% | 5.9% |
| Hawaiian | 0.0% | 0.0% | 0.2% |
| Other | 0.2% | 0.3% | 0.6% |
| Two Or More | 6.0% | 3.7% | 4.3% |
| Hispanic | 2.6% | 8.0% | 19.3% |
Gender in Superior
See the full breakdown
Superior is 51.4% female with 13,699 female residents.
Superior is 48.6% male with 12,977 male residents.
| Gender | Superior | WI | USA |
|---|---|---|---|
| Female | 51.4% | 49.9% | 50.5% |
| Male | 48.6% | 50.1% | 49.5% |
Highest level of educational attainment in Superior for adults over 25
See the full breakdown
0.0% of adults in Superior completed < 9th grade.
5.0% of adults in Superior completed 9-12th grade.
30.0% of adults in Superior completed high school / ged.
21.0% of adults in Superior completed some college.
14.0% of adults in Superior completed associate's degree.
21.0% of adults in Superior completed bachelor's degree.
6.0% of adults in Superior completed master's degree.
2.0% of adults in Superior completed professional degree.
1.0% of adults in Superior completed doctorate degree.
| Education | Superior | WI | USA |
|---|---|---|---|
| < 9th Grade | 0.0% | 4.0% | 4.0% |
| 9-12th Grade | 5.0% | 4.0% | 6.0% |
| High School / GED | 30.0% | 29.0% | 26.0% |
| Some College | 21.0% | 19.0% | 19.0% |
| Associate's Degree | 14.0% | 11.0% | 9.0% |
| Bachelor's Degree | 21.0% | 22.0% | 22.0% |
| Master's Degree | 6.0% | 8.0% | 10.0% |
| Professional Degree | 2.0% | 2.0% | 2.0% |
| Doctorate Degree | 1.0% | 1.0% | 2.0% |
Household Income For Superior, Wisconsin
See the full breakdown
4.8% of households in Superior earn Less than $10,000.
5.7% of households in Superior earn $10,000 to $14,999.
8.8% of households in Superior earn $15,000 to $24,999.
8.4% of households in Superior earn $25,000 to $34,999.
12.0% of households in Superior earn $35,000 to $49,999.
14.7% of households in Superior earn $50,000 to $74,999.
13.1% of households in Superior earn $75,000 to $99,999.
19.4% of households in Superior earn $100,000 to $149,999.
8.3% of households in Superior earn $150,000 to $199,999.
4.8% of households in Superior earn $200,000 or more.
| Income | Superior | WI | USA |
|---|---|---|---|
| Less than $10,000 | 4.8% | 4.1% | 5.0% |
| $10,000 to $14,999 | 5.7% | 3.0% | 3.4% |
| $15,000 to $24,999 | 8.8% | 5.9% | 6.3% |
| $25,000 to $34,999 | 8.4% | 7.2% | 6.6% |
| $35,000 to $49,999 | 12.0% | 10.8% | 10.1% |
| $50,000 to $74,999 | 14.7% | 17.5% | 15.5% |
| $75,000 to $99,999 | 13.1% | 13.8% | 12.6% |
| $100,000 to $149,999 | 19.4% | 19.1% | 17.5% |
| $150,000 to $199,999 | 8.3% | 9.4% | 9.6% |
| $200,000 or more | 4.8% | 9.2% | 13.4% |
Source: U.S. Census ACS 5-year estimates (2024)


