Watertown, WI
Demographics And Statistics
Living In Watertown, Wisconsin Summary
Life in Watertown research summary. HomeSnacks has been using Saturday Night Science to research the quality of life in Watertown over the past nine years using Census, FBI, Zillow, and other primary data sources. Based on the most recently available data, we found the following about life in Watertown:
The population in Watertown is 22,873.
The median home value in Watertown is $312,897.
The median income in Watertown is $68,333.
The cost of living in Watertown is 101 which is 1.0x higher than the national average.
The median rent in Watertown is $1,061.
The unemployment rate in Watertown is 5.5%.
The poverty rate in Watertown is 9.9%.
The average high in Watertown is 56.6° and the average low is 37.1°.
Watertown SnackAbility
Overall SnackAbility
Watertown, WI Crime Report
Crime in Watertown summary. We use data from the FBI to determine the crime rates in Watertown. Key points include:
There were 280 total crimes in Watertown in the last reporting year.
The overall crime rate per 100,000 people in Watertown is 1,238.3 / 100k people.
The violent crime rate per 100,000 people in Watertown is 190.2 / 100k people.
The property crime rate per 100,000 people in Watertown is 1,048.1 / 100k people.
Overall, crime in Watertown is -41.57% below the national average.
Total Crimes
Below National Average
Crime In Watertown Comparison Table
| Statistic | Count Raw |
Watertown / 100k People |
Wisconsin / 100k People |
National / 100k People |
|---|---|---|---|---|
| Total Crimes Per 100K | 280 | 1,238.3 | 1,432.6 | 2,119.2 |
| Violent Crime | 43 | 190.2 | 278.5 | 359.0 |
| Murder | 0 | 0.0 | 4.2 | 5.0 |
| Robbery | 2 | 8.8 | 39.4 | 61.0 |
| Aggravated Assault | 27 | 119.4 | 200.1 | 256.0 |
| Property Crime | 237 | 1,048.1 | 1,154.1 | 1,760.0 |
| Burglary | 9 | 39.8 | 117.2 | 229.0 |
| Larceny | 214 | 946.4 | 875.6 | 1,272.0 |
| Car Theft | 14 | 61.9 | 161.3 | 259.0 |
Watertown, WI Cost Of Living
Cost of living in Watertown summary. We use data on the cost of living to determine how expensive it is to live in Watertown. Real estate prices drive most of the variance in cost of living around Wisconsin. Key points include:
The cost of living in Watertown is 101 with 100 being average.
The cost of living in Watertown is 1.0x higher than the national average.
The median home value in Watertown is $312,897.
The median income in Watertown is $68,333.
Watertown's Overall Cost Of Living
Higher Than The National Average
Cost Of Living In Watertown Comparison Table
| Living Expense | Watertown | Wisconsin | National Average | |
|---|---|---|---|---|
| Overall | 101 | 95 | 100 | |
| Services | 106 | 98 | 100 | |
| Groceries | 101 | 100 | 100 | |
| Health | 122 | 111 | 100 | |
| Housing | 89 | 88 | 100 | |
| Transportation | 102 | 100 | 100 | |
| Utilities | 111 | 102 | 100 | |
Watertown, WI Weather
The average high in Watertown is 56.6° and the average low is 37.1°.
There are 67.8 days of precipitation each year.
Expect an average of 35.3 inches of precipitation each year with 35.6 inches of snow.
| Stat | Watertown |
|---|---|
| Average Annual High | 56.6 |
| Average Annual Low | 37.1 |
| Annual Precipitation Days | 67.8 |
| Average Annual Precipitation | 35.3 |
| Average Annual Snowfall | 35.6 |
Average High
Days of Rain
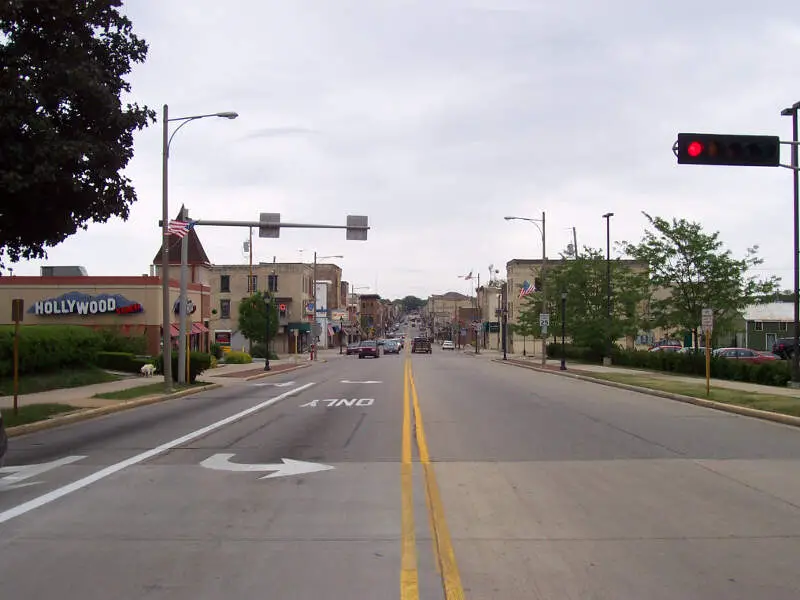
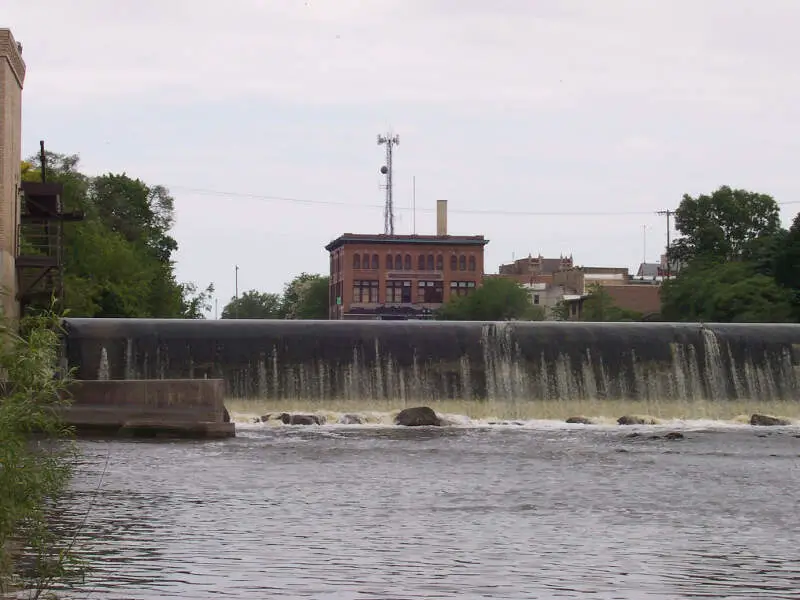
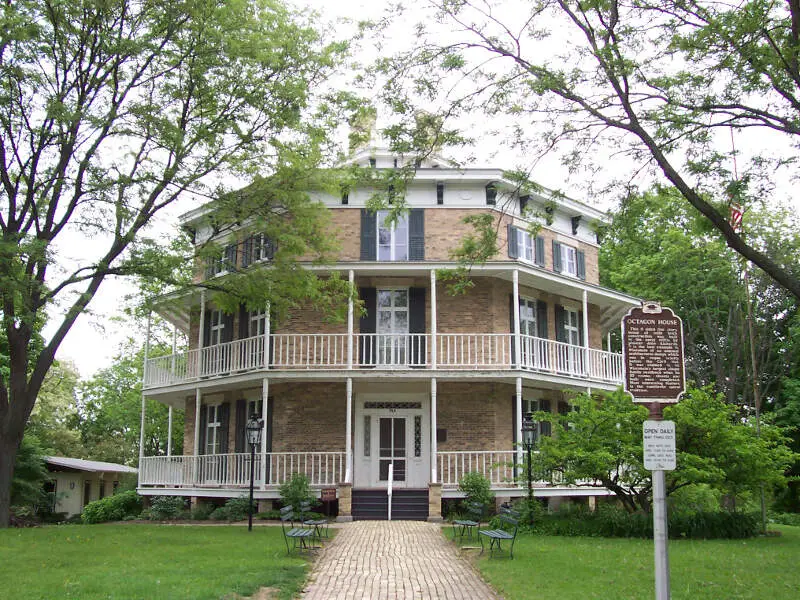
Watertown, WI Photos
Rankings for Watertown in Wisconsin


Locations Around Watertown
Map Of Watertown, WI
Best Places Around Watertown
Oconomowoc, WI
Population 18,385
Delafield, WI
Population 7,192
Hartford, WI
Population 15,761
Fort Atkinson, WI
Population 12,490
Lake Mills, WI
Population 6,391
Jefferson, WI
Population 7,722
Beaver Dam, WI
Population 16,629
Watertown Demographics And Statistics
Population over time in Watertown
The current population in Watertown is 22,873. The population has decreased -3.1% from 2010.
| Year | Population | % Change |
|---|---|---|
| 2023 | 22,873 | -0.5% |
| 2022 | 22,978 | -0.2% |
| 2021 | 23,030 | -2.3% |
| 2020 | 23,561 | -0.3% |
| 2019 | 23,633 | -0.2% |
| 2018 | 23,677 | -0.2% |
| 2017 | 23,730 | -0.6% |
| 2016 | 23,878 | 0.0% |
| 2015 | 23,878 | -0.1% |
| 2014 | 23,899 | -0.0% |
| 2013 | 23,905 | 0.3% |
| 2012 | 23,838 | 0.4% |
| 2011 | 23,750 | 0.6% |
| 2010 | 23,600 | - |
Race / Ethnicity in Watertown
Watertown is:
85.1% White with 19,461 White residents.
0.2% African American with 54 African American residents.
0.1% American Indian with 17 American Indian residents.
0.1% Asian with 34 Asian residents.
0.0% Hawaiian with 0 Hawaiian residents.
0.3% Other with 77 Other residents.
2.6% Two Or More with 596 Two Or More residents.
11.5% Hispanic with 2,634 Hispanic residents.
| Race | Watertown | WI | USA |
|---|---|---|---|
| White | 85.1% | 79.2% | 58.2% |
| African American | 0.2% | 6.0% | 12.0% |
| American Indian | 0.1% | 0.6% | 0.5% |
| Asian | 0.1% | 2.9% | 5.7% |
| Hawaiian | 0.0% | 0.0% | 0.2% |
| Other | 0.3% | 0.3% | 0.5% |
| Two Or More | 2.6% | 3.3% | 3.9% |
| Hispanic | 11.5% | 7.8% | 19.0% |
Gender in Watertown
Watertown is 54.0% female with 12,344 female residents.
Watertown is 46.0% male with 10,529 male residents.
| Gender | Watertown | WI | USA |
|---|---|---|---|
| Female | 54.0% | 49.9% | 50.5% |
| Male | 46.0% | 50.1% | 49.5% |
Highest level of educational attainment in Watertown for adults over 25
3.0% of adults in Watertown completed < 9th grade.
6.0% of adults in Watertown completed 9-12th grade.
40.0% of adults in Watertown completed high school / ged.
22.0% of adults in Watertown completed some college.
10.0% of adults in Watertown completed associate's degree.
14.0% of adults in Watertown completed bachelor's degree.
3.0% of adults in Watertown completed master's degree.
1.0% of adults in Watertown completed professional degree.
1.0% of adults in Watertown completed doctorate degree.
| Education | Watertown | WI | USA |
|---|---|---|---|
| < 9th Grade | 3.0% | 2.0% | 5.0% |
| 9-12th Grade | 6.0% | 4.0% | 6.0% |
| High School / GED | 40.0% | 30.0% | 26.0% |
| Some College | 22.0% | 20.0% | 19.0% |
| Associate's Degree | 10.0% | 11.0% | 9.0% |
| Bachelor's Degree | 14.0% | 22.0% | 21.0% |
| Master's Degree | 3.0% | 8.0% | 10.0% |
| Professional Degree | 1.0% | 2.0% | 2.0% |
| Doctorate Degree | 1.0% | 1.0% | 2.0% |
Household Income For Watertown, Wisconsin
3.8% of households in Watertown earn Less than $10,000.
1.7% of households in Watertown earn $10,000 to $14,999.
6.9% of households in Watertown earn $15,000 to $24,999.
9.5% of households in Watertown earn $25,000 to $34,999.
12.1% of households in Watertown earn $35,000 to $49,999.
21.7% of households in Watertown earn $50,000 to $74,999.
15.4% of households in Watertown earn $75,000 to $99,999.
20.8% of households in Watertown earn $100,000 to $149,999.
5.2% of households in Watertown earn $150,000 to $199,999.
2.8% of households in Watertown earn $200,000 or more.
| Income | Watertown | WI | USA |
|---|---|---|---|
| Less than $10,000 | 3.8% | 4.0% | 4.9% |
| $10,000 to $14,999 | 1.7% | 3.2% | 3.6% |
| $15,000 to $24,999 | 6.9% | 6.2% | 6.6% |
| $25,000 to $34,999 | 9.5% | 7.4% | 6.8% |
| $35,000 to $49,999 | 12.1% | 10.9% | 10.4% |
| $50,000 to $74,999 | 21.7% | 17.8% | 15.7% |
| $75,000 to $99,999 | 15.4% | 14.0% | 12.7% |
| $100,000 to $149,999 | 20.8% | 18.9% | 17.4% |
| $150,000 to $199,999 | 5.2% | 8.9% | 9.3% |
| $200,000 or more | 2.8% | 8.6% | 12.6% |


