Whitewater SnackAbility
Overall SnackAbility
Crime in Whitewater summary. We use data from the FBI to determine the crime rates in Whitewater. Key points include:
There were 142 total crimes in Whitewater in the last reporting year.
The overall crime rate per 100,000 people in Whitewater is 917.7 / 100k people.
The violent crime rate per 100,000 people in Whitewater is 200.3 / 100k people.
The property crime rate per 100,000 people in Whitewater is 717.4 / 100k people.
Overall, crime in Whitewater is -56.70% below the national average.
Total Crimes
Below National Average
Crime In Whitewater Comparison Table
| Statistic | Count Raw |
Whitewater / 100k People |
Wisconsin / 100k People |
National / 100k People |
|---|---|---|---|---|
| Total Crimes Per 100K | 142 | 917.7 | 1,432.6 | 2,119.2 |
| Violent Crime | 31 | 200.3 | 278.5 | 359.0 |
| Murder | 1 | 6.5 | 4.2 | 5.0 |
| Robbery | 2 | 12.9 | 39.4 | 61.0 |
| Aggravated Assault | 20 | 129.3 | 200.1 | 256.0 |
| Property Crime | 111 | 717.4 | 1,154.1 | 1,760.0 |
| Burglary | 5 | 32.3 | 117.2 | 229.0 |
| Larceny | 95 | 614.0 | 875.6 | 1,272.0 |
| Car Theft | 11 | 71.1 | 161.3 | 259.0 |
Source: FBI Uniform Crime Reporting (2024)
Cost of living in Whitewater summary. We use data on the cost of living to determine how expensive it is to live in Whitewater. Real estate prices drive most of the variance in cost of living around Wisconsin. Key points include:
The cost of living in Whitewater is 96 with 100 being average.
The cost of living in Whitewater is 1.0x lower than the national average.
The median home value in Whitewater is $338,753.
The median income in Whitewater is $54,969.
Whitewater's Overall Cost Of Living
Lower Than The National Average
Cost Of Living In Whitewater Comparison Table
| Living Expense | Whitewater | Wisconsin | National Average |
|---|---|---|---|
| Overall | 96 | 98 | 100 |
| Services | 100 | 98 | 100 |
| Groceries | 96 | 100 | 100 |
| Health | 92 | 91 | 100 |
| Housing | 100 | 99 | 100 |
| Transportation | 101 | 102 | 100 |
| Utilities | 97 | 100 | 100 |
Source: Cost of living index, normalized to US average = 100
Whitewater, WI Weather
The average high in Whitewater is 57.2° and the average low is 37.4°.
There are 65.8 days of precipitation each year.
Expect an average of 34.7 inches of precipitation each year with 37.3 inches of snow.
| Stat | Whitewater |
|---|---|
| Average Annual High | 57.2 |
| Average Annual Low | 37.4 |
| Annual Precipitation Days | 65.8 |
| Average Annual Precipitation | 34.7 |
| Average Annual Snowfall | 37.3 |
Average High
Days of Rain
Source: NOAA climate normals (30-year)
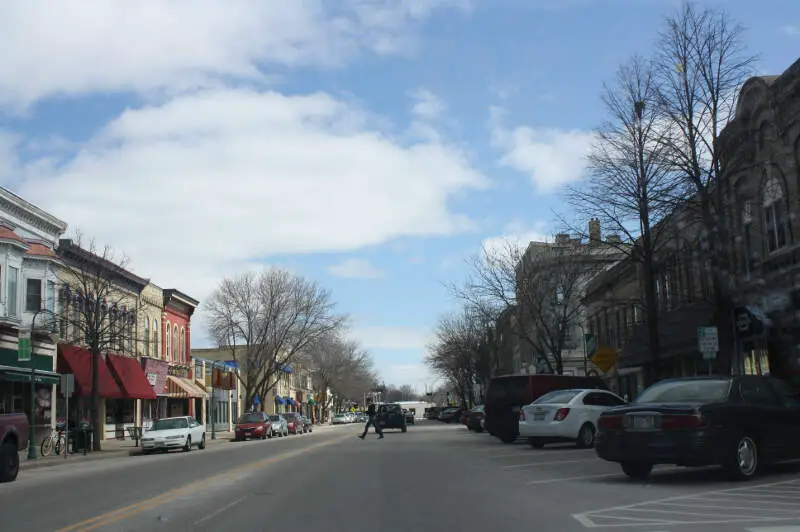
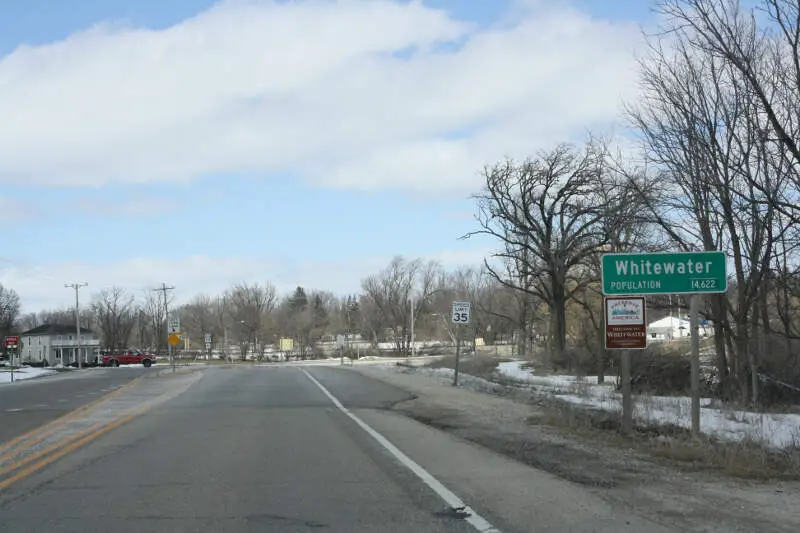
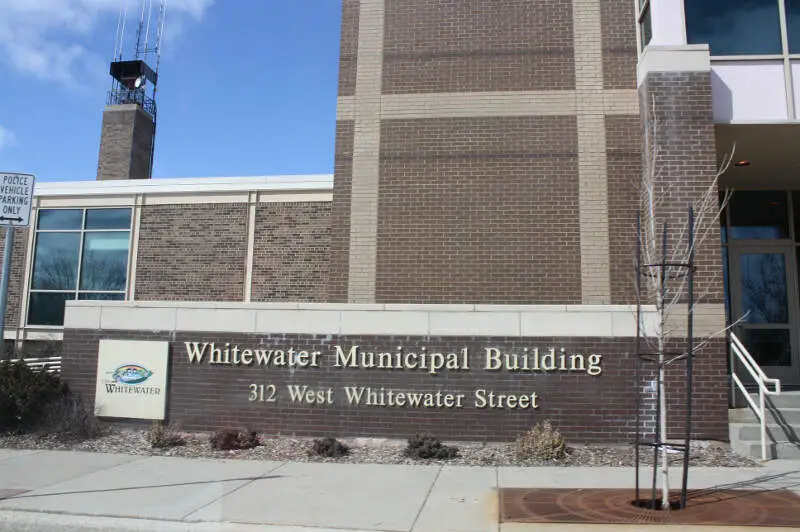
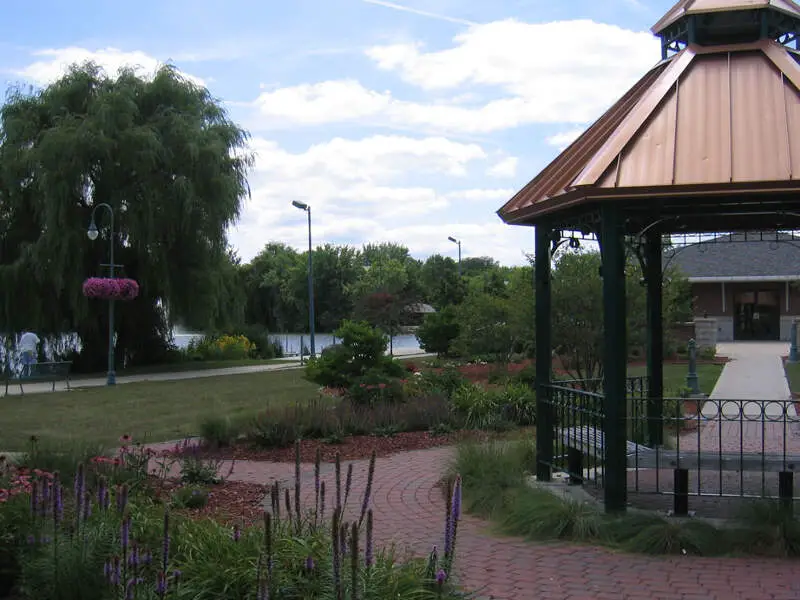
Whitewater, WI Photos
2 Reviews & Comments About Whitewater

Housing is one of biggest cost in whitewater, due to college every one has to pay Madison rates for rent most one bedroom apartments run 1k month
average wage seems to be minimum wage - 15$ or higher your doing way better then norm, main issue with jobs is that the town officials vote them selfs in to office, any one can run but its up to town leaders to decide who gets in, the town is some what ran like flint MI
I live near whitewater friends live in whitewater, there is no place that rents for 700 or less month, average house goes for 1,500 month
Rankings & Articles For Whitewater


Locations Around Whitewater
Map Of Whitewater, WI
Best Places Around Whitewater
Fort Atkinson, WI
Population 12,463
Lake Mills, WI
Population 6,470
Jefferson, WI
Population 7,732
Edgerton, WI
Population 6,014
Milton, WI
Population 5,706
Janesville, WI
Population 66,030
Elkhorn, WI
Population 10,221
Delavan, WI
Population 8,689
Whitewater Demographics And Statistics
Population over time in Whitewater
The current population in Whitewater is 15,807. The population has increased 10.6% from 2010.
| Year | Population | % Change |
|---|---|---|
| 2024 | 15,807 | 0.6% |
| 2023 | 15,705 | -0.1% |
| 2022 | 15,725 | 9.4% |
| 2021 | 14,369 | -2.7% |
| 2020 | 14,762 | 0.3% |
| 2019 | 14,722 | -0.3% |
| 2018 | 14,766 | 0.0% |
| 2017 | 14,762 | -0.5% |
| 2016 | 14,840 | -0.2% |
| 2015 | 14,866 | 0.4% |
| 2014 | 14,801 | 1.6% |
| 2013 | 14,570 | 1.3% |
| 2012 | 14,385 | -0.4% |
| 2011 | 14,441 | 1.1% |
| 2010 | 14,290 | - |
Race / Ethnicity in Whitewater
See the full breakdown
Whitewater is:
80.1% White with 12,654 White residents.
3.1% African American with 491 African American residents.
0.3% American Indian with 54 American Indian residents.
3.1% Asian with 487 Asian residents.
0.0% Hawaiian with 0 Hawaiian residents.
0.4% Other with 65 Other residents.
2.7% Two Or More with 433 Two Or More residents.
10.3% Hispanic with 1,623 Hispanic residents.
| Race | Whitewater | WI | USA |
|---|---|---|---|
| White | 80.1% | 78.6% | 57.4% |
| African American | 3.1% | 5.9% | 11.9% |
| American Indian | 0.3% | 0.5% | 0.5% |
| Asian | 3.1% | 2.9% | 5.9% |
| Hawaiian | 0.0% | 0.0% | 0.2% |
| Other | 0.4% | 0.3% | 0.6% |
| Two Or More | 2.7% | 3.7% | 4.3% |
| Hispanic | 10.3% | 8.0% | 19.3% |
Gender in Whitewater
See the full breakdown
Whitewater is 50.3% female with 7,944 female residents.
Whitewater is 49.7% male with 7,863 male residents.
| Gender | Whitewater | WI | USA |
|---|---|---|---|
| Female | 50.3% | 49.9% | 50.5% |
| Male | 49.7% | 50.1% | 49.5% |
Highest level of educational attainment in Whitewater for adults over 25
See the full breakdown
7.0% of adults in Whitewater completed < 9th grade.
2.0% of adults in Whitewater completed 9-12th grade.
24.0% of adults in Whitewater completed high school / ged.
24.0% of adults in Whitewater completed some college.
8.0% of adults in Whitewater completed associate's degree.
20.0% of adults in Whitewater completed bachelor's degree.
11.0% of adults in Whitewater completed master's degree.
1.0% of adults in Whitewater completed professional degree.
3.0% of adults in Whitewater completed doctorate degree.
| Education | Whitewater | WI | USA |
|---|---|---|---|
| < 9th Grade | 7.0% | 4.0% | 4.0% |
| 9-12th Grade | 2.0% | 4.0% | 6.0% |
| High School / GED | 24.0% | 29.0% | 26.0% |
| Some College | 24.0% | 19.0% | 19.0% |
| Associate's Degree | 8.0% | 11.0% | 9.0% |
| Bachelor's Degree | 20.0% | 22.0% | 22.0% |
| Master's Degree | 11.0% | 8.0% | 10.0% |
| Professional Degree | 1.0% | 2.0% | 2.0% |
| Doctorate Degree | 3.0% | 1.0% | 2.0% |
Household Income For Whitewater, Wisconsin
See the full breakdown
14.2% of households in Whitewater earn Less than $10,000.
4.4% of households in Whitewater earn $10,000 to $14,999.
7.0% of households in Whitewater earn $15,000 to $24,999.
9.3% of households in Whitewater earn $25,000 to $34,999.
12.2% of households in Whitewater earn $35,000 to $49,999.
13.6% of households in Whitewater earn $50,000 to $74,999.
12.1% of households in Whitewater earn $75,000 to $99,999.
20.9% of households in Whitewater earn $100,000 to $149,999.
4.7% of households in Whitewater earn $150,000 to $199,999.
1.7% of households in Whitewater earn $200,000 or more.
| Income | Whitewater | WI | USA |
|---|---|---|---|
| Less than $10,000 | 14.2% | 4.1% | 5.0% |
| $10,000 to $14,999 | 4.4% | 3.0% | 3.4% |
| $15,000 to $24,999 | 7.0% | 5.9% | 6.3% |
| $25,000 to $34,999 | 9.3% | 7.2% | 6.6% |
| $35,000 to $49,999 | 12.2% | 10.8% | 10.1% |
| $50,000 to $74,999 | 13.6% | 17.5% | 15.5% |
| $75,000 to $99,999 | 12.1% | 13.8% | 12.6% |
| $100,000 to $149,999 | 20.9% | 19.1% | 17.5% |
| $150,000 to $199,999 | 4.7% | 9.4% | 9.6% |
| $200,000 or more | 1.7% | 9.2% | 13.4% |
Source: U.S. Census ACS 5-year estimates (2024)


