Martinsburg SnackAbility
Overall SnackAbility
Cost of living in Martinsburg summary. We use data on the cost of living to determine how expensive it is to live in Martinsburg. Real estate prices drive most of the variance in cost of living around West Virginia. Key points include:
The cost of living in Martinsburg is 100 with 100 being average.
The cost of living in Martinsburg is 1.0x lower than the national average.
The median home value in Martinsburg is $307,800.
The median income in Martinsburg is $59,555.
Martinsburg's Overall Cost Of Living
Lower Than The National Average
Cost Of Living In Martinsburg Comparison Table
| Living Expense | Martinsburg | West Virginia | National Average |
|---|---|---|---|
| Overall | 100 | 86 | 100 |
| Services | 106 | 95 | 100 |
| Groceries | 107 | 95 | 100 |
| Health | 90 | 61 | 100 |
| Housing | 111 | 95 | 100 |
| Transportation | 105 | 93 | 100 |
| Utilities | 111 | 93 | 100 |
Source: Cost of living index, normalized to US average = 100
Martinsburg, WV Weather
The average high in Martinsburg is 64.7° and the average low is 42.2°.
There are 73.4 days of precipitation each year.
Expect an average of 38.6 inches of precipitation each year with 22.5 inches of snow.
| Stat | Martinsburg |
|---|---|
| Average Annual High | 64.7 |
| Average Annual Low | 42.2 |
| Annual Precipitation Days | 73.4 |
| Average Annual Precipitation | 38.6 |
| Average Annual Snowfall | 22.5 |
Average High
Days of Rain
Source: NOAA climate normals (30-year)
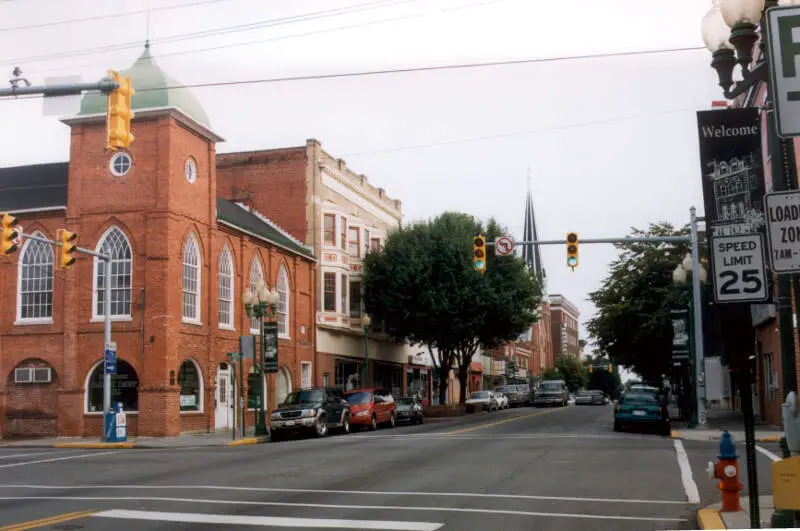
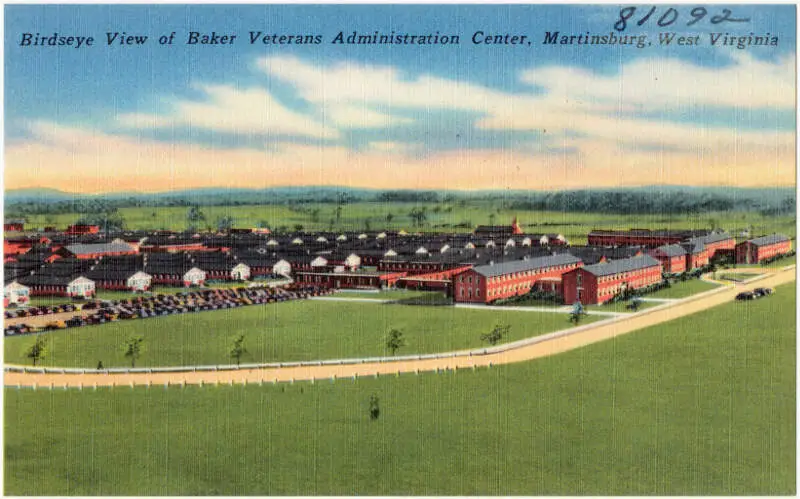
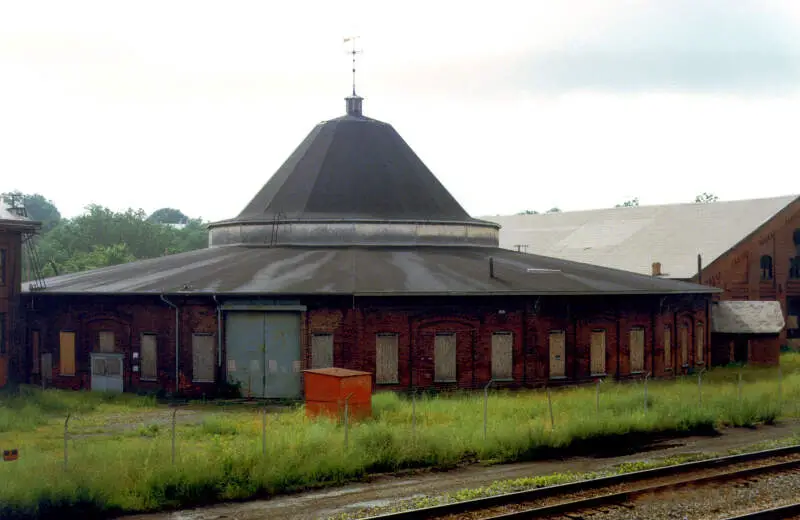
Martinsburg, WV Photos
3 Reviews & Comments About Martinsburg

IT'S TRASH. All you ever see is crack heads running around and what not. It can be a good place at the same time. Some things we have here like parks and swimming areas for the summer are amazing to be at. Martinsburg is great but the people in it make it a bad place if that makes sense.
Movies, Swimming, Rivers, Parks
I couldn't agree more with this artical. Good job. I have spent time in Hutington, Clarksburg, Keyser, Bluefield, Beckley and currently live in Martinsburg. Each of these towns are all holes.
You are wrong about Martinsburg having a terrible commute. The MARC Train connects it with DC, the AMTRAK connects it with DC and Chicago, and it is on the junction of two great highways, RT 45 and RT 81.
As far as crime - there are save neighborhoods and not so safe neighborhoods, like any city. Just like DC. My wife and I lived in Martinsburg for 7 years and never had any problems.
Rankings & Articles For Martinsburg


Locations Around Martinsburg
Map Of Martinsburg, WV
Best Places Around Martinsburg
North Potomac, MD
Population 23,922
Clarksburg, MD
Population 30,487
Travilah, MD
Population 11,721
Darnestown, MD
Population 7,051
Franklin Farm, VA
Population 18,736
Lowes Island, VA
Population 11,018
Floris, VA
Population 7,589
Belmont, VA
Population 9,729
Broadlands, VA
Population 14,353
Dranesville, VA
Population 11,828
Martinsburg Demographics And Statistics
Population over time in Martinsburg
The current population in Martinsburg is 18,904. The population has increased 10.3% from 2010.
| Year | Population | % Change |
|---|---|---|
| 2024 | 18,904 | 0.5% |
| 2023 | 18,805 | 0.7% |
| 2022 | 18,678 | 1.0% |
| 2021 | 18,502 | 5.6% |
| 2020 | 17,517 | 0.2% |
| 2019 | 17,475 | -0.1% |
| 2018 | 17,497 | 0.3% |
| 2017 | 17,451 | -0.9% |
| 2016 | 17,613 | 0.3% |
| 2015 | 17,564 | 0.3% |
| 2014 | 17,508 | 0.5% |
| 2013 | 17,418 | 0.6% |
| 2012 | 17,316 | 0.4% |
| 2011 | 17,253 | 0.7% |
| 2010 | 17,133 | - |
Race / Ethnicity in Martinsburg
See the full breakdown
Martinsburg is:
64.7% White with 12,225 White residents.
15.2% African American with 2,865 African American residents.
0.0% American Indian with 7 American Indian residents.
0.3% Asian with 59 Asian residents.
0.1% Hawaiian with 22 Hawaiian residents.
1.0% Other with 193 Other residents.
8.1% Two Or More with 1,533 Two Or More residents.
10.6% Hispanic with 2,000 Hispanic residents.
| Race | Martinsburg | WV | USA |
|---|---|---|---|
| White | 64.7% | 89.7% | 57.4% |
| African American | 15.2% | 3.1% | 11.9% |
| American Indian | 0.0% | 0.1% | 0.5% |
| Asian | 0.3% | 0.8% | 5.9% |
| Hawaiian | 0.1% | 0.0% | 0.2% |
| Other | 1.0% | 0.3% | 0.6% |
| Two Or More | 8.1% | 3.9% | 4.3% |
| Hispanic | 10.6% | 2.1% | 19.3% |
Gender in Martinsburg
See the full breakdown
Martinsburg is 48.8% female with 9,227 female residents.
Martinsburg is 51.2% male with 9,676 male residents.
| Gender | Martinsburg | WV | USA |
|---|---|---|---|
| Female | 48.8% | 50.1% | 50.5% |
| Male | 51.2% | 49.9% | 49.5% |
Highest level of educational attainment in Martinsburg for adults over 25
See the full breakdown
3.0% of adults in Martinsburg completed < 9th grade.
7.0% of adults in Martinsburg completed 9-12th grade.
36.0% of adults in Martinsburg completed high school / ged.
22.0% of adults in Martinsburg completed some college.
7.0% of adults in Martinsburg completed associate's degree.
17.0% of adults in Martinsburg completed bachelor's degree.
7.0% of adults in Martinsburg completed master's degree.
1.0% of adults in Martinsburg completed professional degree.
0.0% of adults in Martinsburg completed doctorate degree.
| Education | Martinsburg | WV | USA |
|---|---|---|---|
| < 9th Grade | 3.0% | 5.0% | 4.0% |
| 9-12th Grade | 7.0% | 7.0% | 6.0% |
| High School / GED | 36.0% | 39.0% | 26.0% |
| Some College | 22.0% | 17.0% | 19.0% |
| Associate's Degree | 7.0% | 8.0% | 9.0% |
| Bachelor's Degree | 17.0% | 14.0% | 22.0% |
| Master's Degree | 7.0% | 7.0% | 10.0% |
| Professional Degree | 1.0% | 2.0% | 2.0% |
| Doctorate Degree | 0.0% | 1.0% | 2.0% |
Household Income For Martinsburg, West Virginia
See the full breakdown
4.5% of households in Martinsburg earn Less than $10,000.
5.9% of households in Martinsburg earn $10,000 to $14,999.
8.4% of households in Martinsburg earn $15,000 to $24,999.
7.4% of households in Martinsburg earn $25,000 to $34,999.
16.4% of households in Martinsburg earn $35,000 to $49,999.
22.4% of households in Martinsburg earn $50,000 to $74,999.
10.8% of households in Martinsburg earn $75,000 to $99,999.
14.0% of households in Martinsburg earn $100,000 to $149,999.
5.3% of households in Martinsburg earn $150,000 to $199,999.
5.1% of households in Martinsburg earn $200,000 or more.
| Income | Martinsburg | WV | USA |
|---|---|---|---|
| Less than $10,000 | 4.5% | 6.2% | 5.0% |
| $10,000 to $14,999 | 5.9% | 5.5% | 3.4% |
| $15,000 to $24,999 | 8.4% | 9.4% | 6.3% |
| $25,000 to $34,999 | 7.4% | 9.2% | 6.6% |
| $35,000 to $49,999 | 16.4% | 12.4% | 10.1% |
| $50,000 to $74,999 | 22.4% | 17.3% | 15.5% |
| $75,000 to $99,999 | 10.8% | 12.7% | 12.6% |
| $100,000 to $149,999 | 14.0% | 15.1% | 17.5% |
| $150,000 to $199,999 | 5.3% | 6.3% | 9.6% |
| $200,000 or more | 5.1% | 5.9% | 13.4% |
Source: U.S. Census ACS 5-year estimates (2024)


