We all love the biggest cities that the Mountain State has to offer. You know the places like Charleston and Huntington which make all the headlines.
But there are a bunch of other great large cities in West Virginia that don't get as much love.
We're going to change that right now.
Using the most recent Census data, we can tell you about all the places in West Virginia with a focus on the biggest. We update the data each year and this is our fourth time doing this.
The Largest Cities In West Virginia For 2026:
You can click here to see a full table of the 100 biggest cities in West Virginia, along with every other place over 1,000 people big. It is sortable by clicking on the headers.
Read on below to see more on the biggest cities. Or for more reading on places to live in West Virginia, check out:
- Best Places To Live In West Virginia
- Cheapest Places To Live In West Virginia
- Most Dangerous Cities In West Virginia
The 10 Biggest Cities In West Virginia

/10
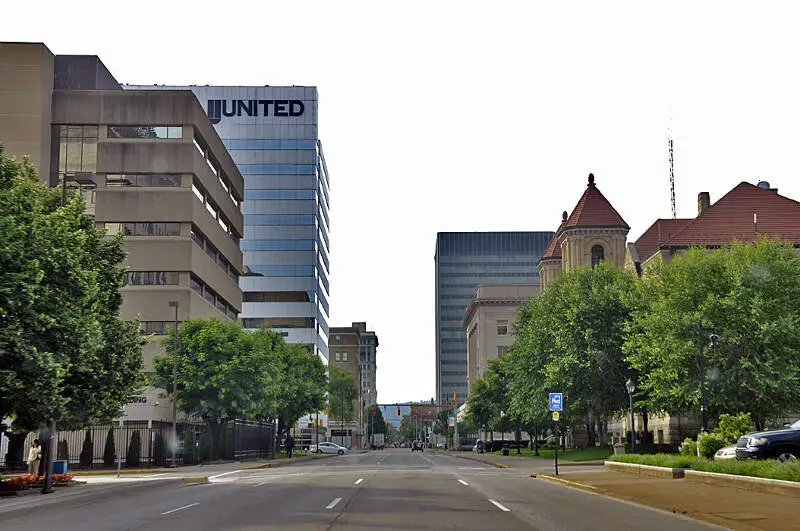
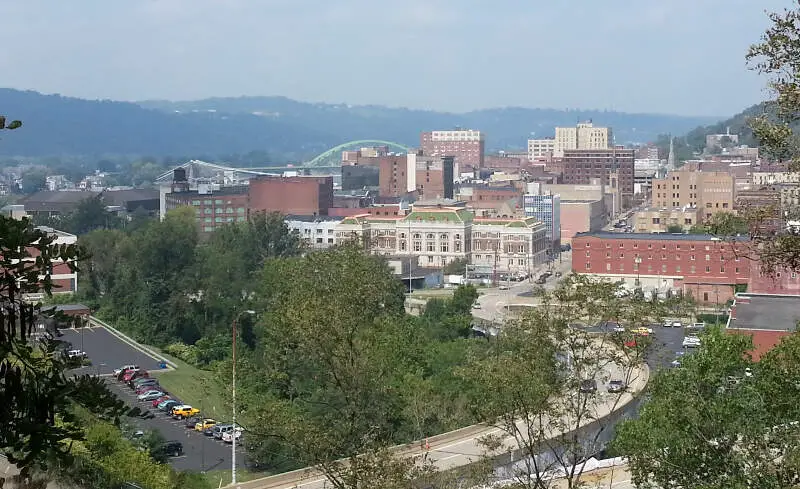
Rank Last Year: 1 (No Change)
Population: 47,421.0
Population 2010: 51,432
Growth: -7.8%
More on Charleston: Data | Crime | Cost Of Living | Real Estate

/10
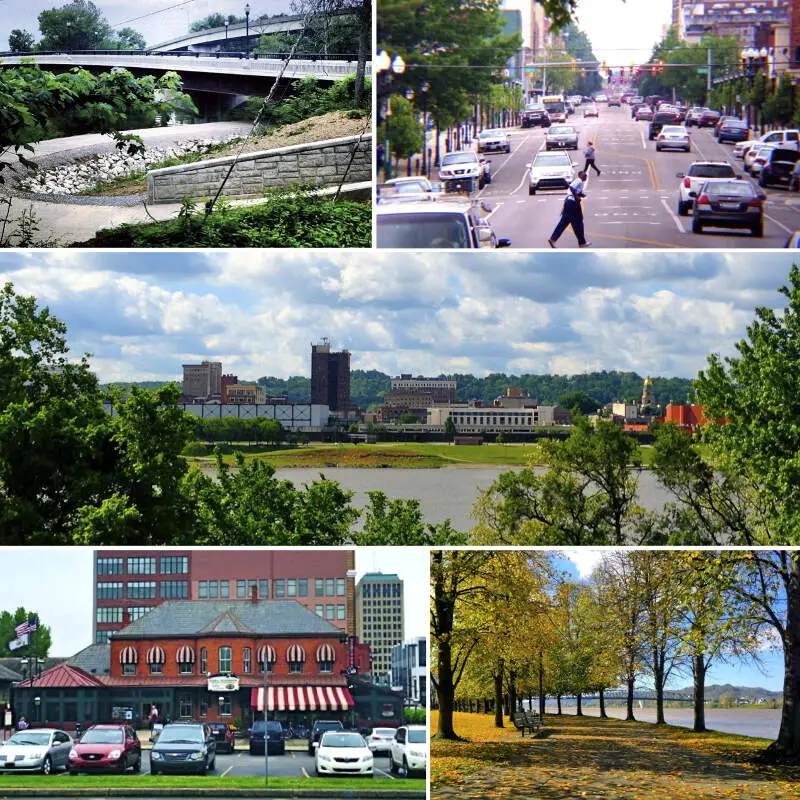
Rank Last Year: 2 (No Change)
Population: 45,787.0
Population 2010: 49,228
Growth: -7.0%
More on Huntington: Data | Crime | Cost Of Living | Real Estate

/10
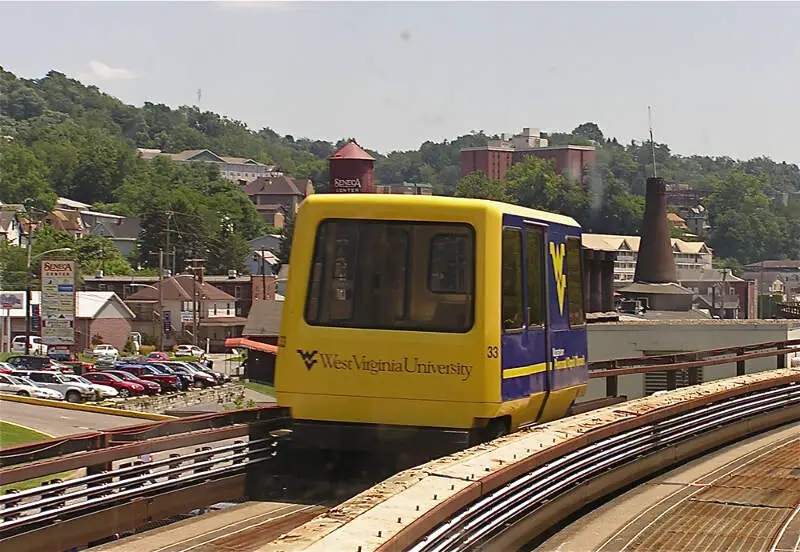
Rank Last Year: 3 (No Change)
Population: 30,236.0
Population 2010: 29,076
Growth: 4.0%
More on Morgantown: Data | Crime | Cost Of Living | Real Estate

/10
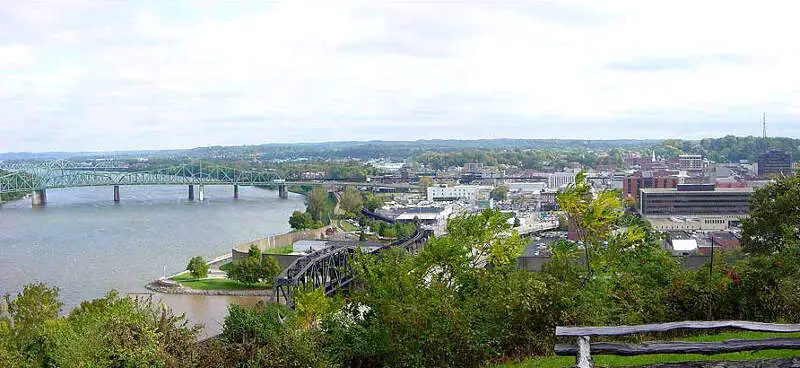
Rank Last Year: 4 (No Change)
Population: 29,240.0
Population 2010: 31,742
Growth: -7.9%
More on Parkersburg: Data | Crime | Cost Of Living | Real Estate

/10
Rank Last Year: 5 (No Change)
Population: 26,350.0
Population 2010: 28,861
Growth: -8.7%
More on Wheeling: Data | Crime | Cost Of Living | Real Estate

/10
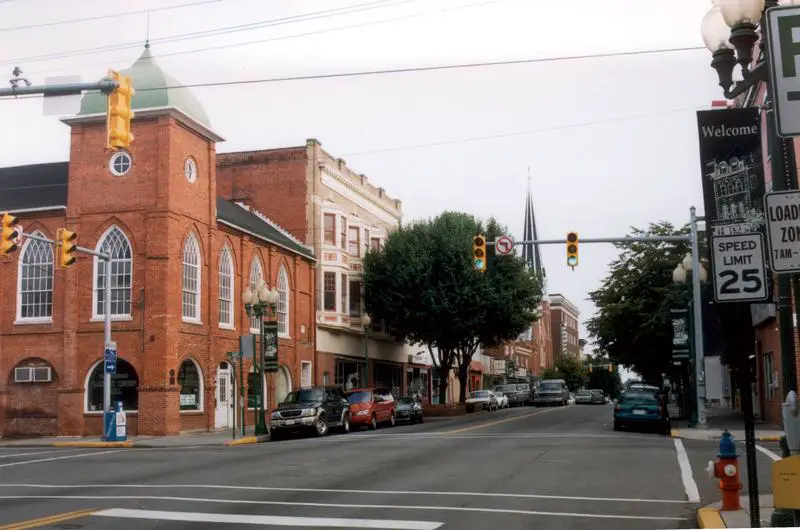
Rank Last Year: 6 (No Change)
Population: 18,904.0
Population 2010: 17,133
Growth: 10.3%
More on Martinsburg: Data | Cost Of Living | Real Estate

/10
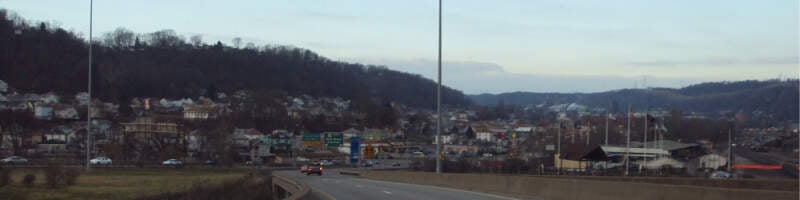
Rank Last Year: 7 (No Change)
Population: 18,647.0
Population 2010: 19,753
Growth: -5.6%
More on Weirton: Data | Crime | Cost Of Living | Real Estate

/10
Rank Last Year: 8 (No Change)
Population: 18,221.0
Population 2010: 18,865
Growth: -3.4%
More on Fairmont: Data | Crime | Cost Of Living | Real Estate

/10
Rank Last Year: 9 (No Change)
Population: 16,818.0
Population 2010: 17,503
Growth: -3.9%
More on Beckley: Data | Crime | Cost Of Living | Real Estate

/10
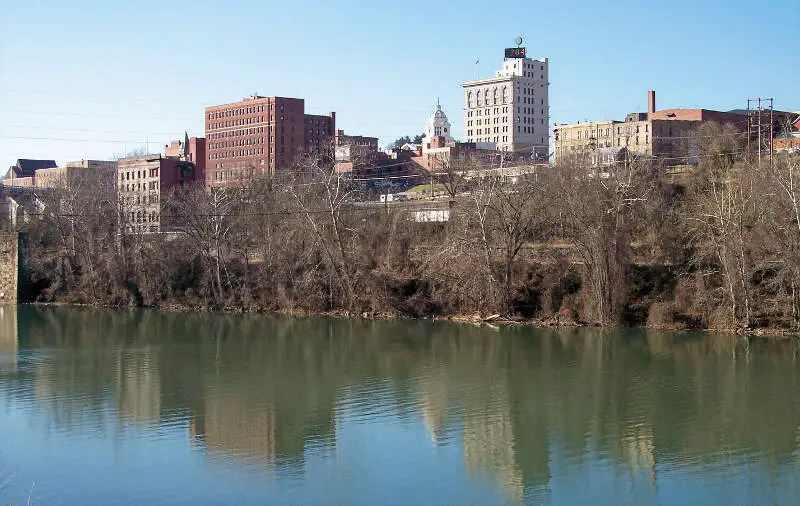
Rank Last Year: 10 (No Change)
Population: 15,549.0
Population 2010: 16,542
Growth: -6.0%
More on Clarksburg: Data | Crime | Cost Of Living | Real Estate
How We Determined The Largest Cities In West Virginia
We've been ranking and dissecting cities in the Mountain State for over 4 years now -- making this actually the fourth time we've run the numbers. We always use the best data, the US Census. In this case, that means we are using the American Community Survey.
It what is probably the most simple analysis we run each year, we ranked every place in West Virginia from biggest to smallest. The biggest city this year? That would be Charleston.
The smallest? Lavalette, although there are places smaller than 1,000 people not listed here, so keep that in mind as we take a look at the top ten.
Now on to numbers 11-100 Biggest in West Virginia
We hope that you find the big city, or really any city, that's right for you. Below is a list of the rest of the biggest cities along with every other place in West Virginia.
Have fun snacking around in the Mountain State!
For more reading on West Virginia, check out:
- Best Places To Raise A Family In West Virginia
- Best Places To Retire In West Virginia
- Richest Cities In West Virginia
- Safest Places In West Virginia
- Worst Places To Live In West Virginia
- Most Expensive Places To Live In West Virginia
Detailed List Of The Biggest Cities In West Virginia
| Rank | City | Current Population | 2010 | Growth |
|---|---|---|---|---|
| 1 | Charleston | 47,421.0 | 51,432 | -7.8% |
| 2 | Huntington | 45,787.0 | 49,228 | -7.0% |
| 3 | Morgantown | 30,236.0 | 29,076 | 4.0% |
| 4 | Parkersburg | 29,240.0 | 31,742 | -7.9% |
| 5 | Wheeling | 26,350.0 | 28,861 | -8.7% |
| 6 | Martinsburg | 18,904.0 | 17,133 | 10.3% |
| 7 | Weirton | 18,647.0 | 19,753 | -5.6% |
| 8 | Fairmont | 18,221.0 | 18,865 | -3.4% |
| 9 | Beckley | 16,818.0 | 17,503 | -3.9% |
| 10 | Clarksburg | 15,549.0 | 16,542 | -6.0% |
| 11 | Teays Valley | 14,151.0 | 13,659 | 3.6% |
| 12 | South Charleston | 13,457.0 | 13,390 | 0.5% |
| 13 | Cheat Lake | 10,902.0 | 7,638 | 42.7% |
| 14 | St. Albans | 10,522.0 | 11,071 | -5.0% |
| 15 | Vienna | 10,518.0 | 10,724 | -1.9% |
| 16 | Cross Lanes | 9,671.0 | 9,221 | 4.9% |
| 17 | Bluefield | 9,387.0 | 10,538 | -10.9% |
| 18 | Bridgeport | 9,252.0 | 7,978 | 16.0% |
| 19 | Oak Hill | 7,937.0 | 7,659 | 3.6% |
| 20 | Moundsville | 7,869.0 | 9,403 | -16.3% |
| 21 | Charles Town | 7,337.0 | 5,074 | 44.6% |
| 22 | Dunbar | 7,254.0 | 7,866 | -7.8% |
| 23 | Pea Ridge | 6,988.0 | 6,893 | 1.4% |
| 24 | Hurricane | 6,855.0 | 6,264 | 9.4% |
| 25 | Nitro | 6,853.0 | 7,083 | -3.2% |
| 26 | Elkins | 6,811.0 | 7,144 | -4.7% |
| 27 | Brookhaven | 6,212.0 | 5,307 | 17.1% |
| 28 | Princeton | 5,736.0 | 6,370 | -10.0% |
| 29 | New Martinsville | 5,133.0 | 5,418 | -5.3% |
| 30 | Buckhannon | 5,116.0 | 5,628 | -9.1% |
| 31 | Keyser | 4,857.0 | 5,311 | -8.5% |
| 32 | Grafton | 4,618.0 | 5,212 | -11.4% |
| 33 | Barboursville | 4,376.0 | 3,780 | 15.8% |
| 34 | Pinch | 4,037.0 | 2,707 | 49.1% |
| 35 | Westover | 4,026.0 | 3,935 | 2.3% |
| 36 | Point Pleasant | 3,961.0 | 4,400 | -10.0% |
| 37 | Weston | 3,840.0 | 4,218 | -9.0% |
| 38 | Lewisburg | 3,835.0 | 3,802 | 0.9% |
| 39 | Ravenswood | 3,830.0 | 3,918 | -2.2% |
| 40 | Sissonville | 3,593.0 | 5,056 | -28.9% |
| 41 | Welch | 3,507.0 | 2,462 | 42.4% |
| 42 | Pleasant Valley | 3,482.0 | 3,136 | 11.0% |
| 43 | Shannondale | 3,465.0 | 2,529 | 37.0% |
| 44 | Shady Spring | 3,381.0 | 2,861 | 18.2% |
| 45 | Summersville | 3,373.0 | 0 | nan% |
| 46 | Blennerhassett | 3,282.0 | 3,033 | 8.2% |
| 47 | Ripley | 3,071.0 | 3,310 | -7.2% |
| 48 | Culloden | 3,040.0 | 2,795 | 8.8% |
| 49 | Williamstown | 2,980.0 | 2,912 | 2.3% |
| 50 | Kingwood | 2,973.0 | 2,996 | -0.8% |
| 51 | Kenova | 2,944.0 | 3,273 | -10.1% |
| 52 | Williamson | 2,919.0 | 3,212 | -9.1% |
| 53 | Winfield | 2,918.0 | 2,670 | 9.3% |
| 54 | Philippi | 2,861.0 | 2,942 | -2.8% |
| 55 | Fayetteville | 2,817.0 | 2,959 | -4.8% |
| 56 | Milton | 2,817.0 | 2,510 | 12.2% |
| 57 | Inwood | 2,794.0 | 3,024 | -7.6% |
| 58 | Madison | 2,788.0 | 3,035 | -8.1% |
| 59 | Follansbee | 2,757.0 | 2,999 | -8.1% |
| 60 | Bethlehem | 2,592.0 | 2,829 | -8.4% |
| 61 | White Sulphur Springs | 2,549.0 | 2,514 | 1.4% |
| 62 | Moorefield | 2,525.0 | 2,535 | -0.4% |
| 63 | Paden City | 2,415.0 | 2,739 | -11.8% |
| 64 | Richwood | 2,403.0 | 2,429 | -1.1% |
| 65 | Mineralwells | 2,389.0 | 1,743 | 37.1% |
| 66 | Petersburg | 2,384.0 | 2,882 | -17.3% |
| 67 | Shinnston | 2,352.0 | 2,279 | 3.2% |
| 68 | Spencer | 2,291.0 | 2,547 | -10.1% |
| 69 | Stonewood | 2,212.0 | 2,139 | 3.4% |
| 70 | Wellsburg | 2,203.0 | 2,816 | -21.8% |
| 71 | Craigsville | 2,190.0 | 3,129 | -30.0% |
| 72 | Falling Waters | 2,183.0 | 776 | 181.3% |
| 73 | Chester | 2,179.0 | 2,585 | -15.7% |
| 74 | St. Marys | 2,174.0 | 2,505 | -13.2% |
| 75 | Hooverson Heights | 2,090.0 | 3,082 | -32.2% |
| 76 | Hinton | 2,086.0 | 2,672 | -21.9% |
| 77 | Nutter Fort | 2,075.0 | 1,694 | 22.5% |
| 78 | Mullens | 2,034.0 | 1,822 | 11.6% |
| 79 | Bluewell | 1,992.0 | 2,269 | -12.2% |
| 80 | Star City | 1,960.0 | 1,762 | 11.2% |
| 81 | Romney | 1,922.0 | 2,495 | -23.0% |
| 82 | Terra Alta | 1,841.0 | 1,872 | -1.7% |
| 83 | Mannington | 1,829.0 | 2,412 | -24.2% |
| 84 | Mcmechen | 1,826.0 | 1,541 | 18.5% |
| 85 | Belington | 1,781.0 | 2,110 | -15.6% |
| 86 | Alum Creek | 1,749.0 | 1,391 | 25.7% |
| 87 | Eleanor | 1,726.0 | 1,669 | 3.4% |
| 88 | Chesapeake | 1,702.0 | 1,701 | 0.1% |
| 89 | Wayne | 1,675.0 | 1,848 | -9.4% |
| 90 | Salem | 1,629.0 | 1,894 | -14.0% |
| 91 | Belle | 1,611.0 | 1,220 | 32.0% |
| 92 | Harrisville | 1,574.0 | 2,185 | -28.0% |
| 93 | Ceredo | 1,528.0 | 1,883 | -18.9% |
| 94 | Sophia | 1,528.0 | 1,211 | 26.2% |
| 95 | Marmet | 1,524.0 | 1,651 | -7.7% |
| 96 | Montgomery | 1,516.0 | 2,368 | -36.0% |
| 97 | Mount Hope | 1,504.0 | 1,418 | 6.1% |
| 98 | Lubeck | 1,495.0 | 1,322 | 13.1% |
| 99 | Athens | 1,494.0 | 989 | 51.1% |
| 100 | Macarthur | 1,493.0 | 1,441 | 3.6% |
| 101 | New Haven | 1,493.0 | 1,706 | -12.5% |
| 102 | Daniels | 1,489.0 | 1,557 | -4.4% |
| 103 | West Liberty | 1,481.0 | 1,328 | 11.5% |
| 104 | Glen Dale | 1,461.0 | 1,601 | -8.7% |
| 105 | Shepherd | 1,460.0 | 1,811 | -19.4% |
| 106 | Rainelle | 1,458.0 | 1,389 | 5.0% |
| 107 | Stanaford | 1,449.0 | 1,587 | -8.7% |
| 108 | Parsons | 1,448.0 | 1,725 | -16.1% |
| 109 | Barrackville | 1,430.0 | 1,427 | 0.2% |
| 110 | Bradley | 1,424.0 | 2,122 | -32.9% |
| 111 | Coal Fork | 1,423.0 | 1,141 | 24.7% |
| 112 | Ronceverte | 1,419.0 | 1,737 | -18.3% |
| 113 | Mallory | 1,417.0 | 1,512 | -6.3% |
| 114 | Sistersville | 1,409.0 | 1,608 | -12.4% |
| 115 | Boaz | 1,400.0 | 1,667 | -16.0% |
| 116 | Mabscott | 1,396.0 | 1,571 | -11.1% |
| 117 | Prosperity | 1,389.0 | 1,603 | -13.3% |
| 118 | Alderson | 1,383.0 | 1,256 | 10.1% |
| 119 | Pennsboro | 1,334.0 | 1,315 | 1.4% |
| 120 | Lesage | 1,329.0 | 1,316 | 1.0% |
| 121 | Fairlea | 1,312.0 | 2,516 | -47.9% |
| 122 | Logan | 1,294.0 | 1,438 | -10.0% |
| 123 | Fort Ashby | 1,283.0 | 2,096 | -38.8% |
| 124 | Granville | 1,257.0 | 647 | 94.3% |
| 125 | Newell | 1,246.0 | 1,044 | 19.3% |
| 126 | Benwood | 1,230.0 | 1,385 | -11.2% |
| 127 | Bolivar | 1,215.0 | 788 | 54.2% |
| 128 | Oceana | 1,203.0 | 1,722 | -30.1% |
| 129 | Marlinton | 1,201.0 | 1,397 | -14.0% |
| 130 | Mount Gay-Shamrock | 1,166.0 | 1,621 | -28.1% |
| 131 | Buffalo | 1,150.0 | 1,274 | -9.7% |
| 132 | Cassville | 1,149.0 | 750 | 53.2% |
| 133 | Shenandoah Junction | 1,141.0 | 509 | 124.2% |
| 134 | Ansted | 1,140.0 | 1,536 | -25.8% |
| 135 | Washington | 1,139.0 | 1,475 | -22.8% |
| 136 | Crab Orchard | 1,139.0 | 3,007 | -62.1% |
| 137 | Tornado | 1,114.0 | 0 | nan% |
| 138 | Brush Fork | 1,096.0 | 1,049 | 4.5% |
| 139 | Enterprise | 1,087.0 | 1,052 | 3.3% |
| 140 | Hamlin | 1,068.0 | 1,224 | -12.7% |
| 141 | Rand | 1,064.0 | 1,416 | -24.9% |
| 142 | Gilbert Creek | 1,061.0 | 1,461 | -27.4% |
| 143 | Man | 1,049.0 | 1,077 | -2.6% |
| 144 | Bethany | 1,039.0 | 725 | 43.3% |
| 145 | West Union | 1,039.0 | 829 | 25.3% |
| 146 | Addison (Webster Springs) | 1,038.0 | 952 | 9.0% |
| 147 | Glenville | 1,037.0 | 2,245 | -53.8% |
| 148 | Carpendale | 1,035.0 | 920 | 12.5% |
| 149 | Lavalette | 1,005.0 | 707 | 42.1% |