Cheyenne, WY
Demographics And Statistics
Living In Cheyenne, Wyoming Summary
Life in Cheyenne research summary. HomeSnacks has been using Saturday Night Science to research the quality of life in Cheyenne over the past nine years using Census, FBI, Zillow, and other primary data sources. Based on the most recently available data, we found the following about life in Cheyenne:
The population in Cheyenne is 64,976.
The median home value in Cheyenne is $377,300.
The median income in Cheyenne is $77,176.
The cost of living in Cheyenne is 105 which is 1.1x higher than the national average.
The median rent in Cheyenne is $1,035.
The unemployment rate in Cheyenne is 3.1%.
The poverty rate in Cheyenne is 9.3%.
The average high in Cheyenne is 58.8° and the average low is 33.0°.
Cheyenne SnackAbility
Overall SnackAbility
Cheyenne, WY Crime Report
Crime in Cheyenne summary. We use data from the FBI to determine the crime rates in Cheyenne. Key points include:
There were 2,161 total crimes in Cheyenne in the last reporting year.
The overall crime rate per 100,000 people in Cheyenne is 3,317.3 / 100k people.
The violent crime rate per 100,000 people in Cheyenne is 328.5 / 100k people.
The property crime rate per 100,000 people in Cheyenne is 2,988.8 / 100k people.
Overall, crime in Cheyenne is 56.53% above the national average.
Total Crimes
Above National Average
Crime In Cheyenne Comparison Table
| Statistic | Count Raw |
Cheyenne / 100k People |
Wyoming / 100k People |
National / 100k People |
|---|---|---|---|---|
| Total Crimes Per 100K | 2,161 | 3,317.3 | 1,435.3 | 2,119.2 |
| Violent Crime | 214 | 328.5 | 203.4 | 359.0 |
| Murder | 2 | 3.1 | 2.4 | 5.0 |
| Robbery | 18 | 27.6 | 7.1 | 61.0 |
| Aggravated Assault | 135 | 207.2 | 135.8 | 256.0 |
| Property Crime | 1,947 | 2,988.8 | 1,231.9 | 1,760.0 |
| Burglary | 256 | 393.0 | 171.2 | 229.0 |
| Larceny | 1,540 | 2,364.0 | 954.5 | 1,272.0 |
| Car Theft | 151 | 231.8 | 106.2 | 259.0 |
Cheyenne, WY Cost Of Living
Cost of living in Cheyenne summary. We use data on the cost of living to determine how expensive it is to live in Cheyenne. Real estate prices drive most of the variance in cost of living around Wyoming. Key points include:
The cost of living in Cheyenne is 105 with 100 being average.
The cost of living in Cheyenne is 1.1x higher than the national average.
The median home value in Cheyenne is $377,300.
The median income in Cheyenne is $77,176.
Cheyenne's Overall Cost Of Living
Higher Than The National Average
Cost Of Living In Cheyenne Comparison Table
| Living Expense | Cheyenne | Wyoming | National Average | |
|---|---|---|---|---|
| Overall | 105 | 97 | 100 | |
| Services | 100 | 99 | 100 | |
| Groceries | 104 | 103 | 100 | |
| Health | 104 | 101 | 100 | |
| Housing | 116 | 100 | 100 | |
| Transportation | 97 | 92 | 100 | |
| Utilities | 85 | 88 | 100 | |
Cheyenne, WY Weather
The average high in Cheyenne is 58.8° and the average low is 33.0°.
There are 41.0 days of precipitation each year.
Expect an average of 15.9 inches of precipitation each year with 59.3 inches of snow.
| Stat | Cheyenne |
|---|---|
| Average Annual High | 58.8 |
| Average Annual Low | 33.0 |
| Annual Precipitation Days | 41.0 |
| Average Annual Precipitation | 15.9 |
| Average Annual Snowfall | 59.3 |
Average High
Days of Rain
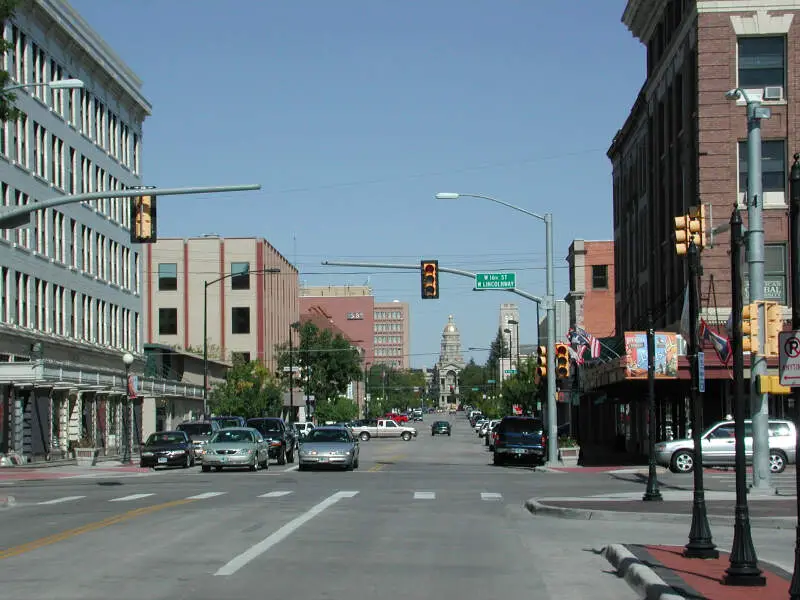
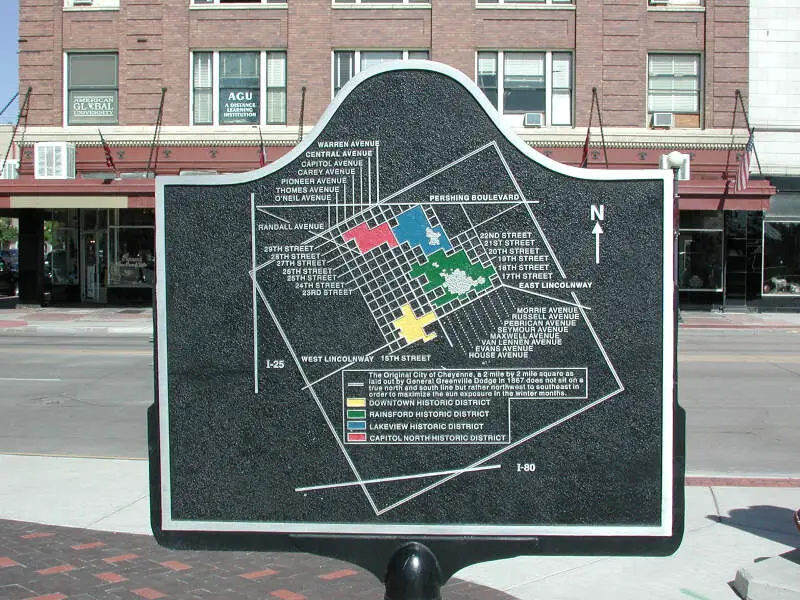
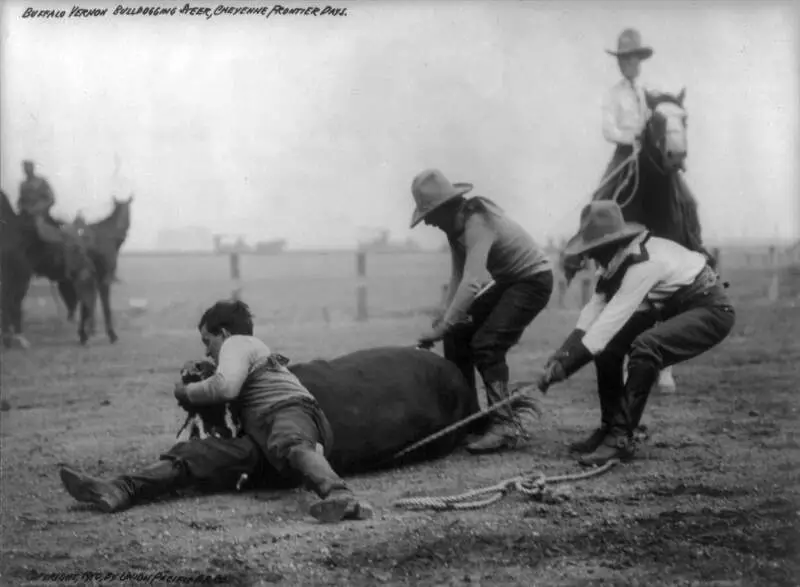
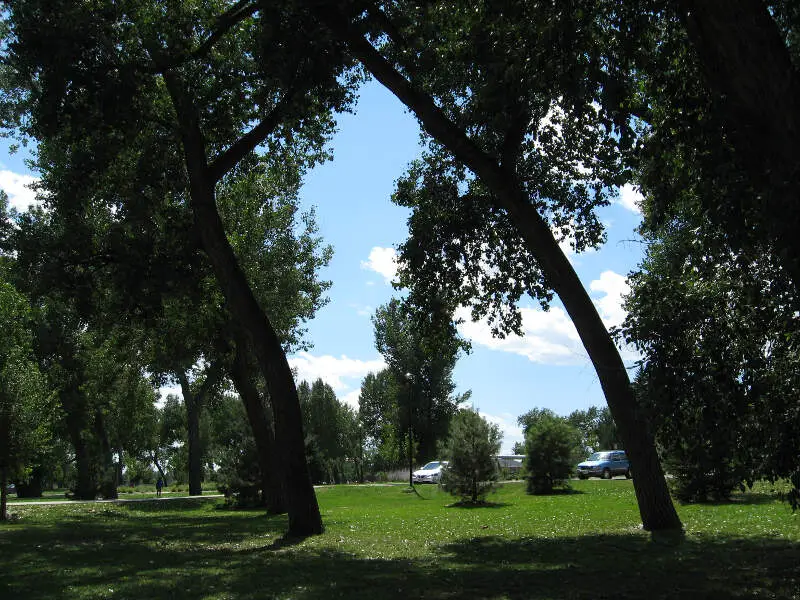
Cheyenne, WY Photos
1 Reviews & Comments About Cheyenne
/5

HomeSnacks User - 2018-08-03 12:43:59.514680
It was a very nice, quiet town. I had a hard time navigating - most of the cities and towns I have traveled to have a very intuitive layout, but not Cheyenne.
Lack of grocery stores close to I-25; it was very difficult to find what my family needed in terms of groceries due to the sparsity of stores.
Rankings for Cheyenne in Wyoming


Locations Around Cheyenne
Map Of Cheyenne, WY
Best Places Around Cheyenne
Windsor, CO
Population 35,918
Ranchettes, WY
Population 6,389
Fort Collins, CO
Population 169,705
Laramie, WY
Population 31,848
Wellington, CO
Population 11,538
Cheyenne Demographics And Statistics
Population over time in Cheyenne
The current population in Cheyenne is 64,976. The population has increased 12.2% from 2010.
| Year | Population | % Change |
|---|---|---|
| 2023 | 64,976 | 0.3% |
| 2022 | 64,795 | 0.3% |
| 2021 | 64,610 | 0.8% |
| 2020 | 64,099 | 0.8% |
| 2019 | 63,607 | 0.6% |
| 2018 | 63,243 | 0.4% |
| 2017 | 62,986 | 0.2% |
| 2016 | 62,879 | 1.1% |
| 2015 | 62,195 | 1.2% |
| 2014 | 61,470 | 1.6% |
| 2013 | 60,528 | 1.6% |
| 2012 | 59,582 | 1.6% |
| 2011 | 58,640 | 1.2% |
| 2010 | 57,935 | - |
Race / Ethnicity in Cheyenne
Cheyenne is:
75.0% White with 48,753 White residents.
2.8% African American with 1,830 African American residents.
0.6% American Indian with 358 American Indian residents.
1.1% Asian with 720 Asian residents.
0.2% Hawaiian with 105 Hawaiian residents.
0.8% Other with 488 Other residents.
3.6% Two Or More with 2,329 Two Or More residents.
16.0% Hispanic with 10,393 Hispanic residents.
| Race | Cheyenne | WY | USA |
|---|---|---|---|
| White | 75.0% | 82.1% | 58.2% |
| African American | 2.8% | 0.8% | 12.0% |
| American Indian | 0.6% | 1.7% | 0.5% |
| Asian | 1.1% | 0.8% | 5.7% |
| Hawaiian | 0.2% | 0.1% | 0.2% |
| Other | 0.8% | 0.6% | 0.5% |
| Two Or More | 3.6% | 3.5% | 3.9% |
| Hispanic | 16.0% | 10.4% | 19.0% |
Gender in Cheyenne
Cheyenne is 50.0% female with 32,506 female residents.
Cheyenne is 50.0% male with 32,470 male residents.
| Gender | Cheyenne | WY | USA |
|---|---|---|---|
| Female | 50.0% | 48.8% | 50.5% |
| Male | 50.0% | 51.2% | 49.5% |
Highest level of educational attainment in Cheyenne for adults over 25
2.0% of adults in Cheyenne completed < 9th grade.
3.0% of adults in Cheyenne completed 9-12th grade.
24.0% of adults in Cheyenne completed high school / ged.
25.0% of adults in Cheyenne completed some college.
13.0% of adults in Cheyenne completed associate's degree.
20.0% of adults in Cheyenne completed bachelor's degree.
10.0% of adults in Cheyenne completed master's degree.
2.0% of adults in Cheyenne completed professional degree.
1.0% of adults in Cheyenne completed doctorate degree.
| Education | Cheyenne | WY | USA |
|---|---|---|---|
| < 9th Grade | 2.0% | 1.0% | 5.0% |
| 9-12th Grade | 3.0% | 4.0% | 6.0% |
| High School / GED | 24.0% | 28.0% | 26.0% |
| Some College | 25.0% | 25.0% | 19.0% |
| Associate's Degree | 13.0% | 12.0% | 9.0% |
| Bachelor's Degree | 20.0% | 19.0% | 21.0% |
| Master's Degree | 10.0% | 8.0% | 10.0% |
| Professional Degree | 2.0% | 2.0% | 2.0% |
| Doctorate Degree | 1.0% | 1.0% | 2.0% |
Household Income For Cheyenne, Wyoming
4.2% of households in Cheyenne earn Less than $10,000.
3.1% of households in Cheyenne earn $10,000 to $14,999.
6.9% of households in Cheyenne earn $15,000 to $24,999.
6.9% of households in Cheyenne earn $25,000 to $34,999.
10.2% of households in Cheyenne earn $35,000 to $49,999.
16.9% of households in Cheyenne earn $50,000 to $74,999.
15.6% of households in Cheyenne earn $75,000 to $99,999.
20.6% of households in Cheyenne earn $100,000 to $149,999.
9.0% of households in Cheyenne earn $150,000 to $199,999.
6.5% of households in Cheyenne earn $200,000 or more.
| Income | Cheyenne | WY | USA |
|---|---|---|---|
| Less than $10,000 | 4.2% | 4.6% | 4.9% |
| $10,000 to $14,999 | 3.1% | 3.4% | 3.6% |
| $15,000 to $24,999 | 6.9% | 7.0% | 6.6% |
| $25,000 to $34,999 | 6.9% | 7.4% | 6.8% |
| $35,000 to $49,999 | 10.2% | 10.5% | 10.4% |
| $50,000 to $74,999 | 16.9% | 17.2% | 15.7% |
| $75,000 to $99,999 | 15.6% | 13.7% | 12.7% |
| $100,000 to $149,999 | 20.6% | 19.2% | 17.4% |
| $150,000 to $199,999 | 9.0% | 9.1% | 9.3% |
| $200,000 or more | 6.5% | 7.9% | 12.6% |


