Compare Fort Collins to…
Fort Collins SnackAbility
Overall SnackAbility
Crime in Fort Collins summary. We use data from the FBI to determine the crime rates in Fort Collins. Key points include:
There were 4,140 total crimes in Fort Collins in the last reporting year.
The overall crime rate per 100,000 people in Fort Collins is 2,428.0 / 100k people.
The violent crime rate per 100,000 people in Fort Collins is 272.7 / 100k people.
The property crime rate per 100,000 people in Fort Collins is 2,155.3 / 100k people.
Overall, crime in Fort Collins is 14.57% above the national average.
Total Crimes
Above National Average
Crime In Fort Collins Comparison Table
| Statistic | Count Raw |
Fort Collins / 100k People |
Colorado / 100k People |
National / 100k People |
|---|---|---|---|---|
| Total Crimes Per 100K | 4,140 | 2,428.0 | 3,069.1 | 2,119.2 |
| Violent Crime | 465 | 272.7 | 476.3 | 359.0 |
| Murder | 3 | 1.8 | 4.5 | 5.0 |
| Robbery | 42 | 24.6 | 63.0 | 61.0 |
| Aggravated Assault | 381 | 223.4 | 350.5 | 256.0 |
| Property Crime | 3,675 | 2,155.3 | 2,592.8 | 1,760.0 |
| Burglary | 390 | 228.7 | 348.0 | 229.0 |
| Larceny | 2,971 | 1,742.4 | 1,754.2 | 1,272.0 |
| Car Theft | 314 | 184.2 | 490.6 | 259.0 |
Source: FBI Uniform Crime Reporting (2024)
Cost of living in Fort Collins summary. We use data on the cost of living to determine how expensive it is to live in Fort Collins. Real estate prices drive most of the variance in cost of living around Colorado. Key points include:
The cost of living in Fort Collins is 135 with 100 being average.
The cost of living in Fort Collins is 1.4x higher than the national average.
The median home value in Fort Collins is $563,815.
The median income in Fort Collins is $85,070.
Fort Collins's Overall Cost Of Living
Higher Than The National Average
Cost Of Living In Fort Collins Comparison Table
| Living Expense | Fort Collins | Colorado | National Average |
|---|---|---|---|
| Overall | 135 | 114 | 100 |
| Services | 104 | 104 | 100 |
| Groceries | 104 | 107 | 100 |
| Health | 195 | 135 | 100 |
| Housing | 105 | 104 | 100 |
| Transportation | 108 | 107 | 100 |
| Utilities | 109 | 107 | 100 |
Source: Cost of living index, normalized to US average = 100
Fort Collins, CO Weather
The average high in Fort Collins is 60.4° and the average low is 32.9°.
There are 40.0 days of precipitation each year.
Expect an average of 16.7 inches of precipitation each year with 71.2 inches of snow.
| Stat | Fort Collins |
|---|---|
| Average Annual High | 60.4 |
| Average Annual Low | 32.9 |
| Annual Precipitation Days | 40.0 |
| Average Annual Precipitation | 16.7 |
| Average Annual Snowfall | 71.2 |
Average High
Days of Rain
Source: NOAA climate normals (30-year)
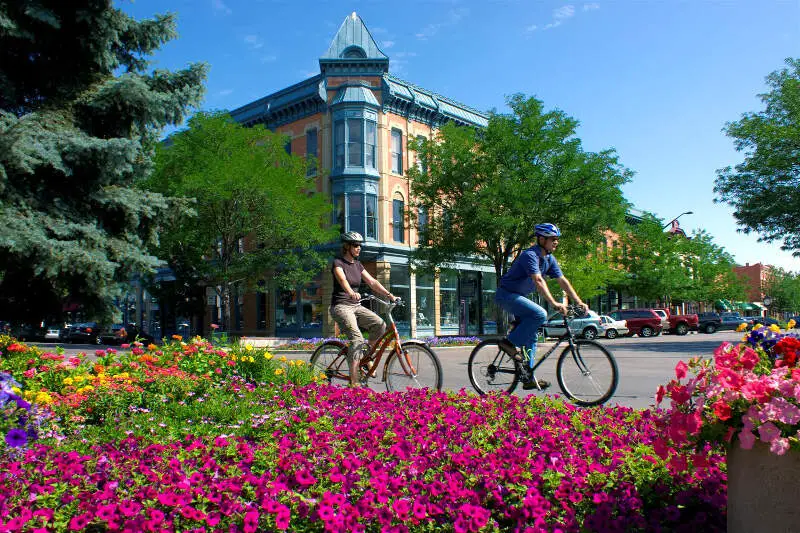
Fort Collins, CO Photos


2 Reviews & Comments About Fort Collins

LOW CRIME AND VERY PRESTIGIOUS SCHOOLS
SO MANY THINGS TO DO OUTDOORS. THE WEATHER IS NOT HUMID, WHICH I LOVE. THE PEOPLE ARE SO FRIENDLY.
crime in relatively low. the school system is top class.
so many things to do and the friendly people.
Rankings & Articles For Fort Collins


Locations Around Fort Collins
Map Of Fort Collins, CO
Best Places Around Fort Collins
Greeley, CO
Population 110,806
Windsor, CO
Population 37,914
Milliken, CO
Population 8,871
Loveland, CO
Population 78,410
Berthoud, CO
Population 12,411
Wellington, CO
Population 11,798
Johnstown, NY
Population 8,111
Fort Collins Demographics And Statistics
Population over time in Fort Collins
The current population in Fort Collins is 170,229. The population has increased 21.5% from 2010.
| Year | Population | % Change |
|---|---|---|
| 2024 | 170,229 | 0.3% |
| 2023 | 169,705 | 0.6% |
| 2022 | 168,758 | 1.2% |
| 2021 | 166,788 | 0.4% |
| 2020 | 166,069 | 0.3% |
| 2019 | 165,609 | 1.9% |
| 2018 | 162,511 | 2.1% |
| 2017 | 159,150 | 1.2% |
| 2016 | 157,251 | 2.6% |
| 2015 | 153,292 | 2.4% |
| 2014 | 149,627 | 1.9% |
| 2013 | 146,822 | 1.7% |
| 2012 | 144,329 | 1.4% |
| 2011 | 142,332 | 1.6% |
| 2010 | 140,082 | - |
Race / Ethnicity in Fort Collins
See the full breakdown
Fort Collins is:
77.3% White with 131,655 White residents.
1.3% African American with 2,134 African American residents.
0.3% American Indian with 432 American Indian residents.
3.3% Asian with 5,631 Asian residents.
0.1% Hawaiian with 214 Hawaiian residents.
0.6% Other with 1,039 Other residents.
4.3% Two Or More with 7,373 Two Or More residents.
12.8% Hispanic with 21,751 Hispanic residents.
| Race | Fort Collins | CO | USA |
|---|---|---|---|
| White | 77.3% | 64.8% | 57.4% |
| African American | 1.3% | 3.8% | 11.9% |
| American Indian | 0.3% | 0.4% | 0.5% |
| Asian | 3.3% | 3.2% | 5.9% |
| Hawaiian | 0.1% | 0.1% | 0.2% |
| Other | 0.6% | 0.5% | 0.6% |
| Two Or More | 4.3% | 4.6% | 4.3% |
| Hispanic | 12.8% | 22.5% | 19.3% |
Gender in Fort Collins
See the full breakdown
Fort Collins is 50.7% female with 86,228 female residents.
Fort Collins is 49.3% male with 84,001 male residents.
| Gender | Fort Collins | CO | USA |
|---|---|---|---|
| Female | 50.7% | 49.3% | 50.5% |
| Male | 49.3% | 50.7% | 49.5% |
Highest level of educational attainment in Fort Collins for adults over 25
See the full breakdown
-0.0% of adults in Fort Collins completed < 9th grade.
2.0% of adults in Fort Collins completed 9-12th grade.
13.0% of adults in Fort Collins completed high school / ged.
16.0% of adults in Fort Collins completed some college.
8.0% of adults in Fort Collins completed associate's degree.
35.0% of adults in Fort Collins completed bachelor's degree.
19.0% of adults in Fort Collins completed master's degree.
3.0% of adults in Fort Collins completed professional degree.
4.0% of adults in Fort Collins completed doctorate degree.
| Education | Fort Collins | CO | USA |
|---|---|---|---|
| < 9th Grade | -0.0% | 3.0% | 4.0% |
| 9-12th Grade | 2.0% | 4.0% | 6.0% |
| High School / GED | 13.0% | 20.0% | 26.0% |
| Some College | 16.0% | 19.0% | 19.0% |
| Associate's Degree | 8.0% | 8.0% | 9.0% |
| Bachelor's Degree | 35.0% | 28.0% | 22.0% |
| Master's Degree | 19.0% | 13.0% | 10.0% |
| Professional Degree | 3.0% | 3.0% | 2.0% |
| Doctorate Degree | 4.0% | 2.0% | 2.0% |
Household Income For Fort Collins, Colorado
See the full breakdown
6.4% of households in Fort Collins earn Less than $10,000.
2.7% of households in Fort Collins earn $10,000 to $14,999.
5.3% of households in Fort Collins earn $15,000 to $24,999.
5.7% of households in Fort Collins earn $25,000 to $34,999.
9.5% of households in Fort Collins earn $35,000 to $49,999.
15.1% of households in Fort Collins earn $50,000 to $74,999.
12.7% of households in Fort Collins earn $75,000 to $99,999.
18.2% of households in Fort Collins earn $100,000 to $149,999.
10.6% of households in Fort Collins earn $150,000 to $199,999.
13.7% of households in Fort Collins earn $200,000 or more.
| Income | Fort Collins | CO | USA |
|---|---|---|---|
| Less than $10,000 | 6.4% | 3.9% | 5.0% |
| $10,000 to $14,999 | 2.7% | 2.4% | 3.4% |
| $15,000 to $24,999 | 5.3% | 4.8% | 6.3% |
| $25,000 to $34,999 | 5.7% | 5.2% | 6.6% |
| $35,000 to $49,999 | 9.5% | 8.4% | 10.1% |
| $50,000 to $74,999 | 15.1% | 14.6% | 15.5% |
| $75,000 to $99,999 | 12.7% | 12.8% | 12.6% |
| $100,000 to $149,999 | 18.2% | 19.2% | 17.5% |
| $150,000 to $199,999 | 10.6% | 11.7% | 9.6% |
| $200,000 or more | 13.7% | 17.0% | 13.4% |
Source: U.S. Census ACS 5-year estimates (2024)


