Compare Raleigh to…
Raleigh SnackAbility
Overall SnackAbility
Crime in Raleigh summary. We use data from the FBI to determine the crime rates in Raleigh. Key points include:
There were 16,146 total crimes in Raleigh in the last reporting year.
The overall crime rate per 100,000 people in Raleigh is 3,308.0 / 100k people.
The violent crime rate per 100,000 people in Raleigh is 488.8 / 100k people.
The property crime rate per 100,000 people in Raleigh is 2,819.2 / 100k people.
Overall, crime in Raleigh is 56.10% above the national average.
Total Crimes
Above National Average
Crime In Raleigh Comparison Table
| Statistic | Count Raw |
Raleigh / 100k People |
North Carolina / 100k People |
National / 100k People |
|---|---|---|---|---|
| Total Crimes Per 100K | 16,146 | 3,308.0 | 2,343.9 | 2,119.2 |
| Violent Crime | 2,386 | 488.8 | 375.8 | 359.0 |
| Murder | 25 | 5.1 | 7.5 | 5.0 |
| Robbery | 423 | 86.7 | 50.2 | 61.0 |
| Aggravated Assault | 1,762 | 361.0 | 290.1 | 256.0 |
| Property Crime | 13,760 | 2,819.2 | 1,968.1 | 1,760.0 |
| Burglary | 1,362 | 279.0 | 323.9 | 229.0 |
| Larceny | 10,049 | 2,058.9 | 1,390.2 | 1,272.0 |
| Car Theft | 2,349 | 481.3 | 254.1 | 259.0 |
Source: FBI Uniform Crime Reporting (2024)
Cost of living in Raleigh summary. We use data on the cost of living to determine how expensive it is to live in Raleigh. Real estate prices drive most of the variance in cost of living around North Carolina. Key points include:
The cost of living in Raleigh is 116 with 100 being average.
The cost of living in Raleigh is 1.2x higher than the national average.
The median home value in Raleigh is $433,996.
The median income in Raleigh is $85,395.
Raleigh's Overall Cost Of Living
Higher Than The National Average
Cost Of Living In Raleigh Comparison Table
| Living Expense | Raleigh | North Carolina | National Average |
|---|---|---|---|
| Overall | 116 | 95 | 100 |
| Services | 101 | 98 | 100 |
| Groceries | 101 | 98 | 100 |
| Health | 144 | 89 | 100 |
| Housing | 106 | 100 | 100 |
| Transportation | 100 | 97 | 100 |
| Utilities | 106 | 101 | 100 |
Source: Cost of living index, normalized to US average = 100
Raleigh, NC Weather
The average high in Raleigh is 71.0° and the average low is 48.5°.
There are 74.1 days of precipitation each year.
Expect an average of 45.6 inches of precipitation each year with 3.7 inches of snow.
| Stat | Raleigh |
|---|---|
| Average Annual High | 71.0 |
| Average Annual Low | 48.5 |
| Annual Precipitation Days | 74.1 |
| Average Annual Precipitation | 45.6 |
| Average Annual Snowfall | 3.7 |
Average High
Days of Rain
Source: NOAA climate normals (30-year)
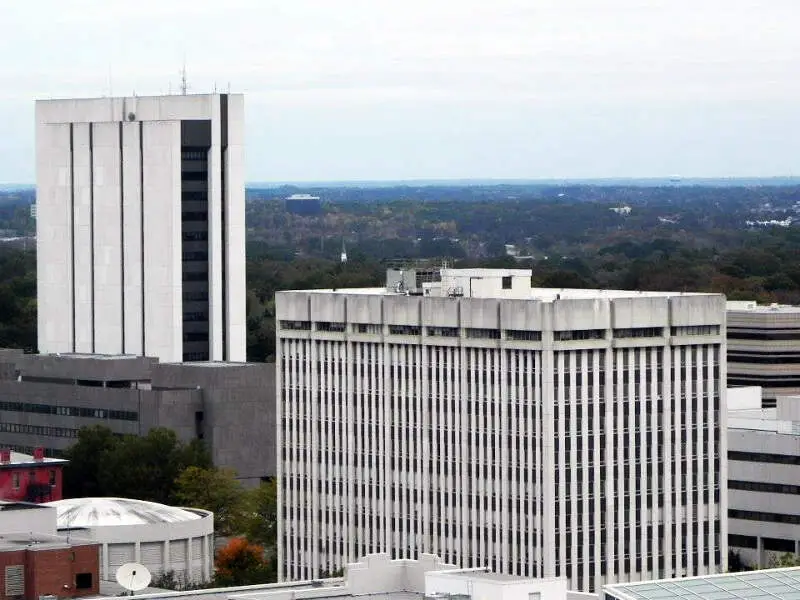
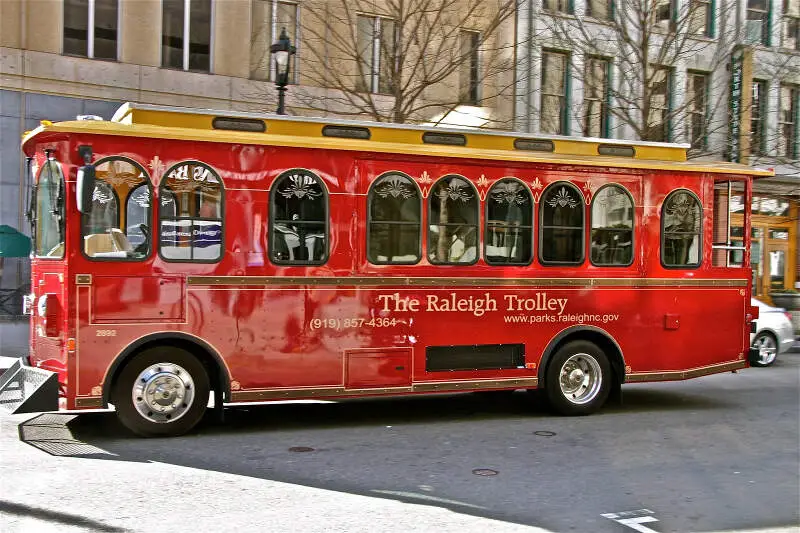
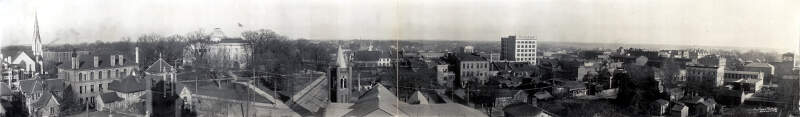
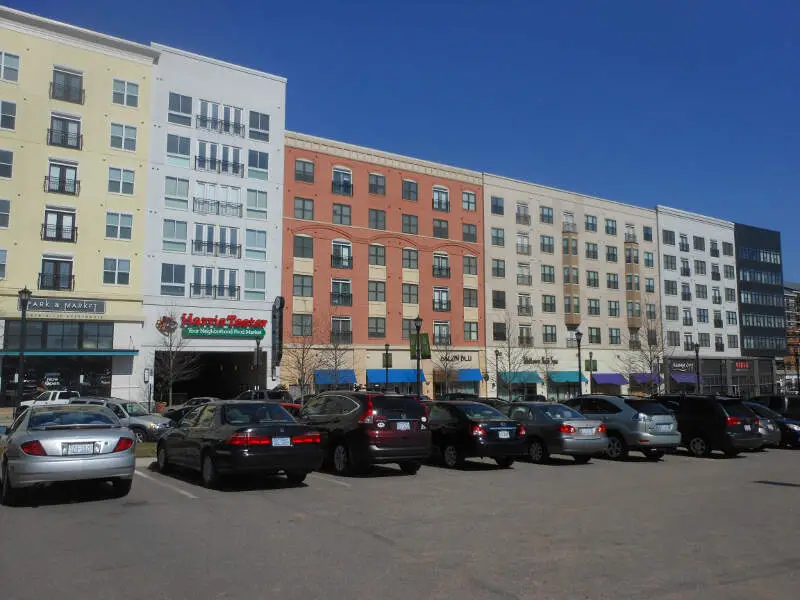
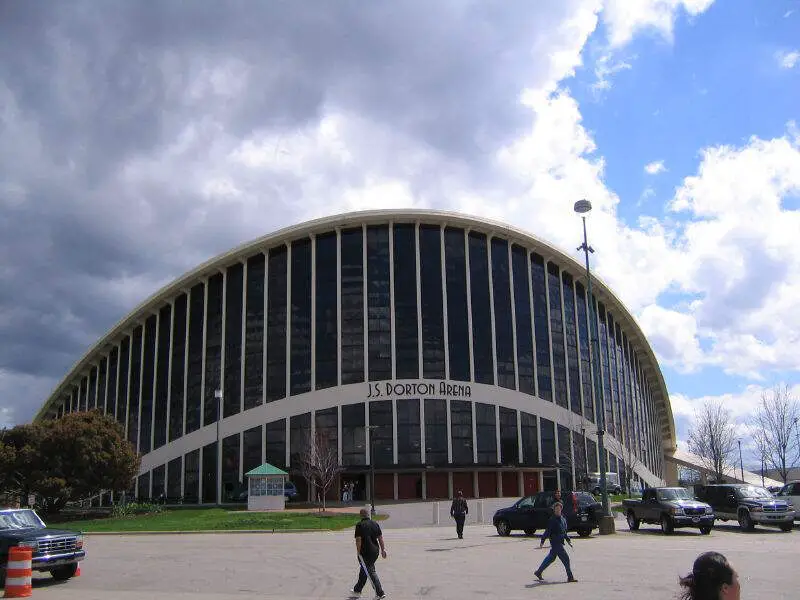
Raleigh, NC Photos


Rankings & Articles For Raleigh


Locations Around Raleigh
Map Of Raleigh, NC
Best Places Around Raleigh
Cary, NC
Population 179,306
Apex, NC
Population 70,630
Wake Forest, NC
Population 52,844
Morrisville, NC
Population 31,422
Holly Springs, NC
Population 45,248
Garner, NC
Population 34,473
Knightdale, NC
Population 20,214
Fuquay-Varina, NC
Population 40,485
Durham, NC
Population 291,467
Clayton, NC
Population 29,320
Raleigh Demographics And Statistics
Population over time in Raleigh
The current population in Raleigh is 481,031. The population has increased 25.7% from 2010.
| Year | Population | % Change |
|---|---|---|
| 2024 | 481,031 | 2.2% |
| 2023 | 470,763 | 1.1% |
| 2022 | 465,517 | 0.7% |
| 2021 | 462,219 | -1.6% |
| 2020 | 469,698 | 1.1% |
| 2019 | 464,485 | 1.6% |
| 2018 | 457,159 | 1.7% |
| 2017 | 449,477 | 1.8% |
| 2016 | 441,326 | 2.0% |
| 2015 | 432,520 | 2.2% |
| 2014 | 423,287 | 2.1% |
| 2013 | 414,530 | 2.4% |
| 2012 | 405,007 | 2.5% |
| 2011 | 395,091 | 3.2% |
| 2010 | 382,729 | - |
Race / Ethnicity in Raleigh
See the full breakdown
Raleigh is:
51.1% White with 246,042 White residents.
26.0% African American with 125,059 African American residents.
0.2% American Indian with 810 American Indian residents.
5.2% Asian with 24,783 Asian residents.
0.0% Hawaiian with 82 Hawaiian residents.
0.5% Other with 2,593 Other residents.
4.4% Two Or More with 21,160 Two Or More residents.
12.6% Hispanic with 60,502 Hispanic residents.
| Race | Raleigh | NC | USA |
|---|---|---|---|
| White | 51.1% | 60.0% | 57.4% |
| African American | 26.0% | 20.0% | 11.9% |
| American Indian | 0.2% | 0.8% | 0.5% |
| Asian | 5.2% | 3.3% | 5.9% |
| Hawaiian | 0.0% | 0.1% | 0.2% |
| Other | 0.5% | 0.5% | 0.6% |
| Two Or More | 4.4% | 4.1% | 4.3% |
| Hispanic | 12.6% | 11.3% | 19.3% |
Gender in Raleigh
See the full breakdown
Raleigh is 51.5% female with 247,802 female residents.
Raleigh is 48.5% male with 233,229 male residents.
| Gender | Raleigh | NC | USA |
|---|---|---|---|
| Female | 51.5% | 51.1% | 50.5% |
| Male | 48.5% | 48.9% | 49.5% |
Highest level of educational attainment in Raleigh for adults over 25
See the full breakdown
3.0% of adults in Raleigh completed < 9th grade.
4.0% of adults in Raleigh completed 9-12th grade.
16.0% of adults in Raleigh completed high school / ged.
16.0% of adults in Raleigh completed some college.
7.0% of adults in Raleigh completed associate's degree.
33.0% of adults in Raleigh completed bachelor's degree.
15.0% of adults in Raleigh completed master's degree.
3.0% of adults in Raleigh completed professional degree.
3.0% of adults in Raleigh completed doctorate degree.
| Education | Raleigh | NC | USA |
|---|---|---|---|
| < 9th Grade | 3.0% | 3.0% | 4.0% |
| 9-12th Grade | 4.0% | 6.0% | 6.0% |
| High School / GED | 16.0% | 25.0% | 26.0% |
| Some College | 16.0% | 20.0% | 19.0% |
| Associate's Degree | 7.0% | 10.0% | 9.0% |
| Bachelor's Degree | 33.0% | 22.0% | 22.0% |
| Master's Degree | 15.0% | 10.0% | 10.0% |
| Professional Degree | 3.0% | 2.0% | 2.0% |
| Doctorate Degree | 3.0% | 2.0% | 2.0% |
Household Income For Raleigh, North Carolina
See the full breakdown
4.1% of households in Raleigh earn Less than $10,000.
2.6% of households in Raleigh earn $10,000 to $14,999.
5.6% of households in Raleigh earn $15,000 to $24,999.
5.7% of households in Raleigh earn $25,000 to $34,999.
10.9% of households in Raleigh earn $35,000 to $49,999.
15.4% of households in Raleigh earn $50,000 to $74,999.
13.0% of households in Raleigh earn $75,000 to $99,999.
17.5% of households in Raleigh earn $100,000 to $149,999.
10.1% of households in Raleigh earn $150,000 to $199,999.
15.2% of households in Raleigh earn $200,000 or more.
| Income | Raleigh | NC | USA |
|---|---|---|---|
| Less than $10,000 | 4.1% | 5.0% | 5.0% |
| $10,000 to $14,999 | 2.6% | 3.7% | 3.4% |
| $15,000 to $24,999 | 5.6% | 7.1% | 6.3% |
| $25,000 to $34,999 | 5.7% | 7.4% | 6.6% |
| $35,000 to $49,999 | 10.9% | 11.7% | 10.1% |
| $50,000 to $74,999 | 15.4% | 16.8% | 15.5% |
| $75,000 to $99,999 | 13.0% | 13.0% | 12.6% |
| $100,000 to $149,999 | 17.5% | 16.6% | 17.5% |
| $150,000 to $199,999 | 10.1% | 8.3% | 9.6% |
| $200,000 or more | 15.2% | 10.4% | 13.4% |
Source: U.S. Census ACS 5-year estimates (2024)


