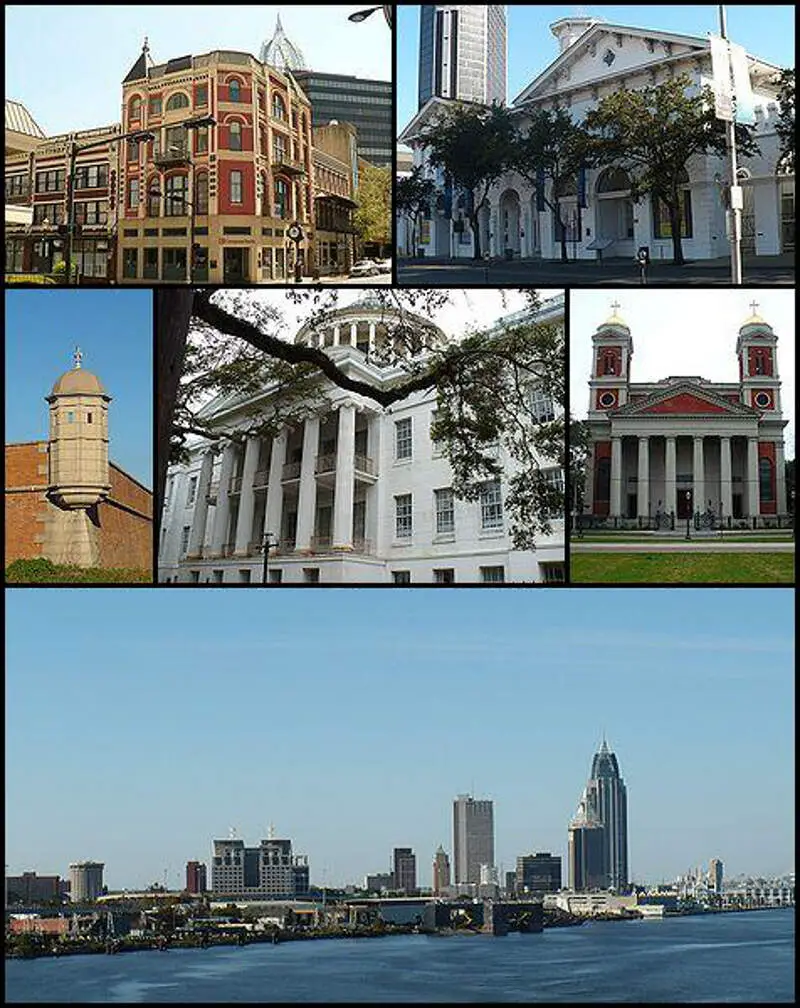
Mobile, AL
Demographics And Statistics
Living In Mobile, Alabama Summary
Life in Mobile research summary. HomeSnacks has been using Saturday Night Science to research the quality of life in Mobile over the past nine years using Census, FBI, Zillow, and other primary data sources. Based on the most recently available data, we found the following about life in Mobile:
The population in Mobile is 185,097.
The median home value in Mobile is $195,238.
The median income in Mobile is $51,090.
The cost of living in Mobile is 89 which is 0.9x lower than the national average.
The median rent in Mobile is $1,029.
The unemployment rate in Mobile is 5.9%.
The poverty rate in Mobile is 18.9%.
The average high in Mobile is 76.6° and the average low is 57.0°.
Mobile SnackAbility
Overall SnackAbility
Mobile, AL Crime Report
Crime in Mobile summary. We use data from the FBI to determine the crime rates in Mobile. Key points include:
There were 5,753 total crimes in Mobile in the last reporting year.
The overall crime rate per 100,000 people in Mobile is 2,426.5 / 100k people.
The violent crime rate per 100,000 people in Mobile is 752.0 / 100k people.
The property crime rate per 100,000 people in Mobile is 1,674.5 / 100k people.
Overall, crime in Mobile is 14.50% above the national average.
Total Crimes
Above National Average
Crime In Mobile Comparison Table
| Statistic | Count Raw | Mobile / 100k People | Alabama / 100k People | National / 100k People |
|---|---|---|---|---|
| Total Crimes Per 100K | 5,753 | 2,426.5 | 1,924.9 | 2,119.2 |
| Violent Crime | 1,783 | 752.0 | 359.9 | 359.0 |
| Murder | 39 | 16.4 | 8.7 | 5.0 |
| Robbery | 125 | 52.7 | 34.0 | 61.0 |
| Aggravated Assault | 1,557 | 656.7 | 291.4 | 256.0 |
| Property Crime | 3,970 | 1,674.5 | 1,565.1 | 1,760.0 |
| Burglary | 743 | 313.4 | 243.5 | 229.0 |
| Larceny | 2,818 | 1,188.6 | 1,148.5 | 1,272.0 |
| Car Theft | 409 | 172.5 | 173.0 | 259.0 |
Mobile, AL Cost Of Living
Cost of living in Mobile summary. We use data on the cost of living to determine how expensive it is to live in Mobile. Real estate prices drive most of the variance in cost of living around Alabama. Key points include:
The cost of living in Mobile is 89 with 100 being average.
The cost of living in Mobile is 0.9x lower than the national average.
The median home value in Mobile is $195,238.
The median income in Mobile is $51,090.
Mobile's Overall Cost Of Living
Lower Than The National Average
Cost Of Living In Mobile Comparison Table
| Living Expense | Mobile | Alabama | National Average | |
|---|---|---|---|---|
| Overall | 89 | 90 | 100 | |
| Services | 99 | 97 | 100 | |
| Groceries | 96 | 98 | 100 | |
| Health | 107 | 86 | 100 | |
| Housing | 79 | 74 | 100 | |
| Transportation | 93 | 93 | 100 | |
| Utilities | 88 | 102 | 100 | |
Mobile, AL Weather
The average high in Mobile is 76.6° and the average low is 57.0°.
There are 78.5 days of precipitation each year.
Expect an average of 65.4 inches of precipitation each year with 0.1 inches of snow.
| Stat | Mobile |
|---|---|
| Average Annual High | 76.6 |
| Average Annual Low | 57.0 |
| Annual Precipitation Days | 78.5 |
| Average Annual Precipitation | 65.4 |
| Average Annual Snowfall | 0.1 |
Average High
Days of Rain
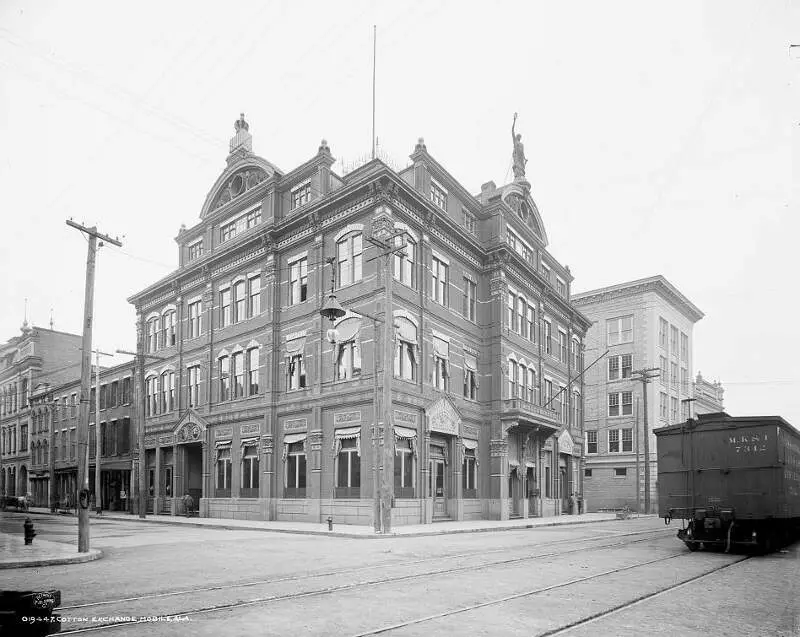
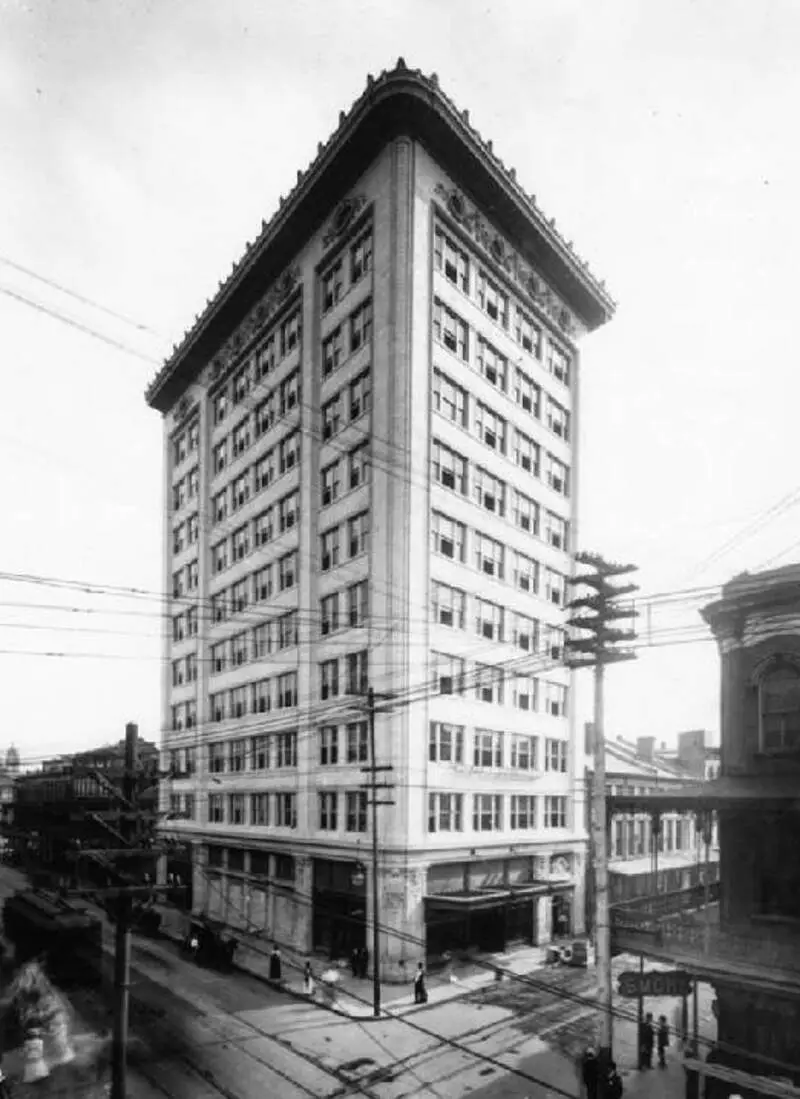
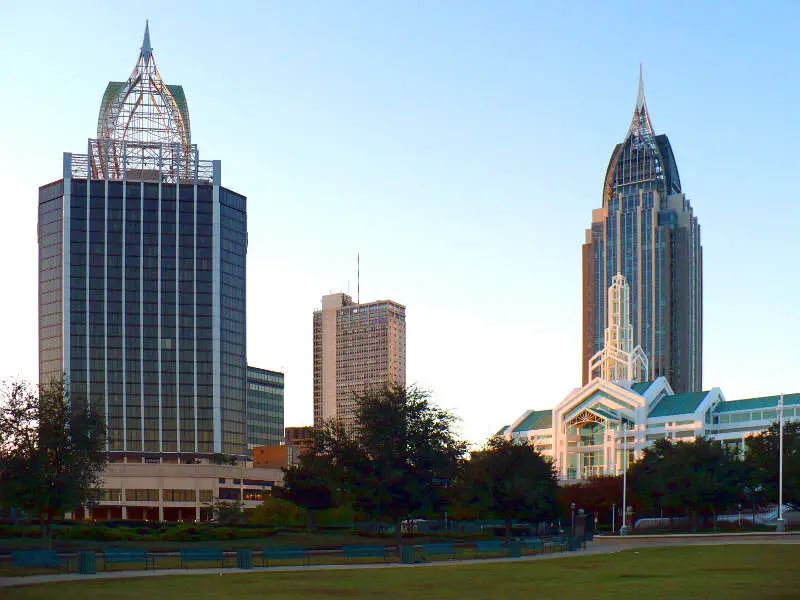
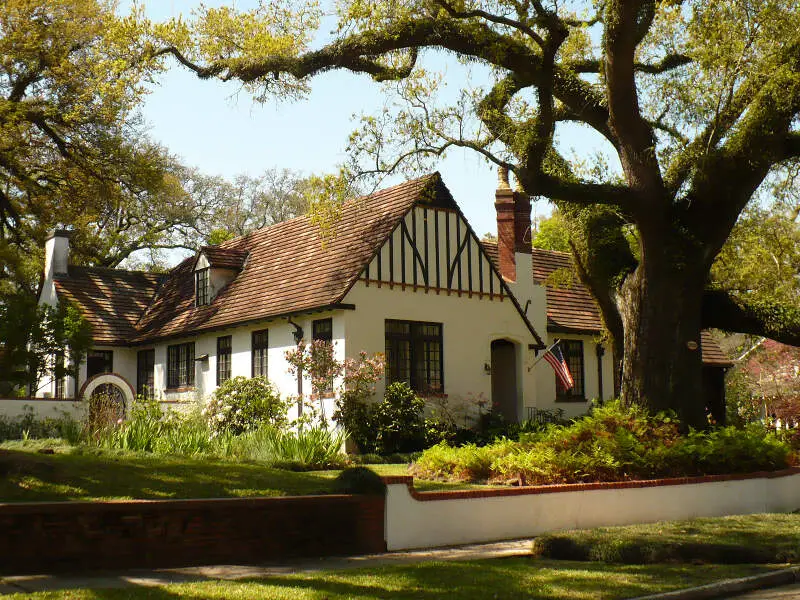
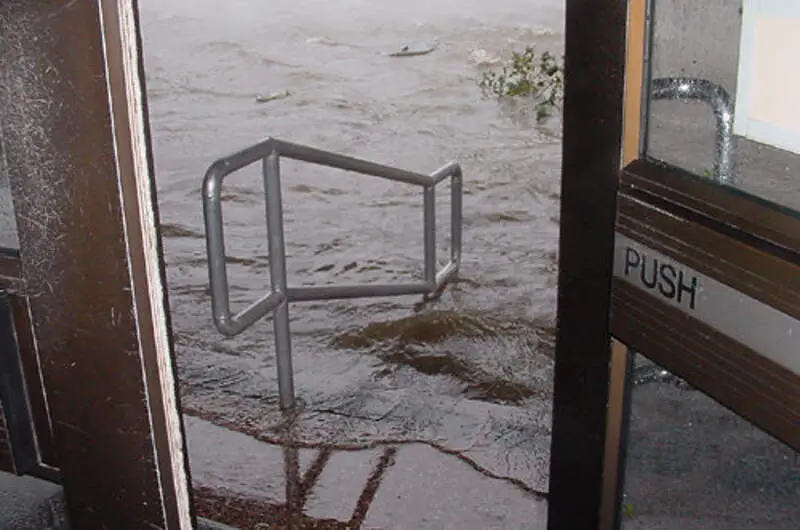
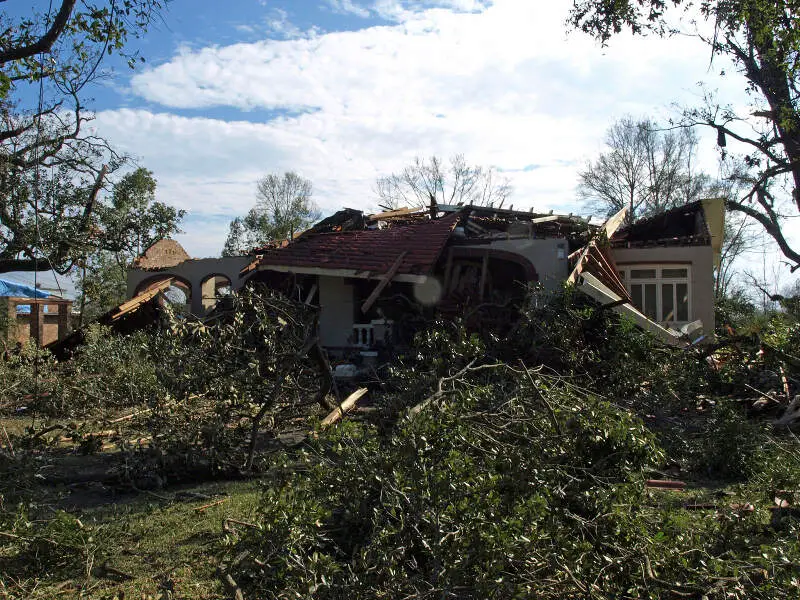
Mobile, AL Photos


11 Reviews & Comments About Mobile
/5

HomeSnacks User - 2018-07-13 17:48:25.154547
Great Place. I couldn't be more satisfied. Can't wait to go back
The people. Super friendly and amazing. I made friends and we are going out tonight
HomeSnacks User - 2018-07-14 01:37:11.490732
lots of criminals in mobile. i think it must have a high crime rate. this is a place i would not raise children in
the people are not all friendly there. i like a small town vibe and this town does not give that feeling. landscape is beautiful though
HomeSnacks User - 2018-08-03 12:54:08.084071
I live in mobile and it's a very nice place full of great and friendly people very good for retirement
My favorite place here is cooper riverside park it has great fishing
HomeSnacks User - 2018-08-27 18:39:15.932350
This place is really scary and racist and I don't like those kinds of middle of the know where places.
It is racist and not good
HomeSnacks User - 2018-08-27 19:15:16.796984
It is a racist place and it is scary
I don't like how racist they are
HomeSnacks User - 2018-09-06 00:41:51.574106
The crime is very bad and it's a joke place to live
I don't like anything about Alabama it is a ugly place to live and it's in the middle of no where
HomeSnacks User - 2018-09-19 01:19:32.059496
Mobile is a great city it has nice parks and great people traffic is okay at times.
The food was great and the people was nice lots of stores not bad on traffic
HomeSnacks User - 2018-09-19 01:44:55.798847
They are very weird people and they are rude and very racist.
No favorite places for me it's a terrible place to go or visit
HomeSnacks User - 2019-03-30 03:00:06.399630
Lots of crime but do you blame Mobile or Prichard- No its not dangerous living here. I mean i dont feel unsafe. But their is a lot of crime. This city just does not have anything to offer. They might if they new how to run their city parks and city in general.
When my family comes to town to visit 1st thing i do is take them accross the bay to nicer prettier towns you want to walk around in
HomeSnacks User - 2019-04-15 23:58:33.582797
The truth remains, if like very close minded, seriously rude and unfriendly people, all you have to do is come to Mobile, Alabama. If you don't figure it out at first, you will once the scheming, plotting and gossip behind your back starts. SO many gun toting red necks, you'll literally think you're being punished for mistakes in a previous life. And nosy, they'll know more about what you have in your own pockets and inside your house and car than you will! Just get ready to fight a lot and have some shoot outs with really, really stupid and uneducated, hate filled people. Forget about finding a decent single girl too, those kind marry straight out of high school and the parents don't approve outsiders. If you look different, think different, dress different, have a different accent other than hillbilly, or especially if you believe independently, they will not welcome you and try everything they can to make your life so miserable that you simply give up trying and leave. The beaches would be nice if you don't mind siting in 5 HOURS of traffic just to get there one way! Only to find the same exact welcome waiting for you there as well. Then there's the racist black folks. And then there's the white trailer trash. Most of the women are nasty and extremely unattractive. Healthy people aren't a concern either, you'll be hard pressed to find healthy eateries and bottled water, but fried foods and beer is everything to them! And "going mudding". Oh, and they will murder their own relatives over a dumb college football argument for which is the most important thing in their entire lives. It's so boring and awful. Oh, by the way, this isn't merely for Mobile, but for the ENTIRE state of Alabama. I lived there for 20 years before I finally gave up trying to make that place my home. Imagine h**l on earth and there you have it. The ONLY good places to live in America actually, are IF YOU ARE SERIOUSLY RICH. That's what it boils down to anymore. Just money. That's all this place has left, and without an enormous absurd amount of money, your entire life is going to s**k really, really bad. And it's only going to get worse and worse and far more worse than that. I know you don't want to hear it, but by all means, you may go find out for yourself.
The truth remains, if like very close minded, seriously rude and unfriendly people, all you have to do is come to Mobile, Alabama. If you don't figure it out at first, you will once the scheming, plotting and gossip behind your back starts. SO many gun toting red necks, you'll literally think you're being punished for mistakes in a previous life. And nosy, they'll know more about what you have in your own pockets and inside your house and car than you will! Just get ready to fight a lot and have some shoot outs with really, really stupid and uneducated, hate filled people. Forget about finding a decent single girl too, those kind marry straight out of high school and the parents don't approve outsiders. If you look different, think different, dress different, have a different accent other than hillbilly, or especially if you believe independently, they will not welcome you and try everything they can to make your life so miserable that you simply give up trying and leave. The beaches would be nice if you don't mind siting in 5 HOURS of traffic just to get there one way! Only to find the same exact welcome waiting for you there as well. Then there's the racist black folks. And then there's the white trailer trash. Most of the women are nasty and extremely unattractive. Healthy people aren't a concern either, you'll be hard pressed to find healthy eateries and bottled water, but fried foods and beer is everything to them! And "going mudding". Oh, and they will murder their own relatives over a dumb college football argument for which is the most important thing in their entire lives. It's so boring and awful. Oh, by the way, this isn't merely for Mobile, but for the ENTIRE state of Alabama. I lived there for 20 years before I finally gave up trying to make that place my home. Imagine h**l on earth and there you have it. The ONLY good places to live in America actually, are IF YOU ARE SERIOUSLY RICH. That's what it boils down to anymore. Just money. That's all this place has left, and without an enormous absurd amount of money, your entire life is going to s**k really, really bad. And it's only going to get worse and worse and far more worse than that.
HomeSnacks User - 2019-04-16 22:46:17.010743
Charming, historic, polite, reasonably safe, great cultural heritage, fantastic food. My new home! Fell in love on a weeklong business visit and moved here.
Good: weather, light traffic even at 'rush hour', cost of living is almost too low.
Bad: Property crime. Lock stuff up! I blame it on French heritage.
Mobile Articles

Rankings for Mobile in Alabama


Locations Around Mobile
Map Of Mobile, AL
Best Places Around Mobile
Prichard, AL
Population 19,121
Tillmans Corner, AL
Population 17,678
Saraland, AL
Population 16,304
Daphne, AL
Population 28,673
Fairhope, AL
Population 23,360
Mobile Demographics And Statistics
Population over time in Mobile
The current population in Mobile is 185,097. The population has decreased -5.4% from 2010.
| Year | Population | % Change |
|---|---|---|
| 2023 | 185,097 | -0.7% |
| 2022 | 186,316 | -0.6% |
| 2021 | 187,445 | -1.3% |
| 2020 | 189,994 | -0.2% |
| 2019 | 190,432 | -0.5% |
| 2018 | 191,485 | -0.3% |
| 2017 | 192,085 | -0.8% |
| 2016 | 193,717 | -0.5% |
| 2015 | 194,669 | -0.1% |
| 2014 | 194,942 | -0.1% |
| 2013 | 195,116 | -0.1% |
| 2012 | 195,239 | -0.1% |
| 2011 | 195,457 | -0.1% |
| 2010 | 195,619 | - |
Race / Ethnicity in Mobile
Mobile is:
39.2% White with 72,599 White residents.
52.7% African American with 97,626 African American residents.
0.2% American Indian with 291 American Indian residents.
2.1% Asian with 3,966 Asian residents.
0.1% Hawaiian with 107 Hawaiian residents.
0.2% Other with 420 Other residents.
2.3% Two Or More with 4,272 Two Or More residents.
3.1% Hispanic with 5,816 Hispanic residents.
| Race | Mobile | AL | USA |
|---|---|---|---|
| White | 39.2% | 63.8% | 58.2% |
| African American | 52.7% | 25.9% | 12.0% |
| American Indian | 0.2% | 0.3% | 0.5% |
| Asian | 2.1% | 1.4% | 5.7% |
| Hawaiian | 0.1% | 0.0% | 0.2% |
| Other | 0.2% | 0.3% | 0.5% |
| Two Or More | 2.3% | 2.9% | 3.9% |
| Hispanic | 3.1% | 5.4% | 19.0% |
Gender in Mobile
Mobile is 53.3% female with 98,664 female residents.
Mobile is 46.7% male with 86,433 male residents.
| Gender | Mobile | AL | USA |
|---|---|---|---|
| Female | 53.3% | 51.5% | 50.5% |
| Male | 46.7% | 48.5% | 49.5% |
Highest level of educational attainment in Mobile for adults over 25
3.0% of adults in Mobile completed < 9th grade.
7.0% of adults in Mobile completed 9-12th grade.
30.0% of adults in Mobile completed high school / ged.
21.0% of adults in Mobile completed some college.
8.0% of adults in Mobile completed associate's degree.
20.0% of adults in Mobile completed bachelor's degree.
8.0% of adults in Mobile completed master's degree.
2.0% of adults in Mobile completed professional degree.
1.0% of adults in Mobile completed doctorate degree.
| Education | Mobile | AL | USA |
|---|---|---|---|
| < 9th Grade | 3.0% | 4.0% | 5.0% |
| 9-12th Grade | 7.0% | 8.0% | 6.0% |
| High School / GED | 30.0% | 30.0% | 26.0% |
| Some College | 21.0% | 21.0% | 19.0% |
| Associate's Degree | 8.0% | 9.0% | 9.0% |
| Bachelor's Degree | 20.0% | 17.0% | 21.0% |
| Master's Degree | 8.0% | 8.0% | 10.0% |
| Professional Degree | 2.0% | 2.0% | 2.0% |
| Doctorate Degree | 1.0% | 1.0% | 2.0% |
Household Income For Mobile, Alabama
7.9% of households in Mobile earn Less than $10,000.
5.8% of households in Mobile earn $10,000 to $14,999.
11.1% of households in Mobile earn $15,000 to $24,999.
10.1% of households in Mobile earn $25,000 to $34,999.
14.4% of households in Mobile earn $35,000 to $49,999.
16.8% of households in Mobile earn $50,000 to $74,999.
11.2% of households in Mobile earn $75,000 to $99,999.
11.9% of households in Mobile earn $100,000 to $149,999.
5.2% of households in Mobile earn $150,000 to $199,999.
5.6% of households in Mobile earn $200,000 or more.
| Income | Mobile | AL | USA |
|---|---|---|---|
| Less than $10,000 | 7.9% | 6.3% | 4.9% |
| $10,000 to $14,999 | 5.8% | 5.0% | 3.6% |
| $15,000 to $24,999 | 11.1% | 9.2% | 6.6% |
| $25,000 to $34,999 | 10.1% | 8.7% | 6.8% |
| $35,000 to $49,999 | 14.4% | 12.2% | 10.4% |
| $50,000 to $74,999 | 16.8% | 16.8% | 15.7% |
| $75,000 to $99,999 | 11.2% | 12.5% | 12.7% |
| $100,000 to $149,999 | 11.9% | 15.2% | 17.4% |
| $150,000 to $199,999 | 5.2% | 7.1% | 9.3% |
| $200,000 or more | 5.6% | 7.2% | 12.6% |


