We all love the biggest cities that the Heart of Dixie has to offer. You know the places like Huntsville and Mobile which make all the headlines.
But there are a bunch of other great large cities in Alabama that don't get as much love.
We're going to change that right now.
Using the most recent Census data, we can tell you about all the places in Alabama with a focus on the biggest. We update the data each year and this is our fourth time doing this.
The Largest Cities In Alabama For 2026:
You can click here to see a full table of the 100 biggest cities in Alabama, along with every other place over 1,000 people big. It is sortable by clicking on the headers.
Read on below to see more on the biggest cities. Or for more reading on places to live in Alabama, check out:
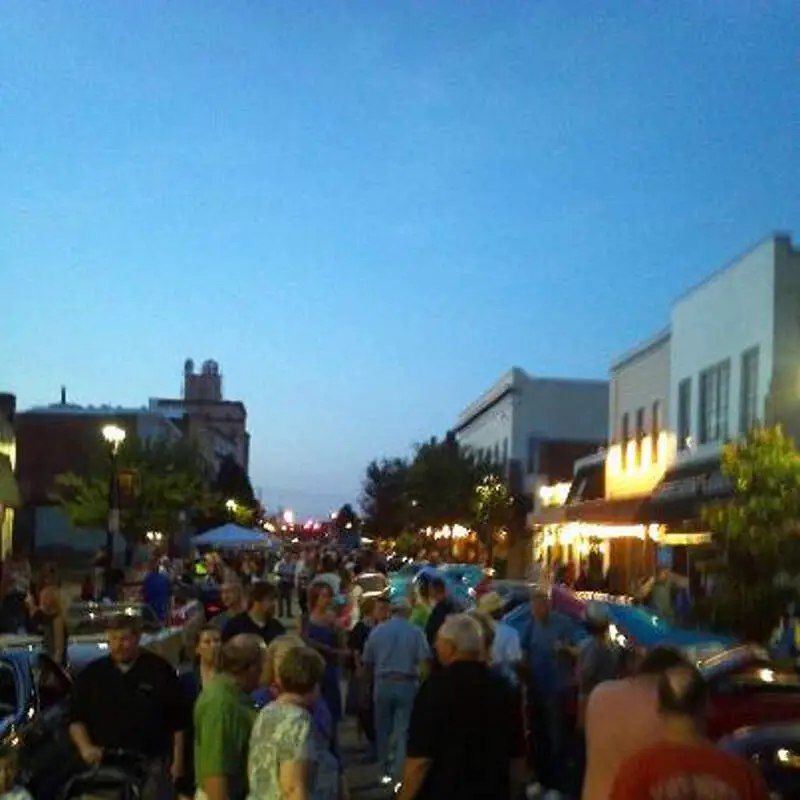
The 10 Biggest Cities In Alabama

/10
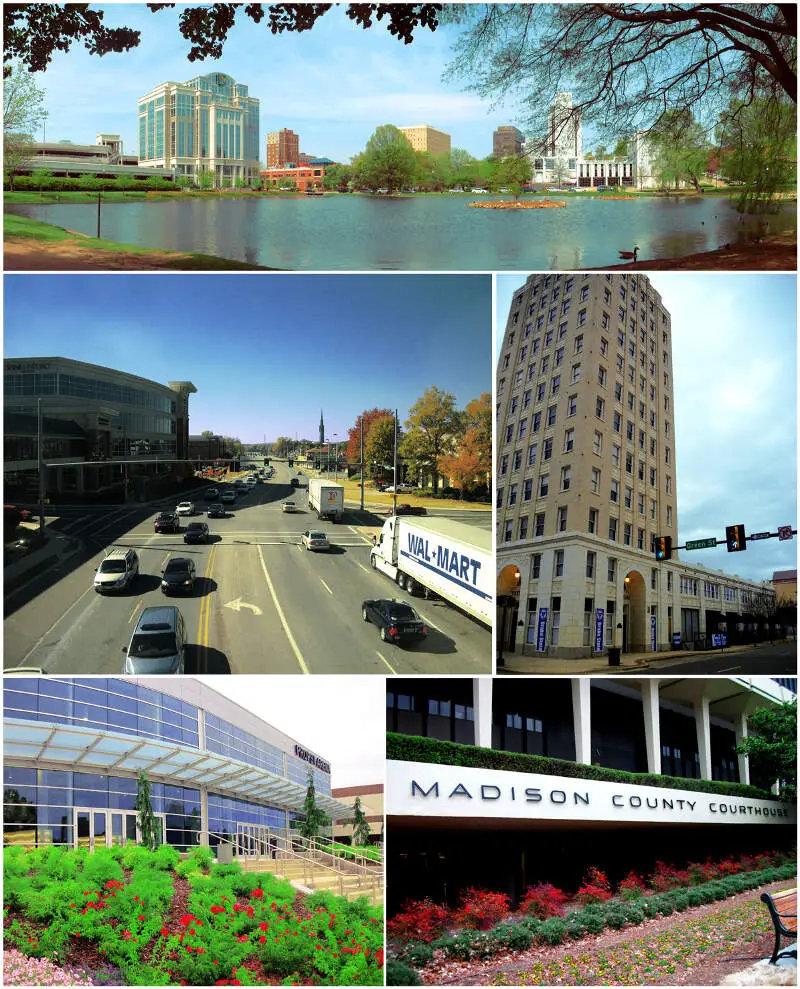
Rank Last Year: 1 (No Change)
Population: 222,791.0
Population 2010: 175,416
Growth: 27.0%
More on Huntsville: Data | Cost Of Living | Real Estate

/10
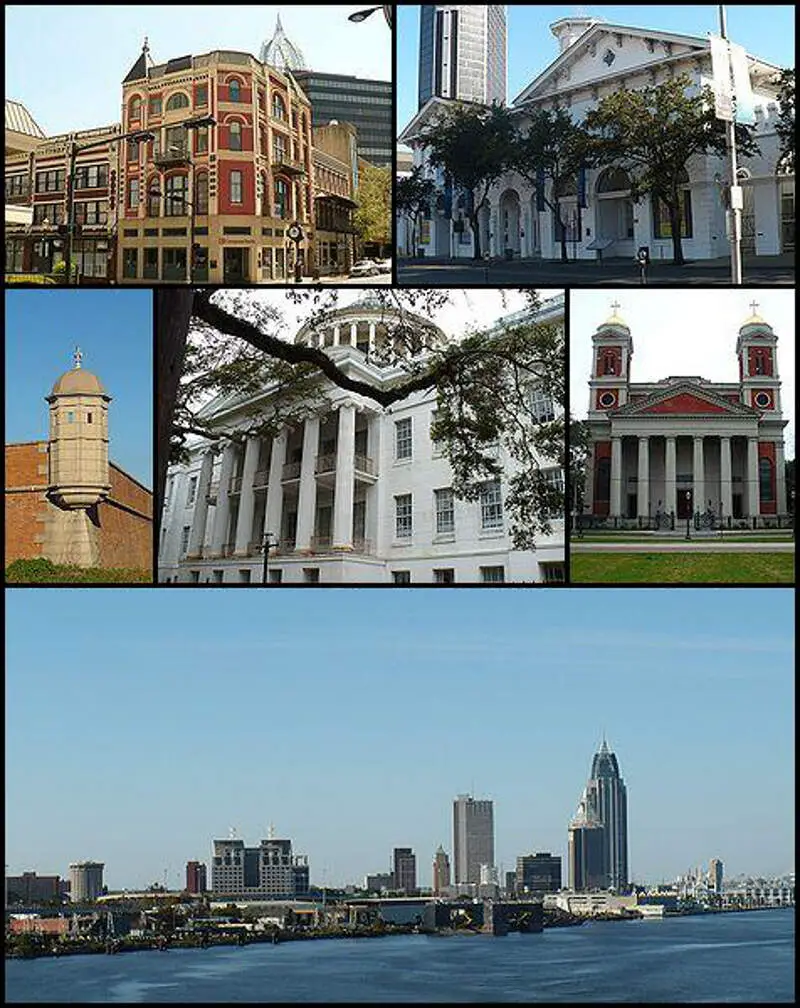
Rank Last Year: 4 (Up 2)
Population: 203,416.0
Population 2010: 195,619
Growth: 4.0%
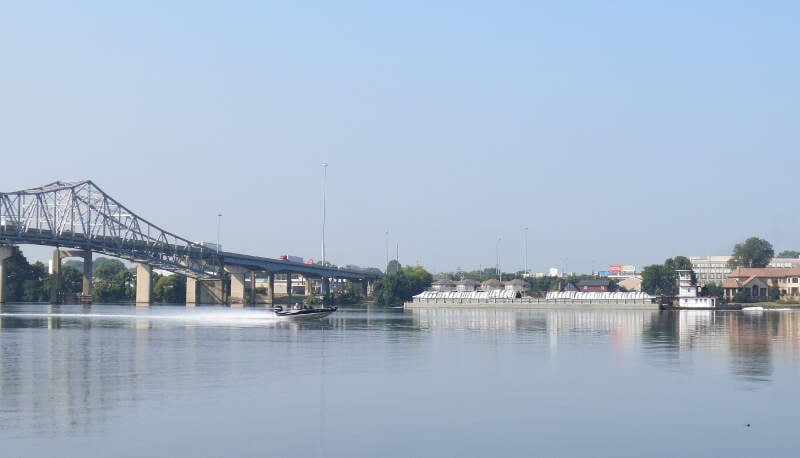
More on Mobile: Data | Crime | Cost Of Living | Real Estate

/10
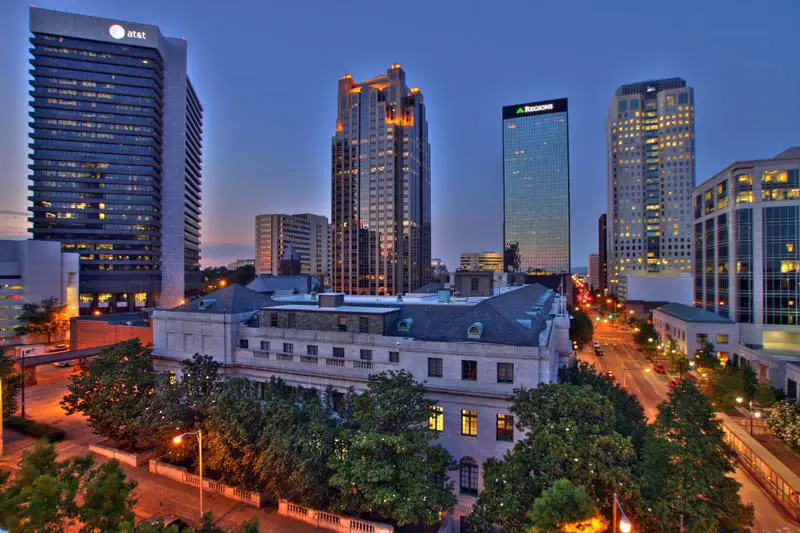
Rank Last Year: 2 (Down 1)
Population: 198,173.0
Population 2010: 216,392
Growth: -8.4%
More on Birmingham: Data | Cost Of Living | Real Estate


/10
Rank Last Year: 3 (Down 1)
Population: 197,494.0
Population 2010: 204,788
Growth: -3.6%
More on Montgomery: Data | Cost Of Living | Real Estate


/10
Rank Last Year: 5 (No Change)
Population: 111,038.0
Population 2010: 87,663
Growth: 26.7%
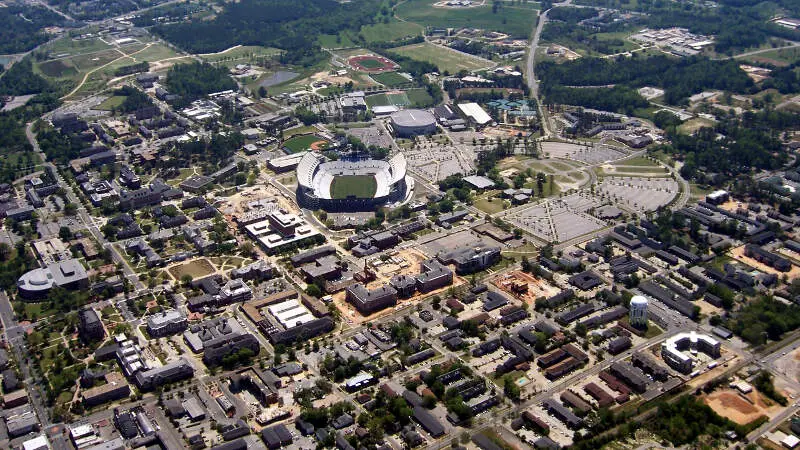
More on Tuscaloosa: Data | Cost Of Living | Real Estate

/10
Rank Last Year: 6 (No Change)
Population: 92,642.0
Population 2010: 78,543
Growth: 18.0%
More on Hoover: Data | Crime | Cost Of Living | Real Estate

/10
Rank Last Year: 7 (No Change)
Population: 80,594.0
Population 2010: 51,057
Growth: 57.9%
More on Auburn: Data | Crime | Cost Of Living | Real Estate

/10
Rank Last Year: 8 (No Change)
Population: 71,514.0
Population 2010: 64,299
Growth: 11.2%
More on Dothan: Data | Crime | Cost Of Living | Real Estate

/10
Rank Last Year: 9 (No Change)
Population: 60,106.0
Population 2010: 40,293
Growth: 49.2%
More on Madison: Data | Cost Of Living | Real Estate

/10
Rank Last Year: 10 (No Change)
Population: 57,361.0
Population 2010: 55,253
Growth: 3.8%
More on Decatur: Data | Cost Of Living | Real Estate
How We Determined The Largest Cities In Alabama
We've been ranking and dissecting cities in the Heart of Dixie for over 4 years now -- making this actually the fourth time we've run the numbers. We always use the best data, the US Census. In this case, that means we are using the American Community Survey.
It what is probably the most simple analysis we run each year, we ranked every place in Alabama from biggest to smallest. The biggest city this year? That would be Huntsville.
The smallest? Geraldine, although there are places smaller than 1,000 people not listed here, so keep that in mind as we take a look at the top ten.
Now on to numbers 11-100 Biggest in Alabama
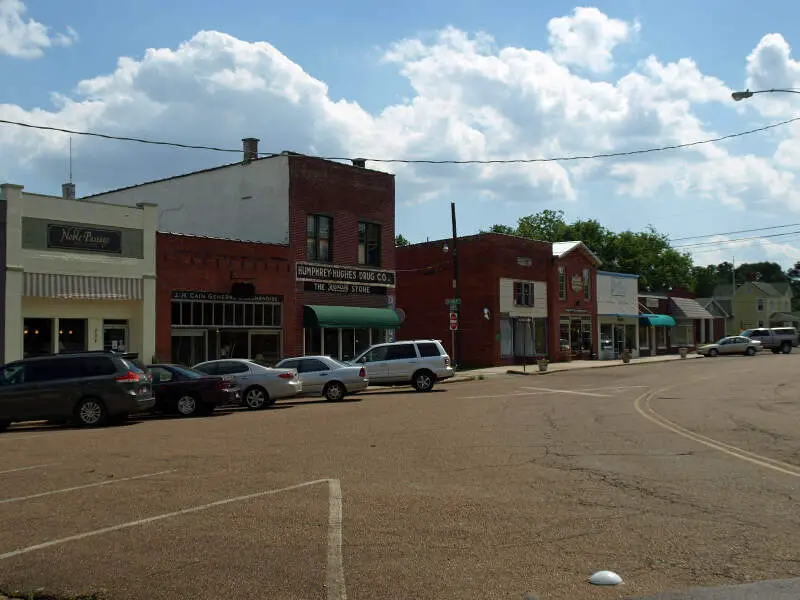
We hope that you find the big city, or really any city, that's right for you. Below is a list of the rest of the biggest cities along with every other place in Alabama.
Have fun snacking around in the Heart of Dixie!
For more reading on Alabama, check out:
- Best Places To Raise A Family In Alabama
- Best Places To Retire In Alabama
- Richest Cities In Alabama
- Safest Places In Alabama
- Worst Places To Live In Alabama
- Most Expensive Places To Live In Alabama
Detailed List Of The Biggest Cities In Alabama
| Rank | City | Current Population | 2010 | Growth |
|---|---|---|---|---|
| 1 | Huntsville | 222,791.0 | 175,416 | 27.0% |
| 2 | Mobile | 203,416.0 | 195,619 | 4.0% |
| 3 | Birmingham | 198,173.0 | 216,392 | -8.4% |
| 4 | Montgomery | 197,494.0 | 204,788 | -3.6% |
| 5 | Tuscaloosa | 111,038.0 | 87,663 | 26.7% |
| 6 | Hoover | 92,642.0 | 78,543 | 18.0% |
| 7 | Auburn | 80,594.0 | 51,057 | 57.9% |
| 8 | Dothan | 71,514.0 | 64,299 | 11.2% |
| 9 | Madison | 60,106.0 | 40,293 | 49.2% |
| 10 | Decatur | 57,361.0 | 55,253 | 3.8% |
| 11 | Florence | 41,701.0 | 38,821 | 7.4% |
| 12 | Prattville | 39,482.0 | 32,122 | 22.9% |
| 13 | Vestavia Hills | 38,616.0 | 33,305 | 15.9% |
| 14 | Phenix City | 38,499.0 | 31,704 | 21.4% |
| 15 | Alabaster | 33,917.0 | 29,550 | 14.8% |
| 16 | Gadsden | 33,374.0 | 37,162 | -10.2% |
| 17 | Opelika | 32,820.0 | 25,867 | 26.9% |
| 18 | Northport | 31,218.0 | 22,540 | 38.5% |
| 19 | Enterprise | 29,505.0 | 25,285 | 16.7% |
| 20 | Daphne | 29,453.0 | 20,817 | 41.5% |
| 21 | Athens | 29,002.0 | 21,059 | 37.7% |
| 22 | Homewood | 27,829.0 | 25,078 | 11.0% |
| 23 | Trussville | 26,673.0 | 18,609 | 43.3% |
| 24 | Bessemer | 25,400.0 | 27,824 | -8.7% |
| 25 | Pelham | 24,827.0 | 20,346 | 22.0% |
| 26 | Fairhope | 24,190.0 | 14,927 | 62.1% |
| 27 | Foley | 24,026.0 | 13,570 | 77.1% |
| 28 | Albertville | 22,813.0 | 20,445 | 11.6% |
| 29 | Oxford | 22,063.0 | 20,967 | 5.2% |
| 30 | Mountain Brook | 22,029.0 | 20,381 | 8.1% |
| 31 | Helena | 21,769.0 | 15,463 | 40.8% |
| 32 | Anniston | 21,271.0 | 23,297 | -8.7% |
| 33 | Cullman | 19,319.0 | 14,685 | 31.6% |
| 34 | Prichard | 18,961.0 | 23,599 | -19.7% |
| 35 | Troy | 17,716.0 | 17,207 | 3.0% |
| 36 | Calera | 17,714.0 | 10,374 | 70.8% |
| 37 | Tillmans Corner | 17,677.0 | 16,454 | 7.4% |
| 38 | Millbrook | 17,189.0 | 14,034 | 22.5% |
| 39 | Selma | 17,057.0 | 20,591 | -17.2% |
| 40 | Muscle Shoals | 16,951.0 | 12,986 | 30.5% |
| 41 | Gardendale | 16,534.0 | 13,420 | 23.2% |
| 42 | Hueytown | 16,414.0 | 16,032 | 2.4% |
| 43 | Saraland | 16,404.0 | 13,172 | 24.5% |
| 44 | Gulf Shores | 16,401.0 | 9,035 | 81.5% |
| 45 | Chelsea | 16,260.0 | 9,202 | 76.7% |
| 46 | Center Point | 15,914.0 | 16,810 | -5.3% |
| 47 | Hartselle | 15,847.0 | 13,840 | 14.5% |
| 48 | Scottsboro | 15,712.0 | 14,795 | 6.2% |
| 49 | Fort Payne | 14,927.0 | 13,862 | 7.7% |
| 50 | Talladega | 14,760.0 | 15,993 | -7.7% |
| 51 | Alexander City | 14,606.0 | 14,879 | -1.8% |
| 52 | Jasper | 14,442.0 | 14,307 | 0.9% |
| 53 | Jacksonville | 14,437.0 | 11,791 | 22.4% |
| 54 | Ozark | 14,327.0 | 14,909 | -3.9% |
| 55 | Pell City | 13,587.0 | 12,234 | 11.1% |
| 56 | Moody | 13,488.0 | 11,138 | 21.1% |
| 57 | Irondale | 13,464.0 | 12,180 | 10.5% |
| 58 | Eufaula | 12,584.0 | 13,228 | -4.9% |
| 59 | Sylacauga | 12,309.0 | 12,789 | -3.8% |
| 60 | Leeds | 12,028.0 | 11,314 | 6.3% |
| 61 | Meridianville | 11,150.0 | 5,893 | 89.2% |
| 62 | Boaz | 10,814.0 | 9,148 | 18.2% |
| 63 | Russellville | 10,799.0 | 9,598 | 12.5% |
| 64 | Saks | 10,681.0 | 11,169 | -4.4% |
| 65 | Spanish Fort | 10,662.0 | 6,624 | 61.0% |
| 66 | Rainbow City | 10,284.0 | 9,396 | 9.5% |
| 67 | Valley | 10,277.0 | 9,527 | 7.9% |
| 68 | Clay | 10,273.0 | 9,527 | 7.8% |
| 69 | Forestdale | 9,742.0 | 10,811 | -9.9% |
| 70 | Fairfield | 9,728.0 | 11,284 | -13.8% |
| 71 | Southside | 9,483.0 | 8,340 | 13.7% |
| 72 | Pleasant Grove | 9,442.0 | 10,048 | -6.0% |
| 73 | Fultondale | 9,384.0 | 8,093 | 16.0% |
| 74 | Sheffield | 9,340.0 | 9,141 | 2.2% |
| 75 | Meadowbrook | 9,117.0 | 8,772 | 3.9% |
| 76 | Tuscumbia | 9,115.0 | 8,315 | 9.6% |
| 77 | Clanton | 8,958.0 | 8,554 | 4.7% |
| 78 | Tuskegee | 8,938.0 | 10,189 | -12.3% |
| 79 | Guntersville | 8,916.0 | 8,077 | 10.4% |
| 80 | Andalusia | 8,766.0 | 8,998 | -2.6% |
| 81 | Arab | 8,679.0 | 7,928 | 9.5% |
| 82 | Orange Beach | 8,407.0 | 5,185 | 62.1% |
| 83 | Atmore | 8,334.0 | 10,008 | -16.7% |
| 84 | Bay Minette | 8,295.0 | 8,052 | 3.0% |
| 85 | Brook Highland | 8,146.0 | 6,549 | 24.4% |
| 86 | Pinson | 7,832.0 | 7,143 | 9.6% |
| 87 | Montevallo | 7,556.0 | 6,101 | 23.8% |
| 88 | Wetumpka | 7,437.0 | 6,480 | 14.8% |
| 89 | Lincoln | 7,305.0 | 6,065 | 20.4% |
| 90 | Robertsdale | 7,194.0 | 5,052 | 42.4% |
| 91 | Greenville | 7,163.0 | 7,924 | -9.6% |
| 92 | Oneonta | 6,971.0 | 6,453 | 8.0% |
| 93 | Hamilton | 6,922.0 | 6,868 | 0.8% |
| 94 | Demopolis | 6,908.0 | 7,570 | -8.7% |
| 95 | Satsuma | 6,822.0 | 6,057 | 12.6% |
| 96 | Lanett | 6,814.0 | 6,722 | 1.4% |
| 97 | Opp | 6,709.0 | 6,701 | 0.1% |
| 98 | Moores Mill | 6,378.0 | 5,207 | 22.5% |
| 99 | Chickasaw | 6,332.0 | 6,128 | 3.3% |
| 100 | Grayson Valley | 6,077.0 | 5,121 | 18.7% |
| 101 | Harvest | 5,955.0 | 4,415 | 34.9% |
| 102 | Tarrant | 5,925.0 | 6,524 | -9.2% |
| 103 | Highland Lakes | 5,866.0 | 3,618 | 62.1% |
| 104 | Monroeville | 5,802.0 | 6,589 | -11.9% |
| 105 | Attalla | 5,775.0 | 6,143 | -6.0% |
| 106 | Rainsville | 5,702.0 | 4,895 | 16.5% |
| 107 | Semmes | 5,626.0 | 0 | nan% |
| 108 | Smiths Station | 5,496.0 | 5,001 | 9.9% |
| 109 | Glencoe | 5,353.0 | 5,107 | 4.8% |
| 110 | Roanoke | 5,336.0 | 6,154 | -13.3% |
| 111 | Headland | 5,217.0 | 4,407 | 18.4% |
| 112 | Brewton | 5,186.0 | 5,391 | -3.8% |
| 113 | Holtville | 5,158.0 | 4,394 | 17.4% |
| 114 | Tallassee | 5,134.0 | 4,683 | 9.6% |
| 115 | Springville | 5,081.0 | 3,872 | 31.2% |
| 116 | Midfield | 5,045.0 | 5,384 | -6.3% |
| 117 | Winfield | 4,999.0 | 4,857 | 2.9% |
| 118 | Redland | 4,982.0 | 3,638 | 36.9% |
| 119 | Theodore | 4,964.0 | 6,147 | -19.2% |
| 120 | Daleville | 4,919.0 | 5,157 | -4.6% |
| 121 | Piedmont | 4,740.0 | 4,915 | -3.6% |
| 122 | Columbiana | 4,725.0 | 4,016 | 17.7% |
| 123 | Fort Rucker | 4,705.0 | 4,886 | -3.7% |
| 124 | Livingston | 4,672.0 | 3,436 | 36.0% |
| 125 | Childersburg | 4,655.0 | 5,249 | -11.3% |
| 126 | Jackson | 4,589.0 | 5,279 | -13.1% |
| 127 | Hokes Bluff | 4,547.0 | 4,240 | 7.2% |
| 128 | Kimberly | 4,439.0 | 0 | nan% |
| 129 | Haleyville | 4,271.0 | 4,251 | 0.5% |
| 130 | Adamsville | 4,266.0 | 4,599 | -7.2% |
| 131 | Geneva | 4,225.0 | 4,466 | -5.4% |
| 132 | Pine Level | 4,170.0 | 3,282 | 27.1% |
| 133 | Fayette | 4,164.0 | 4,682 | -11.1% |
| 134 | Valley Grande | 4,047.0 | 4,011 | 0.9% |
| 135 | Brent | 4,010.0 | 4,732 | -15.3% |
| 136 | Hazel Green | 3,940.0 | 3,696 | 6.6% |
| 137 | Citronelle | 3,913.0 | 3,876 | 1.0% |
| 138 | Moundville | 3,754.0 | 2,176 | 72.5% |
| 139 | Centre | 3,700.0 | 3,477 | 6.4% |
| 140 | Holt | 3,629.0 | 3,991 | -9.1% |
| 141 | Thomasville | 3,619.0 | 4,293 | -15.7% |
| 142 | Grand Bay | 3,553.0 | 3,764 | -5.6% |
| 143 | Emerald Mountain | 3,535.0 | 2,270 | 55.7% |
| 144 | Alexandria | 3,475.0 | 3,745 | -7.2% |
| 145 | Elba | 3,468.0 | 3,945 | -12.1% |
| 146 | Heflin | 3,467.0 | 3,449 | 0.5% |
| 147 | West End-Cobb Town | 3,453.0 | 3,899 | -11.4% |
| 148 | Evergreen | 3,404.0 | 3,917 | -13.1% |
| 149 | Moulton | 3,401.0 | 3,421 | -0.6% |
| 150 | Ladonia | 3,346.0 | 3,518 | -4.9% |
| 151 | Weaver | 3,324.0 | 2,962 | 12.2% |
| 152 | Hanceville | 3,270.0 | 2,995 | 9.2% |
| 153 | Union Springs | 3,248.0 | 4,100 | -20.8% |
| 154 | Warrior | 3,207.0 | 3,184 | 0.7% |
| 155 | Red Bay | 3,201.0 | 3,164 | 1.2% |
| 156 | East Brewton | 3,168.0 | 2,708 | 17.0% |
| 157 | Underwood-Petersville | 3,100.0 | 3,482 | -11.0% |
| 158 | Brighton | 3,079.0 | 3,063 | 0.5% |
| 159 | Dadeville | 2,993.0 | 3,217 | -7.0% |
| 160 | New Hope | 2,911.0 | 2,755 | 5.7% |
| 161 | Marion | 2,886.0 | 3,592 | -19.7% |
| 162 | Jemison | 2,796.0 | 2,587 | 8.1% |
| 163 | Abbeville | 2,748.0 | 2,740 | 0.3% |
| 164 | Centreville | 2,741.0 | 2,747 | -0.2% |
| 165 | Brookwood | 2,706.0 | 2,330 | 16.1% |
| 166 | Hartford | 2,701.0 | 2,581 | 4.6% |
| 167 | Luverne | 2,694.0 | 2,807 | -4.0% |
| 168 | Dora | 2,668.0 | 1,981 | 34.7% |
| 169 | La Fayette | 2,633.0 | 3,037 | -13.3% |
| 170 | Cottondale | 2,632.0 | 0 | nan% |
| 171 | Choccolocco | 2,620.0 | 3,252 | -19.4% |
| 172 | Huguley | 2,577.0 | 3,086 | -16.5% |
| 173 | Lineville | 2,546.0 | 2,477 | 2.8% |
| 174 | Indian Springs Village | 2,537.0 | 2,476 | 2.5% |
| 175 | Graysville | 2,509.0 | 2,370 | 5.9% |
| 176 | Henagar | 2,501.0 | 2,511 | -0.4% |
| 177 | Ashville | 2,464.0 | 2,053 | 20.0% |
| 178 | Sumiton | 2,459.0 | 2,531 | -2.8% |
| 179 | Brundidge | 2,392.0 | 2,456 | -2.6% |
| 180 | Butler | 2,386.0 | 1,796 | 32.9% |
| 181 | Guin | 2,381.0 | 2,381 | 0.0% |
| 182 | Grove Hill | 2,341.0 | 1,415 | 65.4% |
| 183 | Westover | 2,298.0 | 822 | 179.6% |
| 184 | Elberta | 2,293.0 | 1,676 | 36.8% |
| 185 | Bridgeport | 2,246.0 | 2,344 | -4.2% |
| 186 | Lipscomb | 2,214.0 | 1,860 | 19.0% |
| 187 | Aliceville | 2,211.0 | 3,101 | -28.7% |
| 188 | Cowarts | 2,204.0 | 1,832 | 20.3% |
| 189 | Selmont-West Selmont | 2,150.0 | 3,316 | -35.2% |
| 190 | Crossville | 2,143.0 | 1,770 | 21.1% |
| 191 | Greensboro | 2,135.0 | 2,629 | -18.8% |
| 192 | Deatsville | 2,097.0 | 829 | 153.0% |
| 193 | York | 2,056.0 | 2,583 | -20.4% |
| 194 | Vincent | 2,050.0 | 1,916 | 7.0% |
| 195 | Sardis City | 2,046.0 | 1,625 | 25.9% |
| 196 | Carlisle-Rockledge | 1,993.0 | 1,880 | 6.0% |
| 197 | Slocomb | 1,952.0 | 2,965 | -34.2% |
| 198 | Sylvania | 1,925.0 | 1,339 | 43.8% |
| 199 | Whitesboro | 1,918.0 | 2,281 | -15.9% |
| 200 | Malvern | 1,913.0 | 1,353 | 41.4% |
| 201 | Concord | 1,913.0 | 1,662 | 15.1% |
| 202 | Rehobeth | 1,887.0 | 1,506 | 25.3% |
| 203 | Bayou La Batre | 1,881.0 | 2,611 | -28.0% |
| 204 | Wilsonville | 1,879.0 | 1,867 | 0.6% |
| 205 | Dauphin Island | 1,852.0 | 1,375 | 34.7% |
| 206 | Florala | 1,822.0 | 2,820 | -35.4% |
| 207 | Camden | 1,803.0 | 2,224 | -18.9% |
| 208 | Ashland | 1,797.0 | 2,637 | -31.9% |
| 209 | Harpersville | 1,788.0 | 1,927 | -7.2% |
| 210 | Gordo | 1,723.0 | 1,820 | -5.3% |
| 211 | Hackleburg | 1,709.0 | 1,824 | -6.3% |
| 212 | Ragland | 1,682.0 | 2,192 | -23.3% |
| 213 | Level Plains | 1,667.0 | 1,672 | -0.3% |
| 214 | Blountsville | 1,648.0 | 1,584 | 4.0% |
| 215 | Coats Bend | 1,630.0 | 1,183 | 37.8% |
| 216 | Cedar Bluff | 1,629.0 | 1,873 | -13.0% |
| 217 | Stewartville | 1,629.0 | 2,067 | -21.2% |
| 218 | Falkville | 1,606.0 | 1,158 | 38.7% |
| 219 | Brookside | 1,603.0 | 1,140 | 40.6% |
| 220 | Reform | 1,597.0 | 1,997 | -20.0% |
| 221 | Summerdale | 1,593.0 | 698 | 128.2% |
| 222 | Georgiana | 1,578.0 | 1,624 | -2.8% |
| 223 | Marbury | 1,570.0 | 1,364 | 15.1% |
| 224 | Carbon Hill | 1,536.0 | 2,123 | -27.6% |
| 225 | Flomaton | 1,535.0 | 1,987 | -22.7% |
| 226 | Fort Deposit | 1,525.0 | 1,115 | 36.8% |
| 227 | Elmore | 1,517.0 | 1,059 | 43.2% |
| 228 | Point Clear | 1,511.0 | 1,766 | -14.4% |
| 229 | Munford | 1,508.0 | 1,621 | -7.0% |
| 230 | Sylvan Springs | 1,490.0 | 1,664 | -10.5% |
| 231 | Webb | 1,475.0 | 1,539 | -4.2% |
| 232 | Bear Creek | 1,474.0 | 1,123 | 31.3% |
| 233 | Smoke Rise | 1,471.0 | 2,348 | -37.4% |
| 234 | Goodwater | 1,445.0 | 1,517 | -4.7% |
| 235 | New Brockton | 1,430.0 | 1,450 | -1.4% |
| 236 | Clio | 1,422.0 | 2,343 | -39.3% |
| 237 | Frisco City | 1,416.0 | 1,516 | -6.6% |
| 238 | Millport | 1,412.0 | 858 | 64.6% |
| 239 | Locust Fork | 1,402.0 | 1,009 | 38.9% |
| 240 | Hayden | 1,389.0 | 553 | 151.2% |
| 241 | Ardmore | 1,384.0 | 1,167 | 18.6% |
| 242 | Mount Vernon | 1,339.0 | 1,381 | -3.0% |
| 243 | Grant | 1,336.0 | 883 | 51.3% |
| 244 | Susan Moore | 1,336.0 | 827 | 61.5% |
| 245 | Newton | 1,329.0 | 1,643 | -19.1% |
| 246 | Shoal Creek | 1,328.0 | 928 | 43.1% |
| 247 | New Market | 1,314.0 | 1,850 | -29.0% |
| 248 | Rogersville | 1,260.0 | 1,234 | 2.1% |
| 249 | Altoona | 1,252.0 | 737 | 69.9% |
| 250 | Snead | 1,247.0 | 1,204 | 3.6% |
| 251 | Camp Hill | 1,238.0 | 964 | 28.4% |
| 252 | Parrish | 1,222.0 | 874 | 39.8% |
| 253 | Woodstock | 1,218.0 | 1,724 | -29.4% |
| 254 | Maplesville | 1,200.0 | 794 | 51.1% |
| 255 | Tidmore Bend | 1,192.0 | 911 | 30.8% |
| 256 | Fyffe | 1,190.0 | 930 | 28.0% |
| 257 | Blue Ridge | 1,190.0 | 1,451 | -18.0% |
| 258 | Cleveland | 1,182.0 | 1,665 | -29.0% |
| 259 | Fayetteville | 1,154.0 | 1,059 | 9.0% |
| 260 | Killen | 1,150.0 | 1,384 | -16.9% |
| 261 | Steele | 1,149.0 | 1,059 | 8.5% |
| 262 | Ohatchee | 1,148.0 | 1,360 | -15.6% |
| 263 | Hobson City | 1,142.0 | 811 | 40.8% |
| 264 | Eclectic | 1,141.0 | 918 | 24.3% |
| 265 | Magnolia Springs | 1,130.0 | 684 | 65.2% |
| 266 | Skyline | 1,126.0 | 970 | 16.1% |
| 267 | Lookout Mountain | 1,120.0 | 1,604 | -30.2% |
| 268 | Cherokee | 1,120.0 | 1,406 | -20.3% |
| 269 | Douglas | 1,113.0 | 801 | 39.0% |
| 270 | Coosada | 1,105.0 | 1,342 | -17.7% |
| 271 | Rock Creek | 1,103.0 | 1,621 | -32.0% |
| 272 | Brilliant | 1,097.0 | 1,097 | 0.0% |
| 273 | Gallant | 1,081.0 | 1,238 | -12.7% |
| 274 | West Blocton | 1,077.0 | 1,629 | -33.9% |
| 275 | Leroy | 1,075.0 | 666 | 61.4% |
| 276 | Section | 1,069.0 | 905 | 18.1% |
| 277 | Double Springs | 1,068.0 | 1,961 | -45.5% |
| 278 | Coker | 1,058.0 | 1,194 | -11.4% |
| 279 | Notasulga | 1,050.0 | 985 | 6.6% |
| 280 | Berry | 1,040.0 | 1,126 | -7.6% |
| 281 | Baileyton | 1,039.0 | 543 | 91.3% |
| 282 | Geraldine | 1,011.0 | 722 | 40.0% |