Orange Beach SnackAbility
Overall SnackAbility
Crime in Orange Beach summary. We use data from the FBI to determine the crime rates in Orange Beach. Key points include:
There were 191 total crimes in Orange Beach in the last reporting year.
The overall crime rate per 100,000 people in Orange Beach is 2,202.2 / 100k people.
The violent crime rate per 100,000 people in Orange Beach is 357.4 / 100k people.
The property crime rate per 100,000 people in Orange Beach is 1,844.8 / 100k people.
Overall, crime in Orange Beach is 3.92% above the national average.
Total Crimes
Above National Average
Crime In Orange Beach Comparison Table
| Statistic | Count Raw |
Orange Beach / 100k People |
Alabama / 100k People |
National / 100k People |
|---|---|---|---|---|
| Total Crimes Per 100K | 191 | 2,202.2 | 1,924.9 | 2,119.2 |
| Violent Crime | 31 | 357.4 | 359.9 | 359.0 |
| Murder | 0 | 0.0 | 8.7 | 5.0 |
| Robbery | 0 | 0.0 | 34.0 | 61.0 |
| Aggravated Assault | 26 | 299.8 | 291.4 | 256.0 |
| Property Crime | 160 | 1,844.8 | 1,565.1 | 1,760.0 |
| Burglary | 10 | 115.3 | 243.5 | 229.0 |
| Larceny | 149 | 1,718.0 | 1,148.5 | 1,272.0 |
| Car Theft | 1 | 11.5 | 173.0 | 259.0 |
Source: FBI Uniform Crime Reporting (2024)
Cost of living in Orange Beach summary. We use data on the cost of living to determine how expensive it is to live in Orange Beach. Real estate prices drive most of the variance in cost of living around Alabama. Key points include:
The cost of living in Orange Beach is 124 with 100 being average.
The cost of living in Orange Beach is 1.2x higher than the national average.
The median home value in Orange Beach is $678,808.
The median income in Orange Beach is $97,736.
Orange Beach's Overall Cost Of Living
Higher Than The National Average
Cost Of Living In Orange Beach Comparison Table
| Living Expense | Orange Beach | Alabama | National Average |
|---|---|---|---|
| Overall | 124 | 91 | 100 |
| Services | 101 | 95 | 100 |
| Groceries | 107 | 96 | 100 |
| Health | 165 | 74 | 100 |
| Housing | 107 | 96 | 100 |
| Transportation | 112 | 95 | 100 |
| Utilities | 99 | 95 | 100 |
Source: Cost of living index, normalized to US average = 100
Orange Beach, AL Weather
The average high in Orange Beach is 76.9° and the average low is 56.9°.
There are 79.5 days of precipitation each year.
Expect an average of 66.1 inches of precipitation each year with 0.1 inches of snow.
| Stat | Orange Beach |
|---|---|
| Average Annual High | 76.9 |
| Average Annual Low | 56.9 |
| Annual Precipitation Days | 79.5 |
| Average Annual Precipitation | 66.1 |
| Average Annual Snowfall | 0.1 |
Average High
Days of Rain
Source: NOAA climate normals (30-year)
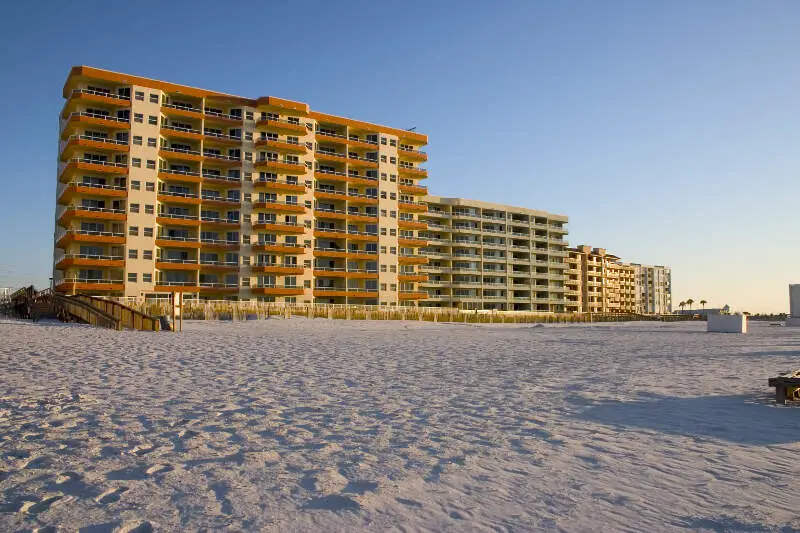
Orange Beach, AL Photos

1 Reviews & Comments About Orange Beach

Crime seems low, housing prices are high since it is a beach town, many good restaurants.
I love that there are so many good restaurants and many are not too expensive, considering that this is a beach town. There are a variety of places to stay right on the beach whether you prefer a hotel or a condo experience. There is also nearby shopping at an outlet mall. This is more of a beach town for the settled crowd rather than the younger group.
Rankings & Articles For Orange Beach


Locations Around Orange Beach
Map Of Orange Beach, AL
Best Places Around Orange Beach
Gonzalez, FL
Population 14,458
Pace, FL
Population 26,282
Navarre, FL
Population 39,838
Bellview, FL
Population 26,488
Pensacola, FL
Population 54,036
Myrtle Grove, FL
Population 15,595
Ferry Pass, FL
Population 30,053
Ensley, FL
Population 23,760
Prichard, AL
Population 18,961
Brent, FL
Population 23,813
Orange Beach Demographics And Statistics
Population over time in Orange Beach
The current population in Orange Beach is 8,407. The population has increased 62.1% from 2010.
| Year | Population | % Change |
|---|---|---|
| 2024 | 8,407 | 2.0% |
| 2023 | 8,244 | 2.4% |
| 2022 | 8,048 | 2.6% |
| 2021 | 7,847 | 28.0% |
| 2020 | 6,130 | 1.8% |
| 2019 | 6,019 | 1.6% |
| 2018 | 5,927 | 1.7% |
| 2017 | 5,826 | 0.6% |
| 2016 | 5,791 | 1.9% |
| 2015 | 5,682 | 0.9% |
| 2014 | 5,629 | 1.8% |
| 2013 | 5,528 | 1.9% |
| 2012 | 5,424 | 1.8% |
| 2011 | 5,328 | 2.8% |
| 2010 | 5,185 | - |
Race / Ethnicity in Orange Beach
See the full breakdown
Orange Beach is:
87.3% White with 7,341 White residents.
3.9% African American with 329 African American residents.
0.2% American Indian with 17 American Indian residents.
0.1% Asian with 11 Asian residents.
0.0% Hawaiian with 0 Hawaiian residents.
0.4% Other with 30 Other residents.
4.1% Two Or More with 342 Two Or More residents.
4.0% Hispanic with 337 Hispanic residents.
| Race | Orange Beach | AL | USA |
|---|---|---|---|
| White | 87.3% | 63.4% | 57.4% |
| African American | 3.9% | 25.6% | 11.9% |
| American Indian | 0.2% | 0.3% | 0.5% |
| Asian | 0.1% | 1.4% | 5.9% |
| Hawaiian | 0.0% | 0.0% | 0.2% |
| Other | 0.4% | 0.4% | 0.6% |
| Two Or More | 4.1% | 3.3% | 4.3% |
| Hispanic | 4.0% | 5.6% | 19.3% |
Gender in Orange Beach
See the full breakdown
Orange Beach is 52.3% female with 4,399 female residents.
Orange Beach is 47.7% male with 4,008 male residents.
| Gender | Orange Beach | AL | USA |
|---|---|---|---|
| Female | 52.3% | 51.4% | 50.5% |
| Male | 47.7% | 48.6% | 49.5% |
Highest level of educational attainment in Orange Beach for adults over 25
See the full breakdown
2.0% of adults in Orange Beach completed < 9th grade.
2.0% of adults in Orange Beach completed 9-12th grade.
23.0% of adults in Orange Beach completed high school / ged.
28.0% of adults in Orange Beach completed some college.
5.0% of adults in Orange Beach completed associate's degree.
24.0% of adults in Orange Beach completed bachelor's degree.
13.0% of adults in Orange Beach completed master's degree.
1.0% of adults in Orange Beach completed professional degree.
2.0% of adults in Orange Beach completed doctorate degree.
| Education | Orange Beach | AL | USA |
|---|---|---|---|
| < 9th Grade | 2.0% | 4.0% | 4.0% |
| 9-12th Grade | 2.0% | 8.0% | 6.0% |
| High School / GED | 23.0% | 30.0% | 26.0% |
| Some College | 28.0% | 21.0% | 19.0% |
| Associate's Degree | 5.0% | 9.0% | 9.0% |
| Bachelor's Degree | 24.0% | 17.0% | 22.0% |
| Master's Degree | 13.0% | 8.0% | 10.0% |
| Professional Degree | 1.0% | 2.0% | 2.0% |
| Doctorate Degree | 2.0% | 1.0% | 2.0% |
Household Income For Orange Beach, Alabama
See the full breakdown
2.7% of households in Orange Beach earn Less than $10,000.
0.0% of households in Orange Beach earn $10,000 to $14,999.
1.5% of households in Orange Beach earn $15,000 to $24,999.
7.0% of households in Orange Beach earn $25,000 to $34,999.
7.6% of households in Orange Beach earn $35,000 to $49,999.
15.9% of households in Orange Beach earn $50,000 to $74,999.
19.9% of households in Orange Beach earn $75,000 to $99,999.
20.7% of households in Orange Beach earn $100,000 to $149,999.
7.9% of households in Orange Beach earn $150,000 to $199,999.
16.9% of households in Orange Beach earn $200,000 or more.
| Income | Orange Beach | AL | USA |
|---|---|---|---|
| Less than $10,000 | 2.7% | 6.3% | 5.0% |
| $10,000 to $14,999 | 0.0% | 4.7% | 3.4% |
| $15,000 to $24,999 | 1.5% | 8.8% | 6.3% |
| $25,000 to $34,999 | 7.0% | 8.5% | 6.6% |
| $35,000 to $49,999 | 7.6% | 11.8% | 10.1% |
| $50,000 to $74,999 | 15.9% | 16.7% | 15.5% |
| $75,000 to $99,999 | 19.9% | 12.7% | 12.6% |
| $100,000 to $149,999 | 20.7% | 15.5% | 17.5% |
| $150,000 to $199,999 | 7.9% | 7.4% | 9.6% |
| $200,000 or more | 16.9% | 7.8% | 13.4% |
Source: U.S. Census ACS 5-year estimates (2024)


