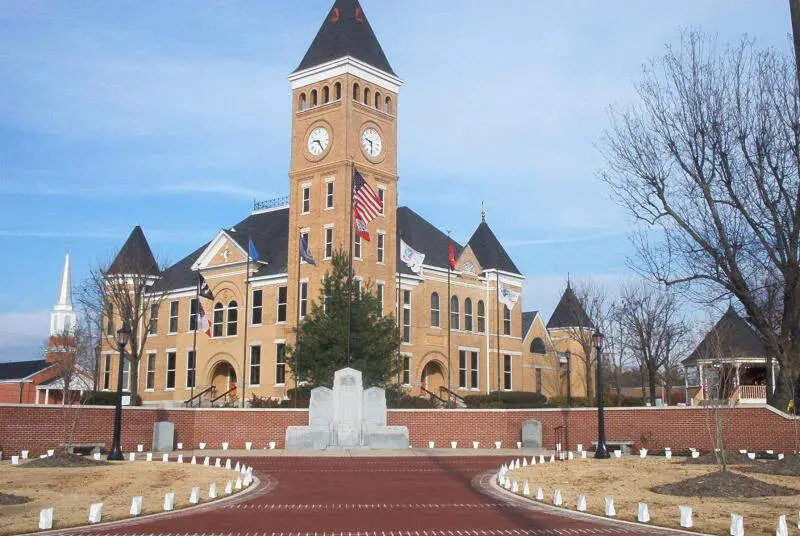
Benton, AR
Demographics And Statistics
Living In Benton, Arkansas Summary
Life in Benton research summary. HomeSnacks has been using Saturday Night Science to research the quality of life in Benton over the past nine years using Census, FBI, Zillow, and other primary data sources. Based on the most recently available data, we found the following about life in Benton:
The population in Benton is 35,954.
The median home value in Benton is $236,804.
The median income in Benton is $69,638.
The cost of living in Benton is 95 which is 0.9x lower than the national average.
The median rent in Benton is $1,003.
The unemployment rate in Benton is 4.4%.
The poverty rate in Benton is 10.1%.
The average high in Benton is 73.1° and the average low is 50.8°.
Benton SnackAbility
Overall SnackAbility
Benton, AR Crime Report
Crime in Benton summary. We use data from the FBI to determine the crime rates in Benton. Key points include:
There were 1,029 total crimes in Benton in the last reporting year.
The overall crime rate per 100,000 people in Benton is 2,679.1 / 100k people.
The violent crime rate per 100,000 people in Benton is 414.0 / 100k people.
The property crime rate per 100,000 people in Benton is 2,265.2 / 100k people.
Overall, crime in Benton is 26.42% above the national average.
Total Crimes
Above National Average
Crime In Benton Comparison Table
| Statistic | Count Raw |
Benton / 100k People |
Arkansas / 100k People |
National / 100k People |
|---|---|---|---|---|
| Total Crimes Per 100K | 1,029 | 2,679.1 | 2,508.9 | 2,119.2 |
| Violent Crime | 159 | 414.0 | 579.4 | 359.0 |
| Murder | 0 | 0.0 | 7.3 | 5.0 |
| Robbery | 12 | 31.2 | 38.6 | 61.0 |
| Aggravated Assault | 133 | 346.3 | 463.5 | 256.0 |
| Property Crime | 870 | 2,265.2 | 1,929.5 | 1,760.0 |
| Burglary | 91 | 236.9 | 352.7 | 229.0 |
| Larceny | 733 | 1,908.5 | 1,400.0 | 1,272.0 |
| Car Theft | 46 | 119.8 | 176.8 | 259.0 |
Benton, AR Cost Of Living
Cost of living in Benton summary. We use data on the cost of living to determine how expensive it is to live in Benton. Real estate prices drive most of the variance in cost of living around Arkansas. Key points include:
The cost of living in Benton is 95 with 100 being average.
The cost of living in Benton is 0.9x lower than the national average.
The median home value in Benton is $236,804.
The median income in Benton is $69,638.
Benton's Overall Cost Of Living
Lower Than The National Average
Cost Of Living In Benton Comparison Table
| Living Expense | Benton | Arkansas | National Average | |
|---|---|---|---|---|
| Overall | 95 | 85 | 100 | |
| Services | 106 | 99 | 100 | |
| Groceries | 96 | 95 | 100 | |
| Health | 89 | 89 | 100 | |
| Housing | 81 | 65 | 100 | |
| Transportation | 90 | 90 | 100 | |
| Utilities | 95 | 93 | 100 | |
Benton, AR Weather
The average high in Benton is 73.1° and the average low is 50.8°.
There are 74.3 days of precipitation each year.
Expect an average of 52.9 inches of precipitation each year with 3.7 inches of snow.
| Stat | Benton |
|---|---|
| Average Annual High | 73.1 |
| Average Annual Low | 50.8 |
| Annual Precipitation Days | 74.3 |
| Average Annual Precipitation | 52.9 |
| Average Annual Snowfall | 3.7 |
Average High
Days of Rain
Benton, AR Photos

1 Reviews & Comments About Benton
/5

HomeSnacks User - 2019-04-13 20:13:41.004586
High crime, nothing to do, bad schools, unsafe neighborhoods, high taxes, high rent prices, low home values, low wages, high gas prices. Friendly police force that tries very hard, they just can't keep up with the city growing too fast.
The bowling ally used to be a great past time in Benton but sadly, it has been replaced by a fitness center. What was good is gone and what is bad is getting worse.
Rankings for Benton in Arkansas


Locations Around Benton
Map Of Benton, AR
Best Places Around Benton
Maumelle, AR
Population 19,286
Sherwood, AR
Population 32,915
Cabot, AR
Population 26,733
Little Rock, AR
Population 202,739
Conway, AR
Population 66,288
Bryant, AR
Population 21,125
North Little Rock, AR
Population 64,504
Jacksonville, AR
Population 29,285
Malvern, AR
Population 10,938
East End, AR
Population 6,344
Benton Demographics And Statistics
Population over time in Benton
The current population in Benton is 35,954. The population has increased 23.5% from 2010.
| Year | Population | % Change |
|---|---|---|
| 2023 | 35,954 | 1.8% |
| 2022 | 35,318 | 1.6% |
| 2021 | 34,746 | -4.4% |
| 2020 | 36,360 | 1.9% |
| 2019 | 35,679 | 2.3% |
| 2018 | 34,873 | 2.5% |
| 2017 | 34,034 | 1.3% |
| 2016 | 33,613 | 2.7% |
| 2015 | 32,725 | 1.6% |
| 2014 | 32,208 | 2.1% |
| 2013 | 31,551 | 2.7% |
| 2012 | 30,736 | 2.6% |
| 2011 | 29,954 | 2.9% |
| 2010 | 29,118 | - |
Race / Ethnicity in Benton
Benton is:
77.8% White with 27,978 White residents.
9.6% African American with 3,454 African American residents.
0.2% American Indian with 65 American Indian residents.
1.5% Asian with 525 Asian residents.
0.0% Hawaiian with 0 Hawaiian residents.
0.0% Other with 0 Other residents.
4.3% Two Or More with 1,530 Two Or More residents.
6.7% Hispanic with 2,402 Hispanic residents.
| Race | Benton | AR | USA |
|---|---|---|---|
| White | 77.8% | 68.4% | 58.2% |
| African American | 9.6% | 14.8% | 12.0% |
| American Indian | 0.2% | 0.4% | 0.5% |
| Asian | 1.5% | 1.5% | 5.7% |
| Hawaiian | 0.0% | 0.4% | 0.2% |
| Other | 0.0% | 0.3% | 0.5% |
| Two Or More | 4.3% | 5.5% | 3.9% |
| Hispanic | 6.7% | 8.8% | 19.0% |
Gender in Benton
Benton is 50.1% female with 17,995 female residents.
Benton is 49.9% male with 17,958 male residents.
| Gender | Benton | AR | USA |
|---|---|---|---|
| Female | 50.1% | 50.7% | 50.5% |
| Male | 49.9% | 49.3% | 49.5% |
Highest level of educational attainment in Benton for adults over 25
1.0% of adults in Benton completed < 9th grade.
5.0% of adults in Benton completed 9-12th grade.
32.0% of adults in Benton completed high school / ged.
24.0% of adults in Benton completed some college.
9.0% of adults in Benton completed associate's degree.
19.0% of adults in Benton completed bachelor's degree.
7.0% of adults in Benton completed master's degree.
2.0% of adults in Benton completed professional degree.
1.0% of adults in Benton completed doctorate degree.
| Education | Benton | AR | USA |
|---|---|---|---|
| < 9th Grade | 1.0% | 5.0% | 5.0% |
| 9-12th Grade | 5.0% | 7.0% | 6.0% |
| High School / GED | 32.0% | 34.0% | 26.0% |
| Some College | 24.0% | 21.0% | 19.0% |
| Associate's Degree | 9.0% | 8.0% | 9.0% |
| Bachelor's Degree | 19.0% | 16.0% | 21.0% |
| Master's Degree | 7.0% | 7.0% | 10.0% |
| Professional Degree | 2.0% | 1.0% | 2.0% |
| Doctorate Degree | 1.0% | 1.0% | 2.0% |
Household Income For Benton, Arkansas
3.6% of households in Benton earn Less than $10,000.
3.0% of households in Benton earn $10,000 to $14,999.
6.6% of households in Benton earn $15,000 to $24,999.
8.5% of households in Benton earn $25,000 to $34,999.
14.6% of households in Benton earn $35,000 to $49,999.
18.7% of households in Benton earn $50,000 to $74,999.
11.0% of households in Benton earn $75,000 to $99,999.
18.2% of households in Benton earn $100,000 to $149,999.
9.5% of households in Benton earn $150,000 to $199,999.
6.2% of households in Benton earn $200,000 or more.
| Income | Benton | AR | USA |
|---|---|---|---|
| Less than $10,000 | 3.6% | 6.0% | 4.9% |
| $10,000 to $14,999 | 3.0% | 5.0% | 3.6% |
| $15,000 to $24,999 | 6.6% | 9.5% | 6.6% |
| $25,000 to $34,999 | 8.5% | 9.4% | 6.8% |
| $35,000 to $49,999 | 14.6% | 13.3% | 10.4% |
| $50,000 to $74,999 | 18.7% | 17.5% | 15.7% |
| $75,000 to $99,999 | 11.0% | 12.6% | 12.7% |
| $100,000 to $149,999 | 18.2% | 14.4% | 17.4% |
| $150,000 to $199,999 | 9.5% | 5.9% | 9.3% |
| $200,000 or more | 6.2% | 6.3% | 12.6% |


