Bentonville SnackAbility
Overall SnackAbility
Crime in Bentonville summary. We use data from the FBI to determine the crime rates in Bentonville. Key points include:
There were 662 total crimes in Bentonville in the last reporting year.
The overall crime rate per 100,000 people in Bentonville is 1,083.3 / 100k people.
The violent crime rate per 100,000 people in Bentonville is 255.3 / 100k people.
The property crime rate per 100,000 people in Bentonville is 828.0 / 100k people.
Overall, crime in Bentonville is -48.88% below the national average.
Total Crimes
Below National Average
Crime In Bentonville Comparison Table
| Statistic | Count Raw |
Bentonville / 100k People |
Arkansas / 100k People |
National / 100k People |
|---|---|---|---|---|
| Total Crimes Per 100K | 662 | 1,083.3 | 2,508.9 | 2,119.2 |
| Violent Crime | 156 | 255.3 | 579.4 | 359.0 |
| Murder | 3 | 4.9 | 7.3 | 5.0 |
| Robbery | 2 | 3.3 | 38.6 | 61.0 |
| Aggravated Assault | 128 | 209.5 | 463.5 | 256.0 |
| Property Crime | 506 | 828.0 | 1,929.5 | 1,760.0 |
| Burglary | 54 | 88.4 | 352.7 | 229.0 |
| Larceny | 421 | 688.9 | 1,400.0 | 1,272.0 |
| Car Theft | 31 | 50.7 | 176.8 | 259.0 |
Source: FBI Uniform Crime Reporting (2024)
Cost of living in Bentonville summary. We use data on the cost of living to determine how expensive it is to live in Bentonville. Real estate prices drive most of the variance in cost of living around Arkansas. Key points include:
The cost of living in Bentonville is 106 with 100 being average.
The cost of living in Bentonville is 1.1x higher than the national average.
The median home value in Bentonville is $488,112.
The median income in Bentonville is $112,792.
Bentonville's Overall Cost Of Living
Higher Than The National Average
Cost Of Living In Bentonville Comparison Table
| Living Expense | Bentonville | Arkansas | National Average |
|---|---|---|---|
| Overall | 106 | 85 | 100 |
| Services | 98 | 95 | 100 |
| Groceries | 95 | 93 | 100 |
| Health | 130 | 68 | 100 |
| Housing | 99 | 96 | 100 |
| Transportation | 95 | 92 | 100 |
| Utilities | 90 | 92 | 100 |
Source: Cost of living index, normalized to US average = 100
Bentonville, AR Weather
The average high in Bentonville is 68.7° and the average low is 46.4°.
There are 69.4 days of precipitation each year.
Expect an average of 47.0 inches of precipitation each year with 10.4 inches of snow.
| Stat | Bentonville |
|---|---|
| Average Annual High | 68.7 |
| Average Annual Low | 46.4 |
| Annual Precipitation Days | 69.4 |
| Average Annual Precipitation | 47.0 |
| Average Annual Snowfall | 10.4 |
Average High
Days of Rain
Source: NOAA climate normals (30-year)
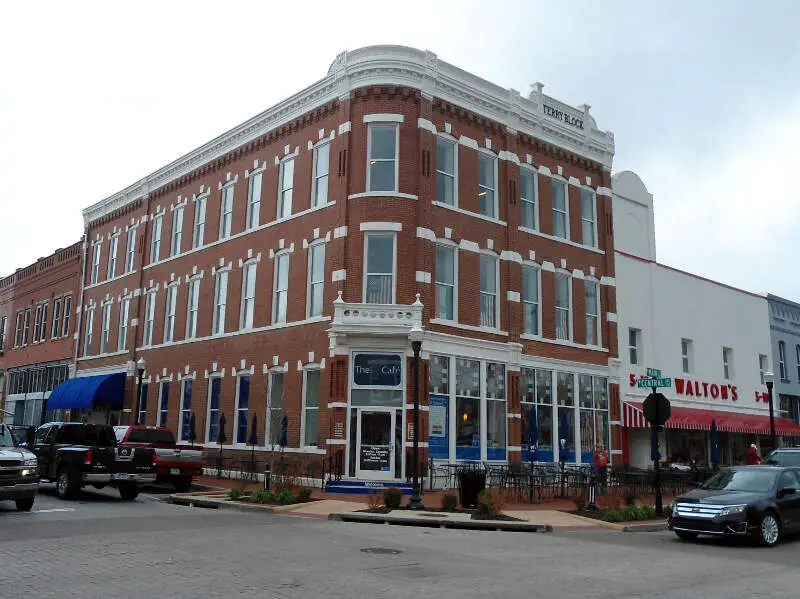
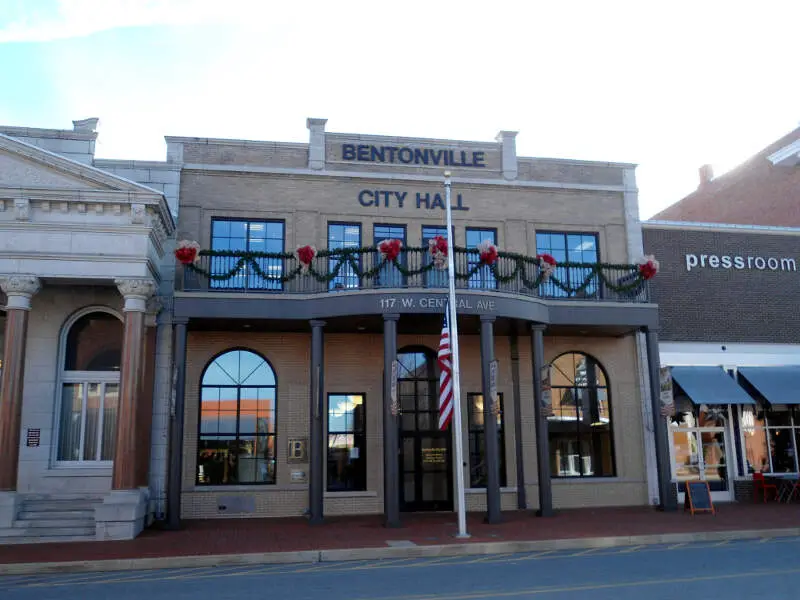
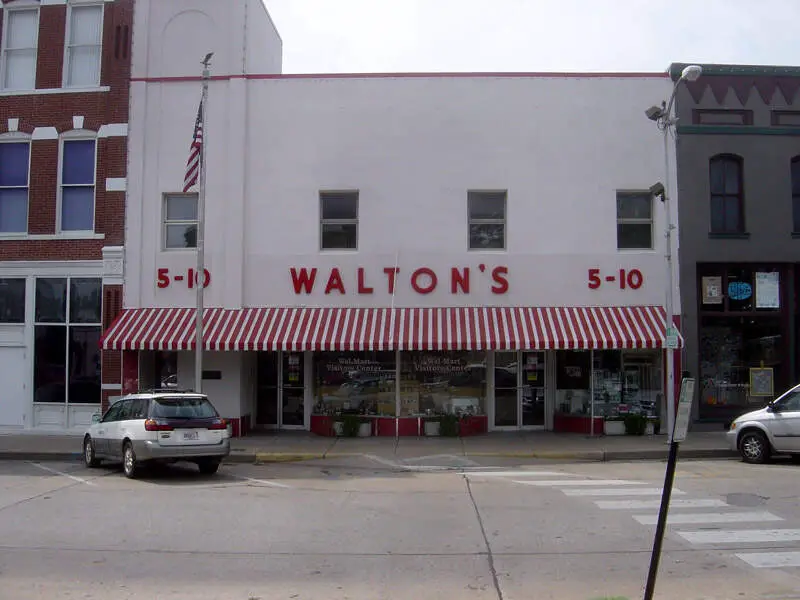
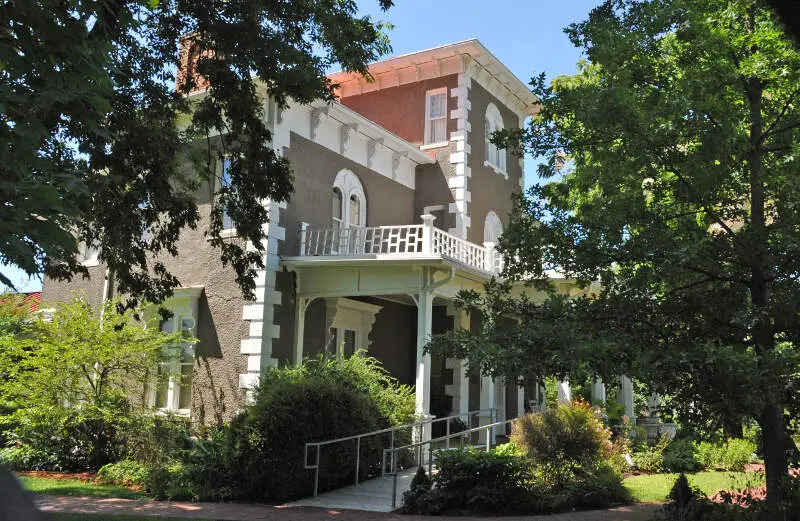
Bentonville, AR Photos


1 Reviews & Comments About Bentonville

That Sam Walton building is in Bentonville Arkansas NorthWest Arkansas Downtown Bentonville across a park with CSA statue and I was born in Bentonville Arkansas and it's beautiful compared to the rest of the state
Rankings & Articles For Bentonville


Locations Around Bentonville
Map Of Bentonville, AR
Best Places Around Bentonville
Springdale, AR
Population 88,160
Rogers, AR
Population 72,981
Centerton, AR
Population 21,920
Lowell, AR
Population 10,849
Bentonville Demographics And Statistics
Population over time in Bentonville
The current population in Bentonville is 58,249. The population has increased 78.2% from 2010.
| Year | Population | % Change |
|---|---|---|
| 2024 | 58,249 | 3.4% |
| 2023 | 56,326 | 3.3% |
| 2022 | 54,513 | 3.7% |
| 2021 | 52,565 | 1.0% |
| 2020 | 52,070 | 5.3% |
| 2019 | 49,467 | 5.6% |
| 2018 | 46,857 | 5.1% |
| 2017 | 44,601 | 4.9% |
| 2016 | 42,499 | 5.3% |
| 2015 | 40,368 | 4.7% |
| 2014 | 38,572 | 3.9% |
| 2013 | 37,131 | 4.2% |
| 2012 | 35,635 | 4.7% |
| 2011 | 34,022 | 4.1% |
| 2010 | 32,685 | - |
Race / Ethnicity in Bentonville
See the full breakdown
Bentonville is:
55.1% White with 32,069 White residents.
3.4% African American with 1,952 African American residents.
0.6% American Indian with 345 American Indian residents.
13.1% Asian with 7,655 Asian residents.
0.3% Hawaiian with 170 Hawaiian residents.
0.3% Other with 174 Other residents.
16.9% Two Or More with 9,858 Two Or More residents.
10.3% Hispanic with 6,026 Hispanic residents.
| Race | Bentonville | AR | USA |
|---|---|---|---|
| White | 55.1% | 67.4% | 57.4% |
| African American | 3.4% | 14.6% | 11.9% |
| American Indian | 0.6% | 0.3% | 0.5% |
| Asian | 13.1% | 1.6% | 5.9% |
| Hawaiian | 0.3% | 0.4% | 0.2% |
| Other | 0.3% | 0.3% | 0.6% |
| Two Or More | 16.9% | 6.3% | 4.3% |
| Hispanic | 10.3% | 9.0% | 19.3% |
Gender in Bentonville
See the full breakdown
Bentonville is 47.9% female with 27,892 female residents.
Bentonville is 52.1% male with 30,356 male residents.
| Gender | Bentonville | AR | USA |
|---|---|---|---|
| Female | 47.9% | 50.6% | 50.5% |
| Male | 52.1% | 49.4% | 49.5% |
Highest level of educational attainment in Bentonville for adults over 25
See the full breakdown
3.0% of adults in Bentonville completed < 9th grade.
3.0% of adults in Bentonville completed 9-12th grade.
18.0% of adults in Bentonville completed high school / ged.
14.0% of adults in Bentonville completed some college.
7.0% of adults in Bentonville completed associate's degree.
33.0% of adults in Bentonville completed bachelor's degree.
18.0% of adults in Bentonville completed master's degree.
3.0% of adults in Bentonville completed professional degree.
1.0% of adults in Bentonville completed doctorate degree.
| Education | Bentonville | AR | USA |
|---|---|---|---|
| < 9th Grade | 3.0% | 5.0% | 4.0% |
| 9-12th Grade | 3.0% | 7.0% | 6.0% |
| High School / GED | 18.0% | 34.0% | 26.0% |
| Some College | 14.0% | 21.0% | 19.0% |
| Associate's Degree | 7.0% | 8.0% | 9.0% |
| Bachelor's Degree | 33.0% | 16.0% | 22.0% |
| Master's Degree | 18.0% | 7.0% | 10.0% |
| Professional Degree | 3.0% | 1.0% | 2.0% |
| Doctorate Degree | 1.0% | 1.0% | 2.0% |
Household Income For Bentonville, Arkansas
See the full breakdown
2.9% of households in Bentonville earn Less than $10,000.
1.9% of households in Bentonville earn $10,000 to $14,999.
3.1% of households in Bentonville earn $15,000 to $24,999.
3.5% of households in Bentonville earn $25,000 to $34,999.
5.1% of households in Bentonville earn $35,000 to $49,999.
13.7% of households in Bentonville earn $50,000 to $74,999.
14.0% of households in Bentonville earn $75,000 to $99,999.
19.9% of households in Bentonville earn $100,000 to $149,999.
11.9% of households in Bentonville earn $150,000 to $199,999.
23.9% of households in Bentonville earn $200,000 or more.
| Income | Bentonville | AR | USA |
|---|---|---|---|
| Less than $10,000 | 2.9% | 6.1% | 5.0% |
| $10,000 to $14,999 | 1.9% | 4.9% | 3.4% |
| $15,000 to $24,999 | 3.1% | 8.9% | 6.3% |
| $25,000 to $34,999 | 3.5% | 9.1% | 6.6% |
| $35,000 to $49,999 | 5.1% | 12.9% | 10.1% |
| $50,000 to $74,999 | 13.7% | 17.4% | 15.5% |
| $75,000 to $99,999 | 14.0% | 12.8% | 12.6% |
| $100,000 to $149,999 | 19.9% | 15.0% | 17.5% |
| $150,000 to $199,999 | 11.9% | 6.2% | 9.6% |
| $200,000 or more | 23.9% | 6.7% | 13.4% |
Source: U.S. Census ACS 5-year estimates (2024)


