Fort Smith SnackAbility
Overall SnackAbility
Crime in Fort Smith summary. We use data from the FBI to determine the crime rates in Fort Smith. Key points include:
There were 4,073 total crimes in Fort Smith in the last reporting year.
The overall crime rate per 100,000 people in Fort Smith is 4,526.7 / 100k people.
The violent crime rate per 100,000 people in Fort Smith is 842.4 / 100k people.
The property crime rate per 100,000 people in Fort Smith is 3,684.3 / 100k people.
Overall, crime in Fort Smith is 113.60% above the national average.
Total Crimes
Above National Average
Crime In Fort Smith Comparison Table
| Statistic | Count Raw |
Fort Smith / 100k People |
Arkansas / 100k People |
National / 100k People |
|---|---|---|---|---|
| Total Crimes Per 100K | 4,073 | 4,526.7 | 2,508.9 | 2,119.2 |
| Violent Crime | 758 | 842.4 | 579.4 | 359.0 |
| Murder | 0 | 0.0 | 7.3 | 5.0 |
| Robbery | 59 | 65.6 | 38.6 | 61.0 |
| Aggravated Assault | 618 | 686.8 | 463.5 | 256.0 |
| Property Crime | 3,315 | 3,684.3 | 1,929.5 | 1,760.0 |
| Burglary | 420 | 466.8 | 352.7 | 229.0 |
| Larceny | 2,613 | 2,904.1 | 1,400.0 | 1,272.0 |
| Car Theft | 282 | 313.4 | 176.8 | 259.0 |
Source: FBI Uniform Crime Reporting (2024)
Cost of living in Fort Smith summary. We use data on the cost of living to determine how expensive it is to live in Fort Smith. Real estate prices drive most of the variance in cost of living around Arkansas. Key points include:
The cost of living in Fort Smith is 86 with 100 being average.
The cost of living in Fort Smith is 0.9x lower than the national average.
The median home value in Fort Smith is $193,976.
The median income in Fort Smith is $54,816.
Fort Smith's Overall Cost Of Living
Lower Than The National Average
Cost Of Living In Fort Smith Comparison Table
| Living Expense | Fort Smith | Arkansas | National Average |
|---|---|---|---|
| Overall | 86 | 85 | 100 |
| Services | 93 | 95 | 100 |
| Groceries | 97 | 93 | 100 |
| Health | 74 | 68 | 100 |
| Housing | 97 | 96 | 100 |
| Transportation | 90 | 92 | 100 |
| Utilities | 95 | 92 | 100 |
Source: Cost of living index, normalized to US average = 100
Fort Smith, AR Weather
The average high in Fort Smith is 72.9° and the average low is 49.6°.
There are 65.6 days of precipitation each year.
Expect an average of 47.8 inches of precipitation each year with 4.3 inches of snow.
| Stat | Fort Smith |
|---|---|
| Average Annual High | 72.9 |
| Average Annual Low | 49.6 |
| Annual Precipitation Days | 65.6 |
| Average Annual Precipitation | 47.8 |
| Average Annual Snowfall | 4.3 |
Average High
Days of Rain
Source: NOAA climate normals (30-year)
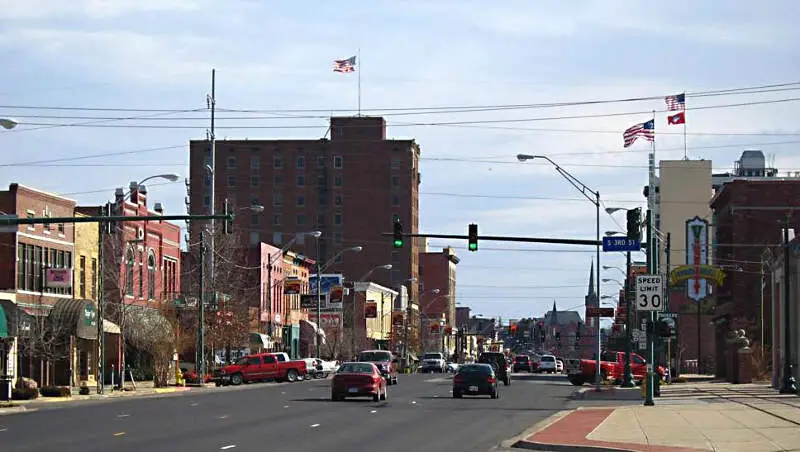
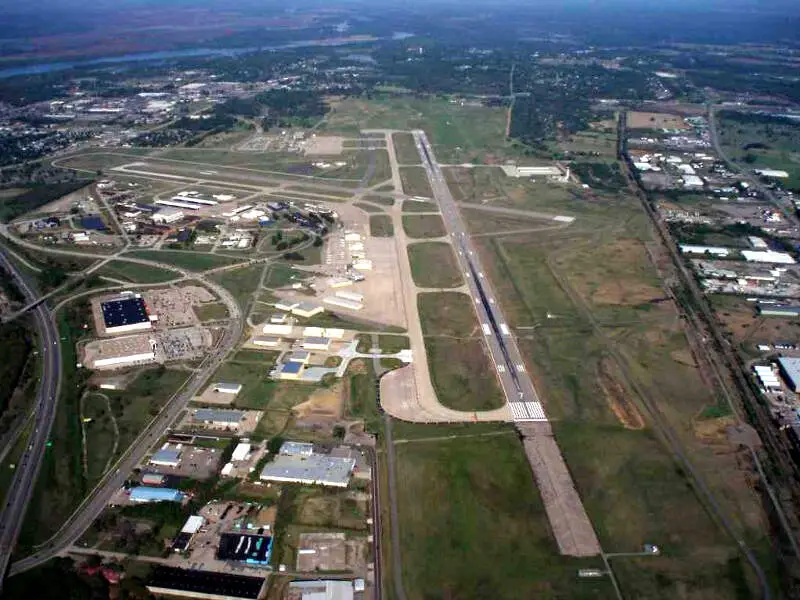
Fort Smith, AR Photos


Rankings & Articles For Fort Smith


Locations Around Fort Smith
Map Of Fort Smith, AR
Best Places Around Fort Smith
Van Buren, AR
Population 23,763
Greenwood, AR
Population 9,616
Farmington, AR
Population 9,094
Alma, AR
Population 5,906
Pocola, OK
Population 4,423
Sallisaw, OK
Population 8,605
Poteau, OK
Population 8,959
Fort Smith Demographics And Statistics
Population over time in Fort Smith
The current population in Fort Smith is 89,805. The population has increased 5.4% from 2010.
| Year | Population | % Change |
|---|---|---|
| 2024 | 89,805 | 0.3% |
| 2023 | 89,496 | 0.2% |
| 2022 | 89,315 | 0.2% |
| 2021 | 89,116 | 1.5% |
| 2020 | 87,788 | 0.1% |
| 2019 | 87,743 | 0.1% |
| 2018 | 87,639 | 0.1% |
| 2017 | 87,537 | -0.2% |
| 2016 | 87,712 | 0.1% |
| 2015 | 87,603 | 0.5% |
| 2014 | 87,193 | 0.3% |
| 2013 | 86,924 | 0.6% |
| 2012 | 86,382 | 0.6% |
| 2011 | 85,838 | 0.7% |
| 2010 | 85,200 | - |
Race / Ethnicity in Fort Smith
See the full breakdown
Fort Smith is:
58.1% White with 52,218 White residents.
7.0% African American with 6,285 African American residents.
0.7% American Indian with 654 American Indian residents.
5.3% Asian with 4,738 Asian residents.
0.0% Hawaiian with 32 Hawaiian residents.
0.3% Other with 259 Other residents.
8.0% Two Or More with 7,198 Two Or More residents.
20.5% Hispanic with 18,421 Hispanic residents.
| Race | Fort Smith | AR | USA |
|---|---|---|---|
| White | 58.1% | 67.4% | 57.4% |
| African American | 7.0% | 14.6% | 11.9% |
| American Indian | 0.7% | 0.3% | 0.5% |
| Asian | 5.3% | 1.6% | 5.9% |
| Hawaiian | 0.0% | 0.4% | 0.2% |
| Other | 0.3% | 0.3% | 0.6% |
| Two Or More | 8.0% | 6.3% | 4.3% |
| Hispanic | 20.5% | 9.0% | 19.3% |
Gender in Fort Smith
See the full breakdown
Fort Smith is 50.5% female with 45,363 female residents.
Fort Smith is 49.5% male with 44,442 male residents.
| Gender | Fort Smith | AR | USA |
|---|---|---|---|
| Female | 50.5% | 50.6% | 50.5% |
| Male | 49.5% | 49.4% | 49.5% |
Highest level of educational attainment in Fort Smith for adults over 25
See the full breakdown
8.0% of adults in Fort Smith completed < 9th grade.
8.0% of adults in Fort Smith completed 9-12th grade.
31.0% of adults in Fort Smith completed high school / ged.
21.0% of adults in Fort Smith completed some college.
8.0% of adults in Fort Smith completed associate's degree.
14.0% of adults in Fort Smith completed bachelor's degree.
6.0% of adults in Fort Smith completed master's degree.
2.0% of adults in Fort Smith completed professional degree.
2.0% of adults in Fort Smith completed doctorate degree.
| Education | Fort Smith | AR | USA |
|---|---|---|---|
| < 9th Grade | 8.0% | 5.0% | 4.0% |
| 9-12th Grade | 8.0% | 7.0% | 6.0% |
| High School / GED | 31.0% | 34.0% | 26.0% |
| Some College | 21.0% | 21.0% | 19.0% |
| Associate's Degree | 8.0% | 8.0% | 9.0% |
| Bachelor's Degree | 14.0% | 16.0% | 22.0% |
| Master's Degree | 6.0% | 7.0% | 10.0% |
| Professional Degree | 2.0% | 1.0% | 2.0% |
| Doctorate Degree | 2.0% | 1.0% | 2.0% |
Household Income For Fort Smith, Arkansas
See the full breakdown
5.6% of households in Fort Smith earn Less than $10,000.
5.9% of households in Fort Smith earn $10,000 to $14,999.
8.7% of households in Fort Smith earn $15,000 to $24,999.
10.5% of households in Fort Smith earn $25,000 to $34,999.
15.4% of households in Fort Smith earn $35,000 to $49,999.
18.6% of households in Fort Smith earn $50,000 to $74,999.
11.1% of households in Fort Smith earn $75,000 to $99,999.
14.1% of households in Fort Smith earn $100,000 to $149,999.
3.8% of households in Fort Smith earn $150,000 to $199,999.
6.2% of households in Fort Smith earn $200,000 or more.
| Income | Fort Smith | AR | USA |
|---|---|---|---|
| Less than $10,000 | 5.6% | 6.1% | 5.0% |
| $10,000 to $14,999 | 5.9% | 4.9% | 3.4% |
| $15,000 to $24,999 | 8.7% | 8.9% | 6.3% |
| $25,000 to $34,999 | 10.5% | 9.1% | 6.6% |
| $35,000 to $49,999 | 15.4% | 12.9% | 10.1% |
| $50,000 to $74,999 | 18.6% | 17.4% | 15.5% |
| $75,000 to $99,999 | 11.1% | 12.8% | 12.6% |
| $100,000 to $149,999 | 14.1% | 15.0% | 17.5% |
| $150,000 to $199,999 | 3.8% | 6.2% | 9.6% |
| $200,000 or more | 6.2% | 6.7% | 13.4% |
Source: U.S. Census ACS 5-year estimates (2024)


