Stuttgart SnackAbility
Overall SnackAbility
Crime in Stuttgart summary. We use data from the FBI to determine the crime rates in Stuttgart. Key points include:
There were 275 total crimes in Stuttgart in the last reporting year.
The overall crime rate per 100,000 people in Stuttgart is 3,598.5 / 100k people.
The violent crime rate per 100,000 people in Stuttgart is 1,308.6 / 100k people.
The property crime rate per 100,000 people in Stuttgart is 2,290.0 / 100k people.
Overall, crime in Stuttgart is 69.80% above the national average.
Total Crimes
Above National Average
Crime In Stuttgart Comparison Table
| Statistic | Count Raw |
Stuttgart / 100k People |
Arkansas / 100k People |
National / 100k People |
|---|---|---|---|---|
| Total Crimes Per 100K | 275 | 3,598.5 | 2,508.9 | 2,119.2 |
| Violent Crime | 100 | 1,308.6 | 579.4 | 359.0 |
| Murder | 0 | 0.0 | 7.3 | 5.0 |
| Robbery | 2 | 26.2 | 38.6 | 61.0 |
| Aggravated Assault | 81 | 1,059.9 | 463.5 | 256.0 |
| Property Crime | 175 | 2,290.0 | 1,929.5 | 1,760.0 |
| Burglary | 37 | 484.2 | 352.7 | 229.0 |
| Larceny | 122 | 1,596.4 | 1,400.0 | 1,272.0 |
| Car Theft | 16 | 209.4 | 176.8 | 259.0 |
Source: FBI Uniform Crime Reporting (2024)
Cost of living in Stuttgart summary. We use data on the cost of living to determine how expensive it is to live in Stuttgart. Real estate prices drive most of the variance in cost of living around Arkansas. Key points include:
The cost of living in Stuttgart is 83 with 100 being average.
The cost of living in Stuttgart is 0.8x lower than the national average.
The median home value in Stuttgart is $118,229.
The median income in Stuttgart is $49,399.
Stuttgart's Overall Cost Of Living
Lower Than The National Average
Cost Of Living In Stuttgart Comparison Table
| Living Expense | Stuttgart | Arkansas | National Average |
|---|---|---|---|
| Overall | 83 | 85 | 100 |
| Services | 94 | 95 | 100 |
| Groceries | 97 | 93 | 100 |
| Health | 62 | 68 | 100 |
| Housing | 91 | 96 | 100 |
| Transportation | 94 | 92 | 100 |
| Utilities | 95 | 92 | 100 |
Source: Cost of living index, normalized to US average = 100
Stuttgart, AR Weather
The average high in Stuttgart is 72.6° and the average low is 52.3°.
There are 66.3 days of precipitation each year.
Expect an average of 50.2 inches of precipitation each year with 1.9 inches of snow.
| Stat | Stuttgart |
|---|---|
| Average Annual High | 72.6 |
| Average Annual Low | 52.3 |
| Annual Precipitation Days | 66.3 |
| Average Annual Precipitation | 50.2 |
| Average Annual Snowfall | 1.9 |
Average High
Days of Rain
Source: NOAA climate normals (30-year)
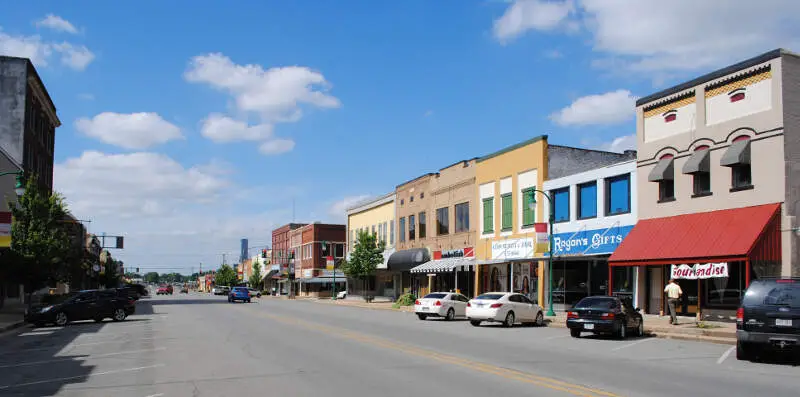
Stuttgart, AR Photos

Rankings & Articles For Stuttgart


Locations Around Stuttgart
Map Of Stuttgart, AR
Best Places Around Stuttgart
Sherwood, AR
Population 33,070
Cabot, AR
Population 26,960
Little Rock, AR
Population 203,436
North Little Rock, AR
Population 64,538
Jacksonville, AR
Population 29,221
East End, AR
Population 6,912
White Hall, AR
Population 5,512
Pine Bluff, AR
Population 39,743
Star, ID
Population 14,745
Beebe, AR
Population 8,707
Stuttgart Demographics And Statistics
Population over time in Stuttgart
The current population in Stuttgart is 7,903. The population has decreased 15.9% from 2010.
| Year | Population | % Change |
|---|---|---|
| 2024 | 7,903 | -1.9% |
| 2023 | 8,060 | -1.6% |
| 2022 | 8,189 | -2.1% |
| 2021 | 8,363 | -2.9% |
| 2020 | 8,617 | -1.2% |
| 2019 | 8,720 | -1.6% |
| 2018 | 8,866 | -1.3% |
| 2017 | 8,979 | -1.6% |
| 2016 | 9,125 | -0.8% |
| 2015 | 9,195 | -0.8% |
| 2014 | 9,269 | -0.4% |
| 2013 | 9,308 | -0.1% |
| 2012 | 9,313 | -0.5% |
| 2011 | 9,356 | -0.5% |
| 2010 | 9,400 | - |
Race / Ethnicity in Stuttgart
See the full breakdown
Stuttgart is:
52.2% White with 4,129 White residents.
42.2% African American with 3,337 African American residents.
0.1% American Indian with 7 American Indian residents.
0.1% Asian with 10 Asian residents.
0.0% Hawaiian with 0 Hawaiian residents.
0.0% Other with 0 Other residents.
2.6% Two Or More with 203 Two Or More residents.
2.7% Hispanic with 217 Hispanic residents.
| Race | Stuttgart | AR | USA |
|---|---|---|---|
| White | 52.2% | 67.4% | 57.4% |
| African American | 42.2% | 14.6% | 11.9% |
| American Indian | 0.1% | 0.3% | 0.5% |
| Asian | 0.1% | 1.6% | 5.9% |
| Hawaiian | 0.0% | 0.4% | 0.2% |
| Other | 0.0% | 0.3% | 0.6% |
| Two Or More | 2.6% | 6.3% | 4.3% |
| Hispanic | 2.7% | 9.0% | 19.3% |
Gender in Stuttgart
See the full breakdown
Stuttgart is 51.9% female with 4,098 female residents.
Stuttgart is 48.1% male with 3,805 male residents.
| Gender | Stuttgart | AR | USA |
|---|---|---|---|
| Female | 51.9% | 50.6% | 50.5% |
| Male | 48.1% | 49.4% | 49.5% |
Highest level of educational attainment in Stuttgart for adults over 25
See the full breakdown
5.0% of adults in Stuttgart completed < 9th grade.
12.0% of adults in Stuttgart completed 9-12th grade.
41.0% of adults in Stuttgart completed high school / ged.
20.0% of adults in Stuttgart completed some college.
9.0% of adults in Stuttgart completed associate's degree.
8.0% of adults in Stuttgart completed bachelor's degree.
4.0% of adults in Stuttgart completed master's degree.
1.0% of adults in Stuttgart completed professional degree.
0.0% of adults in Stuttgart completed doctorate degree.
| Education | Stuttgart | AR | USA |
|---|---|---|---|
| < 9th Grade | 5.0% | 5.0% | 4.0% |
| 9-12th Grade | 12.0% | 7.0% | 6.0% |
| High School / GED | 41.0% | 34.0% | 26.0% |
| Some College | 20.0% | 21.0% | 19.0% |
| Associate's Degree | 9.0% | 8.0% | 9.0% |
| Bachelor's Degree | 8.0% | 16.0% | 22.0% |
| Master's Degree | 4.0% | 7.0% | 10.0% |
| Professional Degree | 1.0% | 1.0% | 2.0% |
| Doctorate Degree | 0.0% | 1.0% | 2.0% |
Household Income For Stuttgart, Arkansas
See the full breakdown
6.5% of households in Stuttgart earn Less than $10,000.
11.0% of households in Stuttgart earn $10,000 to $14,999.
9.6% of households in Stuttgart earn $15,000 to $24,999.
11.2% of households in Stuttgart earn $25,000 to $34,999.
12.1% of households in Stuttgart earn $35,000 to $49,999.
16.9% of households in Stuttgart earn $50,000 to $74,999.
12.7% of households in Stuttgart earn $75,000 to $99,999.
11.2% of households in Stuttgart earn $100,000 to $149,999.
6.4% of households in Stuttgart earn $150,000 to $199,999.
2.4% of households in Stuttgart earn $200,000 or more.
| Income | Stuttgart | AR | USA |
|---|---|---|---|
| Less than $10,000 | 6.5% | 6.1% | 5.0% |
| $10,000 to $14,999 | 11.0% | 4.9% | 3.4% |
| $15,000 to $24,999 | 9.6% | 8.9% | 6.3% |
| $25,000 to $34,999 | 11.2% | 9.1% | 6.6% |
| $35,000 to $49,999 | 12.1% | 12.9% | 10.1% |
| $50,000 to $74,999 | 16.9% | 17.4% | 15.5% |
| $75,000 to $99,999 | 12.7% | 12.8% | 12.6% |
| $100,000 to $149,999 | 11.2% | 15.0% | 17.5% |
| $150,000 to $199,999 | 6.4% | 6.2% | 9.6% |
| $200,000 or more | 2.4% | 6.7% | 13.4% |
Source: U.S. Census ACS 5-year estimates (2024)


