Is your current neighborhood safe? Do you like your neighborhood? If you answered “NO” to any one of those questions, you should really think about moving to one of Columbus’ best neighborhoods — the best Ohio has to offer.
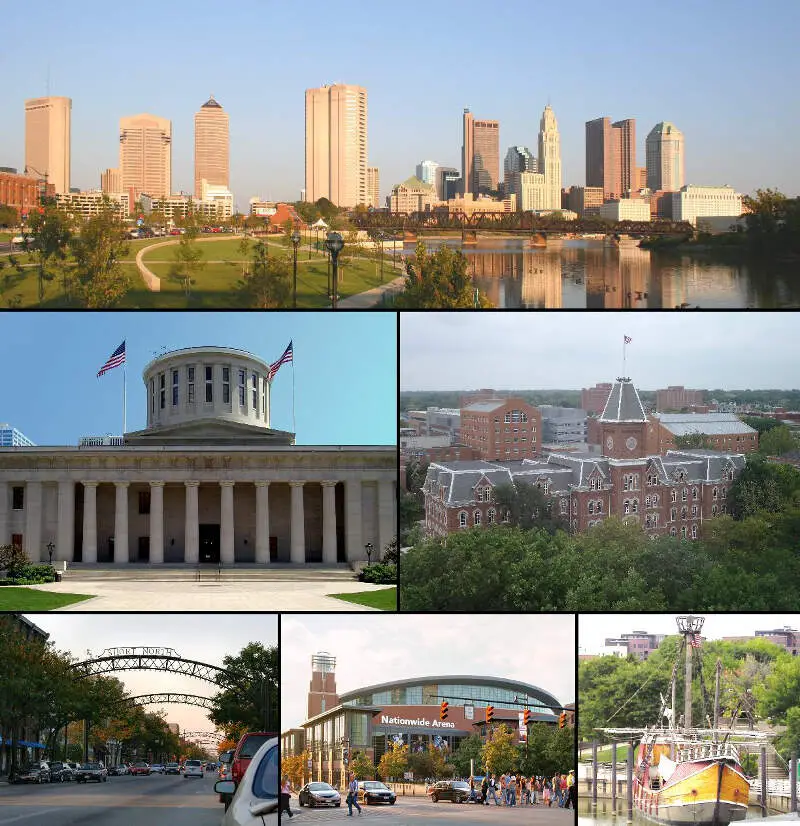
Yes, you can thank The Discovery City for the very first Wendy’s and The Ohio State University; and after you take a look at the top ten best neighborhoods in Columbus for 2025 below, you can thank HomeSnacks.
To get a list of the best neighborhoods in Columbus we looked at the latest census report for the median income and median home price for each one of Columbus’ 39 neighborhoods. Our thinking, more expensive homes draw people with higher incomes and that usually translates to better neighborhoods. For example, to live in Columbus’ best neighborhood, you’re going to have to make at least $53,310/year to afford the $148,777 homes in this area. And while this is normally the case, there are some exceptions to the rule: in Columbus’ Northwest neighborhood, you only need to make $53,310/year to afford the $148,777 price tag for a home.
And because we can’t make a top ten list of best neighborhoods in any city without looking at things like crime, unemployment rates and fun stuff to do, we looked at those things, too. Unfortunately, Columbus’ crime rate is 54% above the national average, but you won’t find those numbers in Columbus’ best neighborhoods. Cowtown’s best hoods have recorded crime numbers well below the national average and their unemployment rates are following the same lead. This is quite impressive for a city that’s actually one of the most populous cities in America.
This sounds like a perfect living situation to us, so grab a frosty, find a sunny spot in one of Victorian Village’s parks, and scroll down to pick a neighborhood from Columbus’ stellar top ten list.
Table Of Contents: Top Ten | Methodology | Summary | Table
We’re pretty sure that if we asked the Columbusites who currently reside in the best neighborhoods in Columbus why they think their neighborhood is top notch, we would hear things like: “There’s nothing like walking with a couple of friendly neighbors down to the Columbus Brew Fest every year from Italian Village” and/or “There’s nothing like kicking back with a latte at one of the cafes in the Clintonville neighborhood.” Sounds pretty fun, right?
So, want to know the number one neighborhood in Columbus? According to the latest data, that would be Harrison West.
Want to know the other Columbus neighborhoods that are super safe, affordable, and super fun? Take a look below; and if you don’t find what you’re looking for there, head to the bottom.
For more Ohio reading, check out:
The 10 Best Neighborhoods To Live In Columbus
1. Harrison West
Population: 3,364
Median Home Value: $394,425 (best)
Median Income: $93,488 (Third best)
More on Harrison West:
2. Bexley
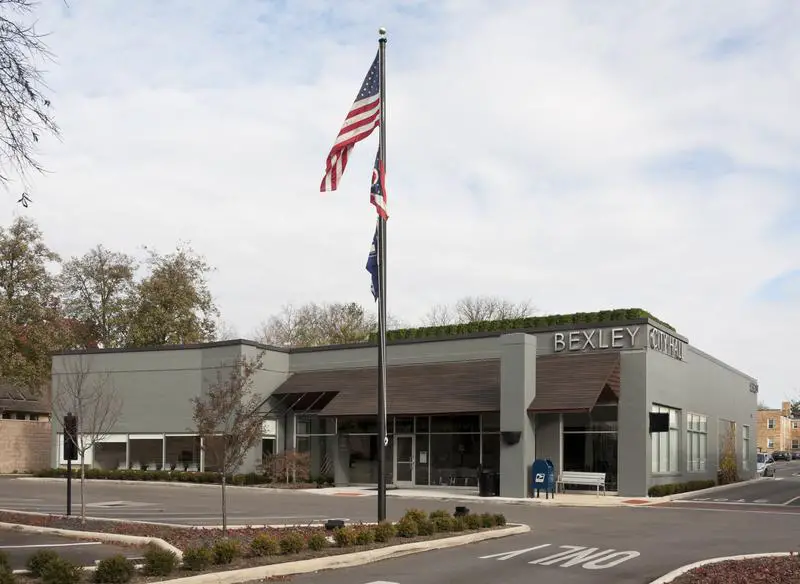
Population: 13,485
Median Home Value: $337,683 (Second best)
Median Income: $114,868 (best)
More on Bexley:
3. Clintonville
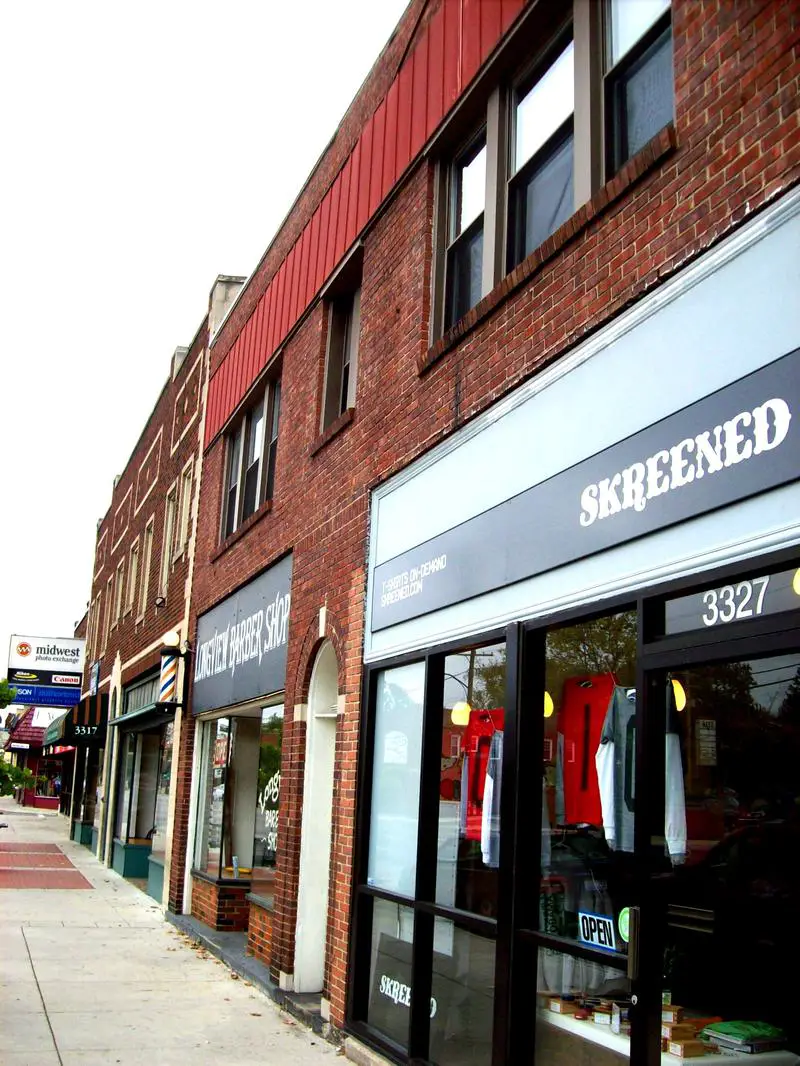
Population: 9,039
Median Home Value: $270,860 (Sixth best)
Median Income: $87,515 (Fourth best)
More on Clintonville:
4. Upper Arlington
Population: 43,520
Median Home Value: $335,316 (Third best)
Median Income: $102,607 (Second best)
More on Upper Arlington:
5. Victorican Village

Population: 3,989
Median Home Value: $264,575 (Seventh best)
Median Income: $69,438 (12th best)
More on Victorican Village:
6. Italian Village
Population: 3,530
Median Home Value: $320,000 (Fifth best)
Median Income: $72,750 (Ninth best)
More on Italian Village:
7. Brewery
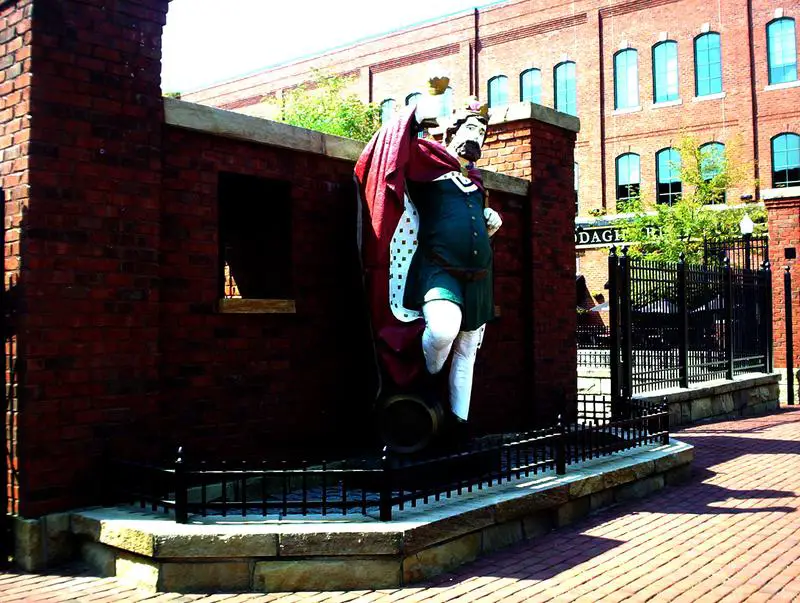
Population: 1,967
Median Home Value: $331,050 (Fourth best)
Median Income: $75,120 (Eighth best)
More on Brewery:
8. Worthington
Population: 14,074
Median Home Value: $235,220 (Tenth best)
Median Income: $87,419 (Fifth best)
More on Worthington:
9. Northwest
Population: 79,502
Median Home Value: $176,663 (13th best)
Median Income: $71,352 (11th best)
More on Northwest:
10. Downtown
Population: 7,097
Median Home Value: $245,240 (Eighth best)
Median Income: $58,670 (13th best)
More on Downtown:
Methodology: How We Determined The Best Columbus, OH Neighborhoods In 2025
To rank the best neighborhoods in Columbus, we had to determine what criteria define “best” and then apply Saturday Night Science to it.
Using FBI crime, Census, and extrapolated BLS data, we arrived at the following set of criteria:
- High incomes
- Low unemployment rates
- Low crime
- High home prices
- High population densities (A proxy for things to do)
We then ranked each neighborhood with scores from 1 to 39 in each category, where 1 was the best.
Next, we averaged the rankings for each neighborhood to create a best neighborhood index.
And finally, we crowned the neighborhood with the lowest best neighborhood index, the “Best City Neighborhood In Columbus.” We’re lookin’ at you, Harrison West.
Read on below to learn more about what it’s like to live in the best places Columbus, Ohio has to offer. Or skip to the end to see the list of all the neighborhoods in the city, from best to worst.
We updated this article for 2025. This report is our tenth time ranking the best neighborhoods to live in Columbus.
Summary: Putting A Bow On Our Analysis Of The Best Neighborhoods In Columbus
If you’re measuring the neighborhoods in Columbus where crime is low and everyone wants to live, this is an accurate list.
The best neighborhoods in Columbus are Harrison West, Bexley, Clintonville, Upper Arlington, Victorican Village, Italian Village, Brewery, Worthington, Northwest, and Downtown.
As mentioned earlier, the neighborhoods in Columbus aren’t all good. Milo Grogan takes the title of the worst neighborhood to live in Columbus.
The worst neighborhoods in Columbus are Milo Grogan, Fort Columbus Airport, Olentangy River Road, Tri-South, and North Central.
We ranked the neighborhoods from best to worst in the chart below.
For more Ohio reading, check out:
Best Neighborhoods To Live In Columbus For 2025 Detailed Data
| Rank | Neighborhood | Population | Home Value | Median Income |
|---|---|---|---|---|
| 1 | Harrison West | 3,364 | $394,425 | $93,488 |
| 2 | Bexley | 13,485 | $337,683 | $114,868 |
| 3 | Clintonville | 9,039 | $270,860 | $87,515 |
| 4 | Upper Arlington | 43,520 | $335,316 | $102,607 |
| 5 | Victorican Village | 3,989 | $264,575 | $69,438 |
| 6 | Italian Village | 3,530 | $320,000 | $72,750 |
| 7 | Brewery | 1,967 | $331,050 | $75,120 |
| 8 | Worthington | 14,074 | $235,220 | $87,419 |
| 9 | Northwest | 79,502 | $176,663 | $71,352 |
| 10 | Downtown | 7,097 | $245,240 | $58,670 |
| 11 | Rocky-Fork Blacklick Accord | 8,709 | $186,386 | $80,400 |
| 12 | Far North | 33,986 | $189,350 | $77,465 |
| 13 | West Columbus Interim | 53,633 | $162,432 | $72,645 |
| 14 | Mckinley Avenue Corridor | 5,558 | $129,933 | $50,635 |
| 15 | Northland | 122,528 | $123,442 | $54,666 |
| 16 | Weinland Park | 4,287 | $243,900 | $41,409 |
| 17 | Brice-Tussing | 27,035 | $113,760 | $51,585 |
| 18 | Southside | 15,464 | $99,115 | $53,356 |
| 19 | Southwest | 8,116 | $86,075 | $55,392 |
| 20 | Westland | 36,756 | $113,830 | $49,688 |
| 21 | North Linden | 30,894 | $86,266 | $40,367 |
| 22 | Southeast | 2,922 | $88,860 | $47,200 |
| 23 | Near East | 17,159 | $93,138 | $32,468 |
| 24 | University | 35,689 | $77,338 | $28,806 |
| 25 | South Central Accord | 2,511 | $151,800 | $53,556 |
| 26 | Greater Hilltop | 65,257 | $74,258 | $37,375 |
| 27 | Whitehall | 18,878 | $77,695 | $39,753 |
| 28 | Northeast | 29,406 | $81,032 | $34,150 |
| 29 | Far South | 13,301 | $78,615 | $39,897 |
| 30 | South Alum Creek | 4,981 | $95,450 | $49,726 |
| 31 | Franklinton | 8,060 | $74,150 | $24,247 |
| 32 | South Side | 14,750 | $75,823 | $33,791 |
| 33 | Near Southside | 16,697 | $58,285 | $29,952 |
| 34 | South Linden | 9,828 | $64,136 | $26,075 |
| 35 | North Central | 9,534 | $64,230 | $31,482 |
| 36 | Tri-South | 4,051 | $65,500 | $33,916 |
| 37 | Olentangy River Road | 3,967 | $28,529 | $23,333 |
| 38 | Fort Columbus Airport | 3,184 | $31,675 | $28,221 |
| 39 | Milo Grogan | 1,513 | $76,300 | $24,311 |


