Compare Columbus to…
Columbus SnackAbility
Overall SnackAbility
Crime in Columbus summary. We use data from the FBI to determine the crime rates in Columbus. Key points include:
There were 28,271 total crimes in Columbus in the last reporting year.
The overall crime rate per 100,000 people in Columbus is 3,088.2 / 100k people.
The violent crime rate per 100,000 people in Columbus is 434.9 / 100k people.
The property crime rate per 100,000 people in Columbus is 2,653.3 / 100k people.
Overall, crime in Columbus is 45.72% above the national average.
Total Crimes
Above National Average
Crime In Columbus Comparison Table
| Statistic | Count Raw |
Columbus / 100k People |
Ohio / 100k People |
National / 100k People |
|---|---|---|---|---|
| Total Crimes Per 100K | 28,271 | 3,088.2 | 1,844.9 | 2,119.2 |
| Violent Crime | 3,981 | 434.9 | 293.7 | 359.0 |
| Murder | 112 | 12.2 | 5.0 | 5.0 |
| Robbery | 803 | 87.7 | 45.5 | 61.0 |
| Aggravated Assault | 1,929 | 210.7 | 197.4 | 256.0 |
| Property Crime | 24,290 | 2,653.3 | 1,551.2 | 1,760.0 |
| Burglary | 3,703 | 404.5 | 206.0 | 229.0 |
| Larceny | 15,618 | 1,706.1 | 1,132.8 | 1,272.0 |
| Car Theft | 4,969 | 542.8 | 212.5 | 259.0 |
Source: FBI Uniform Crime Reporting (2024)
Cost of living in Columbus summary. We use data on the cost of living to determine how expensive it is to live in Columbus. Real estate prices drive most of the variance in cost of living around Ohio. Key points include:
The cost of living in Columbus is 96 with 100 being average.
The cost of living in Columbus is 1.0x lower than the national average.
The median home value in Columbus is $245,979.
The median income in Columbus is $66,082.
Columbus's Overall Cost Of Living
Lower Than The National Average
Cost Of Living In Columbus Comparison Table
| Living Expense | Columbus | Ohio | National Average |
|---|---|---|---|
| Overall | 96 | 90 | 100 |
| Services | 101 | 97 | 100 |
| Groceries | 99 | 97 | 100 |
| Health | 93 | 75 | 100 |
| Housing | 100 | 97 | 100 |
| Transportation | 97 | 95 | 100 |
| Utilities | 94 | 97 | 100 |
Source: Cost of living index, normalized to US average = 100
Columbus, OH Weather
The average high in Columbus is 62.3° and the average low is 43.2°.
There are 78.6 days of precipitation each year.
Expect an average of 38.5 inches of precipitation each year with 22.3 inches of snow.
| Stat | Columbus |
|---|---|
| Average Annual High | 62.3 |
| Average Annual Low | 43.2 |
| Annual Precipitation Days | 78.6 |
| Average Annual Precipitation | 38.5 |
| Average Annual Snowfall | 22.3 |
Average High
Days of Rain
Source: NOAA climate normals (30-year)
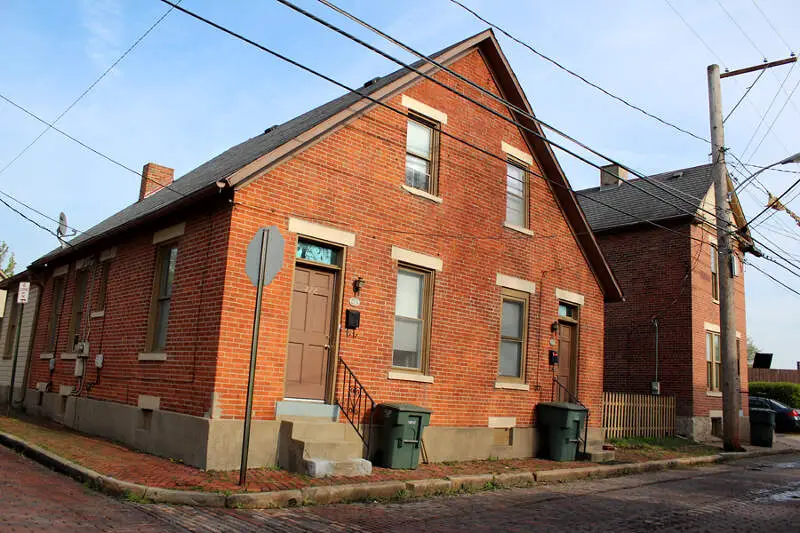
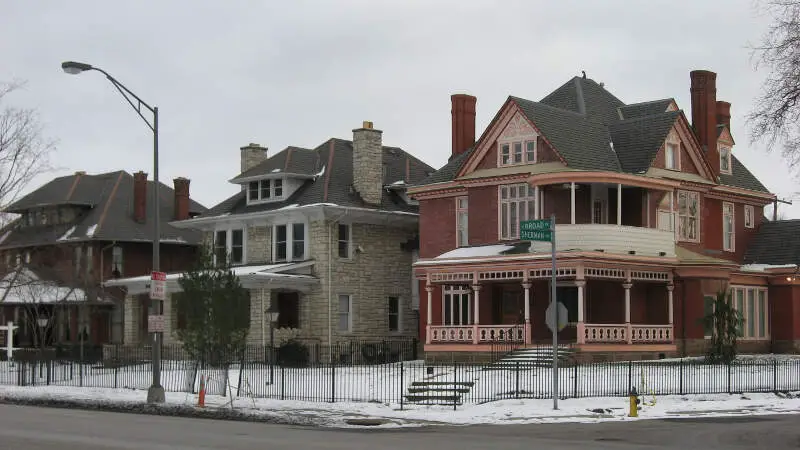
Columbus, OH Photos


5 Reviews & Comments About Columbus

There is a place called the dump in Columbus, it's right below the hospital, Luke if you walk out the hospital doors you are there. It's downtown, gas leaks are well known there, and the town I live in has a lot of crimes. Look on the bright side, Ohio is a healthy state, we grow most crops in the U.S. and we get the most fresh water in the U.S but there are more churches than EVER in Ohio. Grove city is pretty family friendly. We don't live in Grove city but my stepmom does. Ohio is home and Dayton is home to the wright brothers, and northern Ohio is where Jhon glenn is from!! We also have a lot of landmarks here and we are in the hall of fame.
Crime is fairly low, cost of living is low, good job market
Thurmans, hound dogs pizza, columbus zoo, nationwide arena, records per minute, lost weekend records
City centered around The Ohio State University but with a lackluster downtown and surrounded by suburbia.
S****y weather and tons of traffic with road construction.
Columbus is an inviting city with friendly people. It's a safe place to visit with many things for families to do such as the Columbus Zoo and Aquarium, COSI, and a wide variety of restaurants.
The Columbus Zoo and Aquarium is a wonderful place for a family to visit. There are also many wonderful restaurants and breweries downtown to enjoy. COSI, a science center, is another fun place for a family to visit.
Our school buildings are old and many do not have air conditioning. College football is immensely popular here, housing is plentiful, and there are a host of restaurants out there one can eat at.
The traffic on the major roads in the morning and afternoon and be rather bad and construction isn't helping. The weather can be hot in the summer and quite cold in the winter, but it's still a decent place in which to live.
Rankings & Articles For Columbus


Locations Around Columbus
Map Of Columbus, OH
Best Places Around Columbus
Upper Arlington, OH
Population 36,293
Powell, OH
Population 14,451
Bexley, OH
Population 13,114
Gahanna, OH
Population 35,486
Grandview Heights, OH
Population 8,647
Dublin, OH
Population 49,294
Hilliard, OH
Population 38,033
New Albany, OH
Population 10,896
Westerville, OH
Population 38,645
Worthington, OH
Population 14,938
Columbus Demographics And Statistics
Population over time in Columbus
The current population in Columbus is 914,802. The population has increased 18.7% from 2010.
| Year | Population | % Change |
|---|---|---|
| 2024 | 914,802 | 0.9% |
| 2023 | 906,480 | 0.4% |
| 2022 | 902,449 | 0.5% |
| 2021 | 898,143 | 1.0% |
| 2020 | 889,079 | 1.2% |
| 2019 | 878,553 | 1.3% |
| 2018 | 867,628 | 1.8% |
| 2017 | 852,144 | 1.8% |
| 2016 | 837,038 | 1.5% |
| 2015 | 824,663 | 1.6% |
| 2014 | 811,943 | 1.4% |
| 2013 | 800,594 | 1.3% |
| 2012 | 790,168 | 1.4% |
| 2011 | 779,573 | 1.2% |
| 2010 | 770,407 | - |
Race / Ethnicity in Columbus
See the full breakdown
Columbus is:
50.7% White with 463,364 White residents.
29.1% African American with 266,171 African American residents.
0.1% American Indian with 625 American Indian residents.
5.9% Asian with 54,326 Asian residents.
0.0% Hawaiian with 269 Hawaiian residents.
0.6% Other with 5,184 Other residents.
5.4% Two Or More with 49,278 Two Or More residents.
8.3% Hispanic with 75,585 Hispanic residents.
| Race | Columbus | OH | USA |
|---|---|---|---|
| White | 50.7% | 75.8% | 57.4% |
| African American | 29.1% | 12.0% | 11.9% |
| American Indian | 0.1% | 0.1% | 0.5% |
| Asian | 5.9% | 2.5% | 5.9% |
| Hawaiian | 0.0% | 0.0% | 0.2% |
| Other | 0.6% | 0.4% | 0.6% |
| Two Or More | 5.4% | 4.3% | 4.3% |
| Hispanic | 8.3% | 4.8% | 19.3% |
Gender in Columbus
See the full breakdown
Columbus is 50.8% female with 464,716 female residents.
Columbus is 49.2% male with 450,085 male residents.
| Gender | Columbus | OH | USA |
|---|---|---|---|
| Female | 50.8% | 50.7% | 50.5% |
| Male | 49.2% | 49.3% | 49.5% |
Highest level of educational attainment in Columbus for adults over 25
See the full breakdown
5.0% of adults in Columbus completed < 9th grade.
6.0% of adults in Columbus completed 9-12th grade.
25.0% of adults in Columbus completed high school / ged.
19.0% of adults in Columbus completed some college.
7.0% of adults in Columbus completed associate's degree.
24.0% of adults in Columbus completed bachelor's degree.
10.0% of adults in Columbus completed master's degree.
2.0% of adults in Columbus completed professional degree.
2.0% of adults in Columbus completed doctorate degree.
| Education | Columbus | OH | USA |
|---|---|---|---|
| < 9th Grade | 5.0% | 3.0% | 4.0% |
| 9-12th Grade | 6.0% | 6.0% | 6.0% |
| High School / GED | 25.0% | 32.0% | 26.0% |
| Some College | 19.0% | 19.0% | 19.0% |
| Associate's Degree | 7.0% | 9.0% | 9.0% |
| Bachelor's Degree | 24.0% | 19.0% | 22.0% |
| Master's Degree | 10.0% | 9.0% | 10.0% |
| Professional Degree | 2.0% | 2.0% | 2.0% |
| Doctorate Degree | 2.0% | 1.0% | 2.0% |
Household Income For Columbus, Ohio
See the full breakdown
5.9% of households in Columbus earn Less than $10,000.
4.1% of households in Columbus earn $10,000 to $14,999.
6.7% of households in Columbus earn $15,000 to $24,999.
7.3% of households in Columbus earn $25,000 to $34,999.
13.2% of households in Columbus earn $35,000 to $49,999.
18.4% of households in Columbus earn $50,000 to $74,999.
13.3% of households in Columbus earn $75,000 to $99,999.
16.7% of households in Columbus earn $100,000 to $149,999.
7.5% of households in Columbus earn $150,000 to $199,999.
6.9% of households in Columbus earn $200,000 or more.
| Income | Columbus | OH | USA |
|---|---|---|---|
| Less than $10,000 | 5.9% | 5.2% | 5.0% |
| $10,000 to $14,999 | 4.1% | 4.0% | 3.4% |
| $15,000 to $24,999 | 6.7% | 7.1% | 6.3% |
| $25,000 to $34,999 | 7.3% | 7.5% | 6.6% |
| $35,000 to $49,999 | 13.2% | 11.6% | 10.1% |
| $50,000 to $74,999 | 18.4% | 16.9% | 15.5% |
| $75,000 to $99,999 | 13.3% | 13.1% | 12.6% |
| $100,000 to $149,999 | 16.7% | 17.1% | 17.5% |
| $150,000 to $199,999 | 7.5% | 8.3% | 9.6% |
| $200,000 or more | 6.9% | 9.1% | 13.4% |
Source: U.S. Census ACS 5-year estimates (2024)


