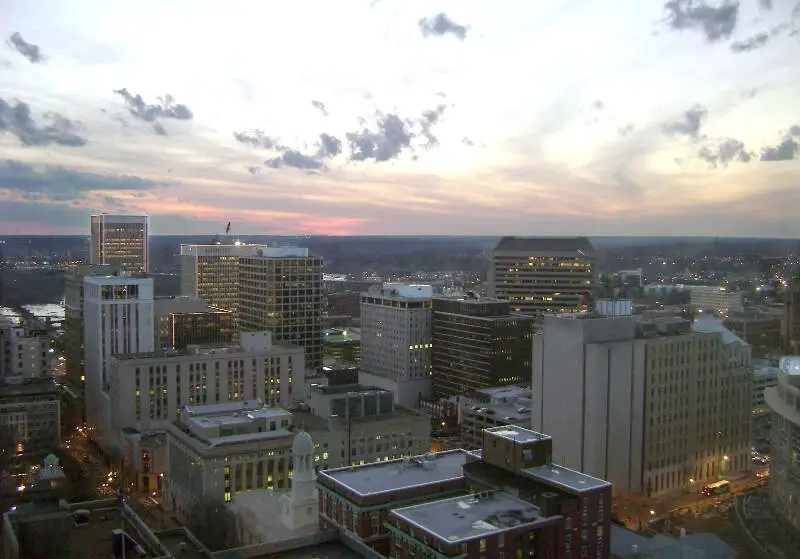
What’s the best part of Richmond?
It could be where everyone knows their neighbor. Or it could be where home prices are the highest, meaning it’s where everyone wants to live.
Instead of relying on public opinion and speculation, we wanted to get the facts straight and find out which neighborhoods in Richmond are the best based on Saturday Night Science.
Whether you live in the sticks or in an apartment building downtown, you want a little pocket that you can call home. And each neighborhood offers different perks and benefits.
Smaller neighborhoods usually have obvious benefits — less crime, a slower pace of life, and a lower cost of living. But not all Richmond neighborhoods are created equal. Some are better than others. But which ones?
If you’re thinking of moving to Virginia and Richmond is on the top of your list, check out the best neighborhoods for 2025.
Table Of Contents: Top Ten | Methodology | Summary | Table
So what’s the best neighborhood to live in Richmond for 2025? According to the most recent census data, Colonial Place looks to be the best Richmond neighborhood to live in.
Read on to see how we determined the places around Richmond that deserve a little bragging rights, or maybe you’re interested in the worst neighborhoods in Richmond.
For more Virginia reading, check out:
The 10 Best Neighborhoods To Live In Richmond
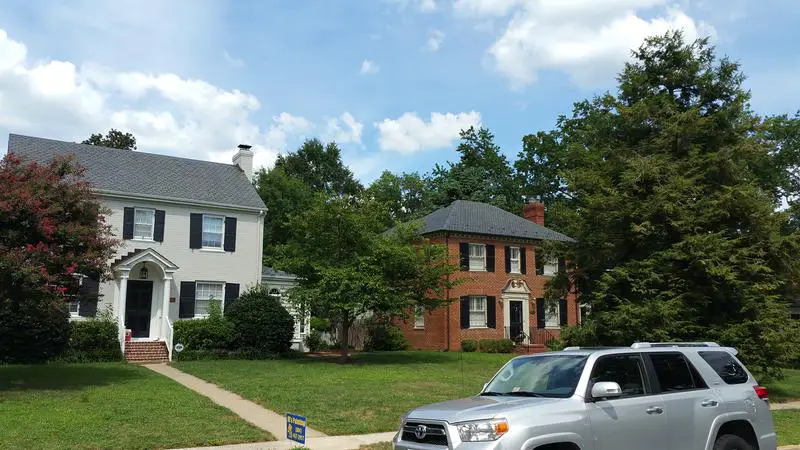
1. Colonial Place
Population: 2,243
Median Home Value: $395,000 (Sixth best)
Median Income: $119,376 (Third best)
More on Colonial Place:
2. Malvern Gardens
Population: 1,414
Median Home Value: $353,200 (15th best)
Median Income: $105,048 (Seventh best)
More on Malvern Gardens:
3. Mary Munford
Population: 1,398
Median Home Value: $405,100 (Fifth best)
Median Income: $95,504 (Ninth best)
More on Mary Munford:
4. The Museum District
Population: 6,669
Median Home Value: $373,171 (11th best)
Median Income: $67,042 (33rd best)
More on The Museum District:
5. Stonewall Court
Population: 829
Median Home Value: $544,600 (best)
Median Income: $159,538 (best)
More on Stonewall Court:
6. Sherwood Park
Population: 815
Median Home Value: $357,600 (14th best)
Median Income: $69,805 (3best)
More on Sherwood Park:
7. Forest Hill
Population: 1,517
Median Home Value: $317,550 (25th best)
Median Income: $119,094 (Fourth best)
More on Forest Hill:
8. Willow Lawn
Population: 895
Median Home Value: $388,733 (Eighth best)
Median Income: $110,913 (Sixth best)
More on Willow Lawn:
9. Huguenot
Population: 2,235
Median Home Value: $277,700 (32nd best)
Median Income: $82,908 (19th best)
More on Huguenot:
10. Three Chopt
Population: 2,348
Median Home Value: $290,300 (29th best)
Median Income: $132,966 (Second best)
More on Three Chopt:
Methodology: How We Determined The Best Richmond, VA Neighborhoods In 2025
To rank the best neighborhoods in Richmond, we had to determine what criteria define “best” and then apply Saturday Night Science to it.
Using FBI crime, Census, and extrapolated BLS data, we arrived at the following set of criteria:
- High incomes
- Low unemployment rates
- Low crime
- High home prices
- High population densities (A proxy for things to do)
We then ranked each neighborhood with scores from 1 to 118 in each category, where 1 was the best.
Next, we averaged the rankings for each neighborhood to create a best neighborhood index.
And finally, we crowned the neighborhood with the lowest best neighborhood index, the “Best City Neighborhood In Richmond.” We’re lookin’ at you, Colonial Place.
Read on below to learn more about what it’s like to live in the best places Richmond, Virginia has to offer. Or skip to the end to see the list of all the neighborhoods in the city, from best to worst.
We updated this article for 2025. This report is our tenth time ranking the best neighborhoods to live in Richmond.
Summary: Putting A Bow On Our Analysis Of The Best Neighborhoods In Richmond
If you’re measuring the neighborhoods in Richmond where crime is low and everyone wants to live, this is an accurate list.
The best neighborhoods in Richmond are Colonial Place, Malvern Gardens, Mary Munford, The Museum District, Stonewall Court, Sherwood Park, Forest Hill, Willow Lawn, Huguenot, and Three Chopt.
As mentioned earlier, the neighborhoods in Richmond aren’t all good. Oak Grove takes the title of the worst neighborhood to live in Richmond.
The worst neighborhoods in Richmond are Oak Grove, Jeff Davis, Washington Park, Creighton, and Oakwood.
We ranked the neighborhoods from best to worst in the chart below.
For more Virginia reading, check out:
Best Neighborhoods To Live In Richmond For 2025 Detailed Data
| Rank | Neighborhood | Population | Home Value | Median Income |
|---|---|---|---|---|
| 1 | Colonial Place | 2,243 | $395,000 | $119,376 |
| 2 | Malvern Gardens | 1,414 | $353,200 | $105,048 |
| 3 | Mary Munford | 1,398 | $405,100 | $95,504 |
| 4 | The Museum District | 6,669 | $373,171 | $67,042 |
| 5 | Stonewall Court | 829 | $544,600 | $159,538 |
| 6 | Sherwood Park | 815 | $357,600 | $69,805 |
| 7 | Forest Hill | 1,517 | $317,550 | $119,094 |
| 8 | Willow Lawn | 895 | $388,733 | $110,913 |
| 9 | Huguenot | 2,235 | $277,700 | $82,908 |
| 10 | Three Chopt | 2,348 | $290,300 | $132,966 |
| 11 | Monument Avenue Park | 582 | $350,000 | $113,984 |
| 12 | The Fan | 13,391 | $522,436 | $75,369 |
| 13 | Church Hill | 3,360 | $389,467 | $61,490 |
| 14 | Carytown | 1,910 | $339,350 | $75,423 |
| 15 | Westover Hills | 1,045 | $176,400 | $93,459 |
| 16 | Sauer’s Gardens | 1,121 | $323,200 | $72,148 |
| 17 | Bellevue | 2,871 | $245,450 | $76,725 |
| 18 | Central Office | 1,263 | $233,900 | $59,115 |
| 19 | Stony Point | 1,024 | $351,300 | $102,296 |
| 20 | Oxford | 1,815 | $310,100 | $87,925 |
| 21 | Chimborazo | 2,026 | $245,920 | $66,724 |
| 22 | Westover Hills West | 906 | $198,800 | $78,500 |
| 23 | Forest Hill Terrace | 1,340 | $290,250 | $92,462 |
| 24 | Willow Oaks | 665 | $248,500 | $77,500 |
| 25 | Stratford Hills | 3,100 | $277,333 | $92,648 |
| 26 | Carillon | 576 | $319,900 | $88,000 |
| 27 | Stadium | 184 | $319,900 | $88,000 |
| 28 | Forest Hill Park | 499 | $346,700 | $94,593 |
| 29 | Shockoe Bottom | 3,068 | $418,250 | $42,467 |
| 30 | Union Hill | 2,361 | $330,550 | $45,902 |
| 31 | Powhite Park | 240 | $227,800 | $59,567 |
| 32 | Southampton | 514 | $372,400 | $95,244 |
| 33 | Scott’s Addition | 1,042 | $296,400 | $41,637 |
| 34 | Ginter Park | 4,013 | $384,340 | $56,370 |
| 35 | Brookland Park | 2,015 | $197,133 | $59,034 |
| 36 | Gravel Hill | 378 | $248,500 | $77,500 |
| 37 | Northern Barton Heights | 2,980 | $210,080 | $62,784 |
| 38 | Cottrell Farms | 1,546 | $146,500 | $44,828 |
| 39 | Woodland Heights | 1,542 | $236,650 | $74,637 |
| 40 | Oregon Hill | 1,269 | $216,850 | $62,628 |
| 41 | Bryan Park | 933 | $287,200 | $37,549 |
| 42 | Ginter Park Terrace | 412 | $240,600 | $63,797 |
| 43 | Randolph | 3,292 | $222,033 | $53,224 |
| 44 | Vcu | 2,990 | $375,000 | $11,250 |
| 45 | Shockoe Slip | 181 | $483,300 | $37,123 |
| 46 | Rosedale | 827 | $190,000 | $69,372 |
| 47 | Church Hill North | 2,128 | $187,217 | $52,930 |
| 48 | Westover | 2,934 | $147,150 | $53,316 |
| 49 | Edgewood | 692 | $154,200 | $57,994 |
| 50 | Cedarhurst | 2,564 | $199,200 | $57,467 |
| 51 | Maymont Park | 200 | $243,650 | $72,534 |
| 52 | Museums | 255 | $213,400 | $44,853 |
| 53 | The Diamond | 1,271 | $213,400 | $62,876 |
| 54 | Newtowne West | 175 | $213,400 | $44,853 |
| 55 | Walmsley | 1,963 | $159,300 | $39,548 |
| 56 | Byrd Park | 1,608 | $270,933 | $66,915 |
| 57 | Worthington | 1,102 | $148,700 | $65,096 |
| 58 | Woodhaven | 1,954 | $127,500 | $50,417 |
| 59 | Forest View | 864 | $252,300 | $80,785 |
| 60 | Northrop | 1,330 | $292,100 | $39,570 |
| 61 | Westlake Hills | 1,355 | $203,833 | $49,905 |
| 62 | British Camp Farms | 1,122 | $141,300 | $53,892 |
| 63 | Virginia Union | 1,768 | $212,000 | $65,447 |
| 64 | John Marshall | 998 | $369,500 | $32,896 |
| 65 | Oakwood Cemetery | 1,432 | $92,150 | $42,558 |
| 66 | Southern Barton Heights | 1,279 | $179,367 | $56,312 |
| 67 | Swanson | 1,398 | $139,000 | $52,321 |
| 68 | Providence Park | 1,235 | $131,050 | $46,259 |
| 69 | Chamberlayne Industrial Center | 1,417 | $186,350 | $59,069 |
| 70 | Chippenham Forest | 905 | $324,600 | $55,224 |
| 71 | Jackson Ward | 2,352 | $242,367 | $37,191 |
| 72 | Swansboro West | 2,617 | $95,100 | $43,084 |
| 73 | Warwick | 817 | $139,000 | $52,321 |
| 74 | Pocoshock | 643 | $139,000 | $52,321 |
| 75 | Hollywood Cemetery | 492 | $167,400 | $57,068 |
| 76 | Hickory Hill | 1,534 | $142,300 | $49,574 |
| 77 | Swansboro | 2,160 | $178,875 | $53,623 |
| 78 | Mcguire Manor | 1,312 | $134,900 | $48,079 |
| 79 | Cullenwood | 376 | $121,300 | $87,594 |
| 80 | Piney Knolls | 2,615 | $148,950 | $35,860 |
| 81 | City Center | 626 | $248,100 | $44,023 |
| 82 | Broad Rock Industrial Park | 1,460 | $122,300 | $51,217 |
| 83 | North Highland Park | 3,834 | $111,300 | $34,250 |
| 84 | Belle And Mayo Islands | 331 | $228,300 | $50,928 |
| 85 | Blackwell | 2,084 | $129,367 | $47,319 |
| 86 | Eastview | 3,400 | $79,450 | $19,804 |
| 87 | Fulton | 5,842 | $149,367 | $33,831 |
| 88 | Deerbourne | 802 | $134,900 | $61,894 |
| 89 | Jahnke | 2,495 | $180,400 | $37,448 |
| 90 | Bellemeade | 3,285 | $116,367 | $39,448 |
| 91 | Fairmount | 1,144 | $138,800 | $30,570 |
| 92 | Upper Shockoe Valley | 2,348 | $92,500 | $32,168 |
| 93 | Hillside Court | 789 | $115,400 | $30,125 |
| 94 | Belt Center | 1,034 | $133,900 | $64,814 |
| 95 | Biotech And Mcv District | 413 | $185,600 | $57,188 |
| 96 | Mcguire | 836 | $111,100 | $72,002 |
| 97 | Broad Rock Sports Complex | 488 | $148,300 | $31,217 |
| 98 | Carver | 2,277 | $210,000 | $38,732 |
| 99 | South Garden | 2,342 | $148,950 | $32,796 |
| 100 | Parnell Industrial Area | 1,324 | $140,300 | $53,706 |
| 101 | Old Town Manchester | 1,438 | $81,500 | $46,999 |
| 102 | Highland Park Southern Tip | 1,846 | $142,900 | $39,033 |
| 103 | Magnolia Industrial Center | 246 | $96,800 | $34,950 |
| 104 | Whitcomb | 2,820 | $95,467 | $20,537 |
| 105 | Highland Terrace | 793 | $107,800 | $36,396 |
| 106 | Pine Camp | 451 | $120,200 | $26,711 |
| 107 | Davee Gardens | 26 | $72,700 | $33,125 |
| 108 | Maymont | 208 | $167,400 | $57,068 |
| 109 | Green Park | 822 | $107,100 | $32,837 |
| 110 | Midlothian | 3,810 | $133,420 | $46,643 |
| 111 | Woodville | 700 | $107,733 | $32,500 |
| 112 | Peter Paul | 743 | $107,733 | $32,500 |
| 113 | Fairfield | 1,249 | $85,400 | $17,624 |
| 114 | Oakwood | 470 | $92,150 | $42,558 |
| 115 | Creighton | 856 | $85,400 | $17,672 |
| 116 | Washington Park | 601 | $120,200 | $26,711 |
| 117 | Jeff Davis | 2,749 | $122,300 | $27,597 |
| 118 | Oak Grove | 1,692 | $95,850 | $32,138 |


