Compare Richmond to…
Richmond SnackAbility
Overall SnackAbility
Crime in Richmond summary. We use data from the FBI to determine the crime rates in Richmond. Key points include:
There were 8,151 total crimes in Richmond in the last reporting year.
The overall crime rate per 100,000 people in Richmond is 3,516.3 / 100k people.
The violent crime rate per 100,000 people in Richmond is 336.9 / 100k people.
The property crime rate per 100,000 people in Richmond is 3,179.4 / 100k people.
Overall, crime in Richmond is 65.92% above the national average.
Total Crimes
Above National Average
Crime In Richmond Comparison Table
| Statistic | Count Raw |
Richmond / 100k People |
Virginia / 100k People |
National / 100k People |
|---|---|---|---|---|
| Total Crimes Per 100K | 8,151 | 3,516.3 | 1,787.6 | 2,119.2 |
| Violent Crime | 781 | 336.9 | 217.9 | 359.0 |
| Murder | 56 | 24.2 | 4.8 | 5.0 |
| Robbery | 219 | 94.5 | 33.1 | 61.0 |
| Aggravated Assault | 463 | 199.7 | 152.2 | 256.0 |
| Property Crime | 7,370 | 3,179.4 | 1,569.7 | 1,760.0 |
| Burglary | 615 | 265.3 | 108.7 | 229.0 |
| Larceny | 5,533 | 2,386.9 | 1,315.9 | 1,272.0 |
| Car Theft | 1,222 | 527.2 | 145.1 | 259.0 |
Source: FBI Uniform Crime Reporting (2024)
Cost of living in Richmond summary. We use data on the cost of living to determine how expensive it is to live in Richmond. Real estate prices drive most of the variance in cost of living around Virginia. Key points include:
The cost of living in Richmond is 112 with 100 being average.
The cost of living in Richmond is 1.1x higher than the national average.
The median home value in Richmond is $369,645.
The median income in Richmond is $64,587.
Richmond's Overall Cost Of Living
Higher Than The National Average
Cost Of Living In Richmond Comparison Table
| Living Expense | Richmond | Virginia | National Average |
|---|---|---|---|
| Overall | 112 | 112 | 100 |
| Services | 106 | 103 | 100 |
| Groceries | 103 | 104 | 100 |
| Health | 131 | 131 | 100 |
| Housing | 105 | 105 | 100 |
| Transportation | 102 | 105 | 100 |
| Utilities | 111 | 104 | 100 |
Source: Cost of living index, normalized to US average = 100
Richmond, VA Weather
The average high in Richmond is 69.0° and the average low is 45.9°.
There are 73.7 days of precipitation each year.
Expect an average of 44.2 inches of precipitation each year with 11.6 inches of snow.
| Stat | Richmond |
|---|---|
| Average Annual High | 69.0 |
| Average Annual Low | 45.9 |
| Annual Precipitation Days | 73.7 |
| Average Annual Precipitation | 44.2 |
| Average Annual Snowfall | 11.6 |
Average High
Days of Rain
Source: NOAA climate normals (30-year)
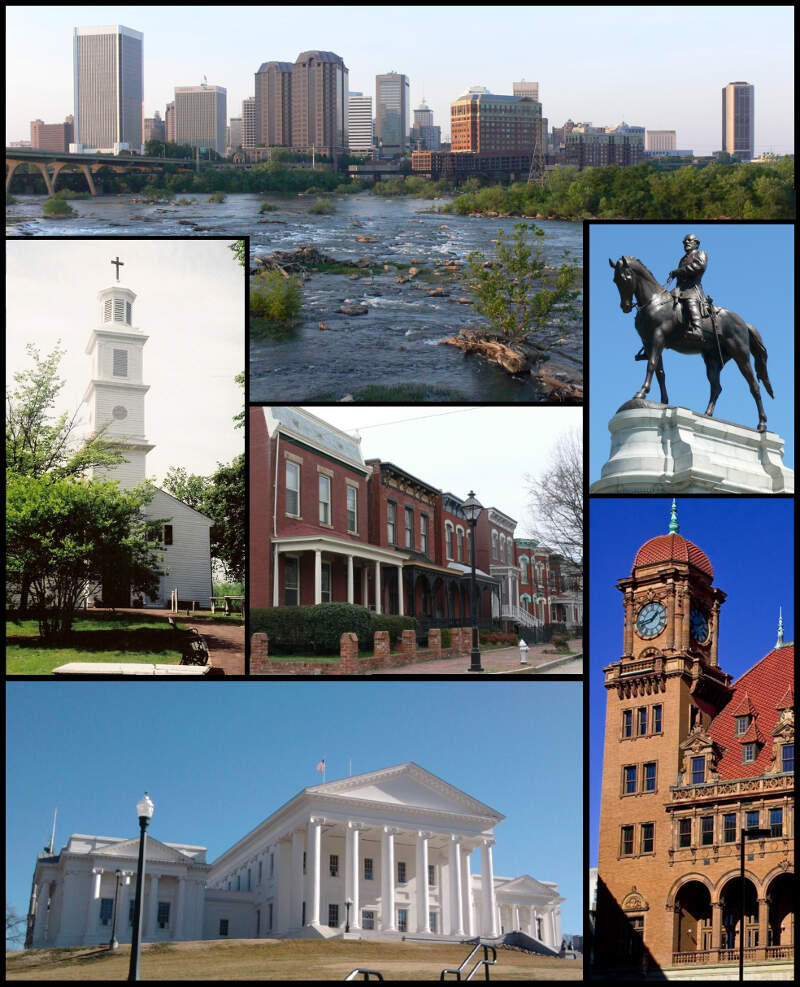
Richmond, VA Photos


4 Reviews & Comments About Richmond

What about Richmond---- I lived in Richmond for 3 years and it's a lot of thugs that live out there
Currently, the crime rate is fairly low. I think the schools are great. I love the river and parks in the area. There are also a lot of food options in the city! I can eat in a new restaurant every day of the week and not duplicate any for about 6 months. With that being said, I still have two favorites that I go to at least once a week.
I highly recommend a sandwich called the cheese colombo at Coppola's in Carytown. It's an adult grilled cheese with pepper, onion, and artichoke. Three kinds of cheese are fried directly on the griddle so they get melty and gooey in the middle, but really crispy and almost burnt on the outside. That helps the bun not get too soggy when the marinated veggies are added. It's perfection.
Vienna are you kidding me-- I agree with the other person. I don't think you have visited some of these places. I lived there for a long time. I live in Richmond now. But Vienna is not s****y. And what about the rest of Virginia---
I live in Richmond,va. and with all that goes around this city, I do liv in a fairly nice part just west of the downtown. I also, being a photographer and musician as well, have been able to visit the small towns and backroads which are beautiful places and the people in these towns I have met through travels are very nice...
Rankings & Articles For Richmond


Locations Around Richmond
Map Of Richmond, VA
Best Places Around Richmond
Wyndham, VA
Population 12,099
Woodlake, VA
Population 7,358
Short Pump, VA
Population 29,026
Chamberlayne, VA
Population 4,692
Mechanicsville, VA
Population 38,683
Rockwood, VA
Population 10,010
Glen Allen, VA
Population 17,551
Innsbrook, VA
Population 8,578
Bon Air, VA
Population 16,904
Brandermill, VA
Population 13,730
Richmond Demographics And Statistics
Population over time in Richmond
The current population in Richmond is 229,359. The population has increased 13.6% from 2010.
| Year | Population | % Change |
|---|---|---|
| 2024 | 229,359 | 0.8% |
| 2023 | 227,595 | 0.2% |
| 2022 | 227,171 | 0.7% |
| 2021 | 225,676 | -1.6% |
| 2020 | 229,233 | 1.2% |
| 2019 | 226,622 | 1.3% |
| 2018 | 223,787 | 1.3% |
| 2017 | 220,892 | 1.9% |
| 2016 | 216,773 | 1.4% |
| 2015 | 213,735 | 1.3% |
| 2014 | 211,063 | 1.5% |
| 2013 | 207,878 | 1.2% |
| 2012 | 205,348 | 1.1% |
| 2011 | 203,165 | 0.7% |
| 2010 | 201,828 | - |
Race / Ethnicity in Richmond
See the full breakdown
Richmond is:
41.4% White with 94,895 White residents.
40.6% African American with 93,026 African American residents.
0.1% American Indian with 244 American Indian residents.
2.1% Asian with 4,775 Asian residents.
0.0% Hawaiian with 114 Hawaiian residents.
0.5% Other with 1,157 Other residents.
4.6% Two Or More with 10,609 Two Or More residents.
10.7% Hispanic with 24,539 Hispanic residents.
| Race | Richmond | VA | USA |
|---|---|---|---|
| White | 41.4% | 58.4% | 57.4% |
| African American | 40.6% | 18.3% | 11.9% |
| American Indian | 0.1% | 0.1% | 0.5% |
| Asian | 2.1% | 6.9% | 5.9% |
| Hawaiian | 0.0% | 0.1% | 0.2% |
| Other | 0.5% | 0.6% | 0.6% |
| Two Or More | 4.6% | 4.7% | 4.3% |
| Hispanic | 10.7% | 11.0% | 19.3% |
Gender in Richmond
See the full breakdown
Richmond is 52.6% female with 120,591 female residents.
Richmond is 47.4% male with 108,768 male residents.
| Gender | Richmond | VA | USA |
|---|---|---|---|
| Female | 52.6% | 50.6% | 50.5% |
| Male | 47.4% | 49.4% | 49.5% |
Highest level of educational attainment in Richmond for adults over 25
See the full breakdown
4.0% of adults in Richmond completed < 9th grade.
6.0% of adults in Richmond completed 9-12th grade.
21.0% of adults in Richmond completed high school / ged.
18.0% of adults in Richmond completed some college.
5.0% of adults in Richmond completed associate's degree.
27.0% of adults in Richmond completed bachelor's degree.
13.0% of adults in Richmond completed master's degree.
4.0% of adults in Richmond completed professional degree.
2.0% of adults in Richmond completed doctorate degree.
| Education | Richmond | VA | USA |
|---|---|---|---|
| < 9th Grade | 4.0% | 2.0% | 4.0% |
| 9-12th Grade | 6.0% | 5.0% | 6.0% |
| High School / GED | 21.0% | 24.0% | 26.0% |
| Some College | 18.0% | 18.0% | 19.0% |
| Associate's Degree | 5.0% | 8.0% | 9.0% |
| Bachelor's Degree | 27.0% | 24.0% | 22.0% |
| Master's Degree | 13.0% | 14.0% | 10.0% |
| Professional Degree | 4.0% | 3.0% | 2.0% |
| Doctorate Degree | 2.0% | 2.0% | 2.0% |
Household Income For Richmond, Virginia
See the full breakdown
7.3% of households in Richmond earn Less than $10,000.
5.0% of households in Richmond earn $10,000 to $14,999.
7.9% of households in Richmond earn $15,000 to $24,999.
7.5% of households in Richmond earn $25,000 to $34,999.
12.0% of households in Richmond earn $35,000 to $49,999.
17.0% of households in Richmond earn $50,000 to $74,999.
12.2% of households in Richmond earn $75,000 to $99,999.
12.9% of households in Richmond earn $100,000 to $149,999.
7.7% of households in Richmond earn $150,000 to $199,999.
10.4% of households in Richmond earn $200,000 or more.
| Income | Richmond | VA | USA |
|---|---|---|---|
| Less than $10,000 | 7.3% | 4.2% | 5.0% |
| $10,000 to $14,999 | 5.0% | 2.7% | 3.4% |
| $15,000 to $24,999 | 7.9% | 5.2% | 6.3% |
| $25,000 to $34,999 | 7.5% | 5.7% | 6.6% |
| $35,000 to $49,999 | 12.0% | 8.8% | 10.1% |
| $50,000 to $74,999 | 17.0% | 14.3% | 15.5% |
| $75,000 to $99,999 | 12.2% | 12.1% | 12.6% |
| $100,000 to $149,999 | 12.9% | 18.1% | 17.5% |
| $150,000 to $199,999 | 7.7% | 11.1% | 9.6% |
| $200,000 or more | 10.4% | 17.7% | 13.4% |
Source: U.S. Census ACS 5-year estimates (2024)


