100 Biggest Cities In Virginia For 2023
Using the latest Census data, we detail the 100 biggest cities in Virginia. You can all see a comprehensive list of all 353 cities and places in Virginia.

We all love the biggest cities that the Old Dominion has to offer. You know the places like Virginia Beach and Chesapeake which make all the headlines.
But there are a bunch of other great large cities in Virginia that don't get as much love.
We're going to change that right now.
Using the most recent Census data, we can tell you about all the places in Virginia with a focus on the biggest. We update the data each year and this is our fourth time doing this.
Table Of Contents: Top Ten | Methodology | Table
The Largest Cities In Virginia For 2023:
You can click here to see a full table of the full of the 100 biggest cities in Virginia, along with every other place over 1,000 people big. It is sortable by clicking on the headers.
Read on below to see more on the biggest cities. Or for more reading on places to live in Virginia, check out:
- Best Places To Live In Virginia
- Cheapest Places To Live In Virginia
- Most Dangerous Cities In Virginia
The 10 Biggest Cities In Virginia
/10
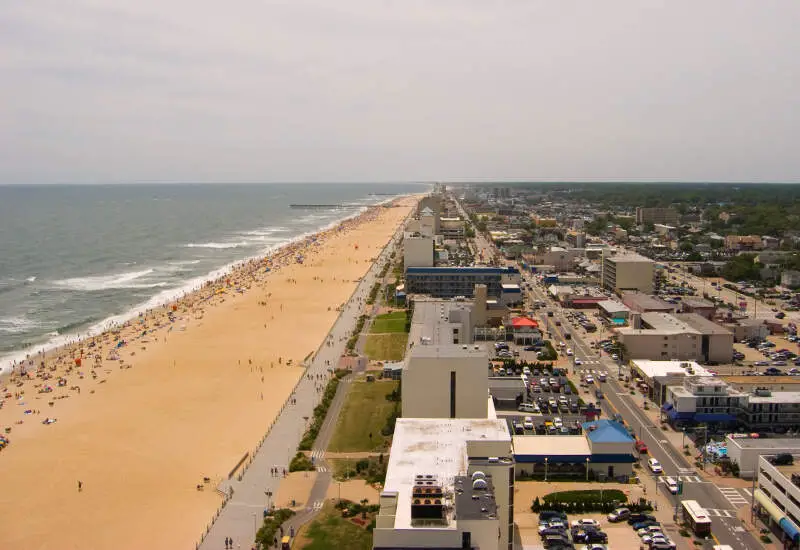
Rank Last Year: 1 (No Change)
Population: 457,658
Population 2010: 435,996
Growth: 5.0%
More on Virginia Beach: Data | Crime | Cost Of Living | Real Estate
/10
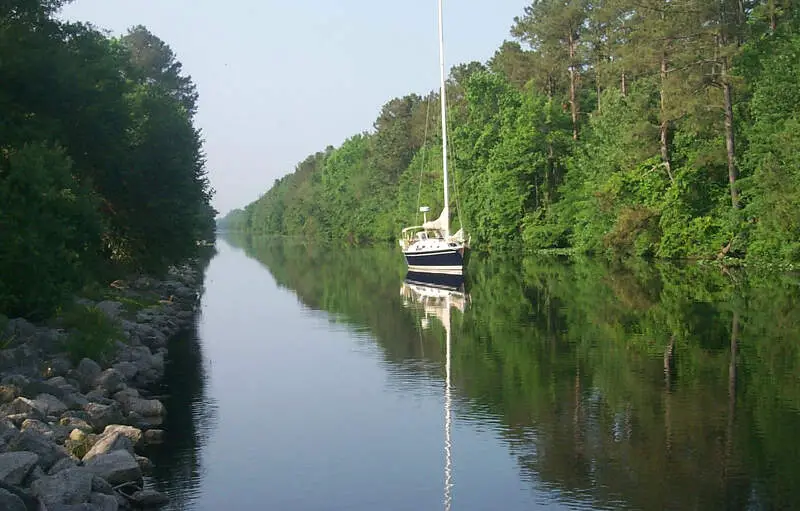
Rank Last Year: 3 (Up 1)
Population: 247,172
Population 2010: 219,268
Growth: 12.7%
More on Chesapeake: Data | Crime | Cost Of Living | Real Estate
/10
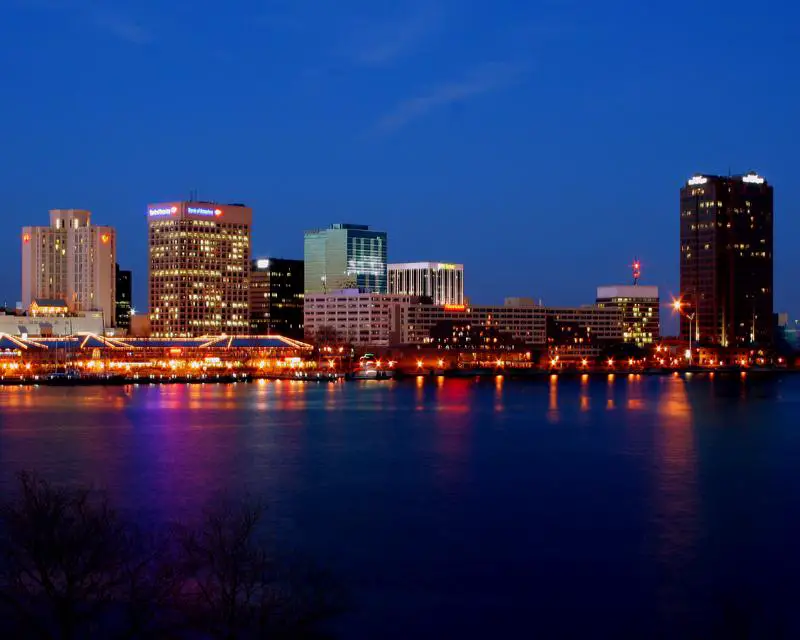
Rank Last Year: 2 (Down 1)
Population: 238,556
Population 2010: 242,143
Growth: -1.5%
More on Norfolk: Data | Crime | Cost Of Living | Real Estate
/10
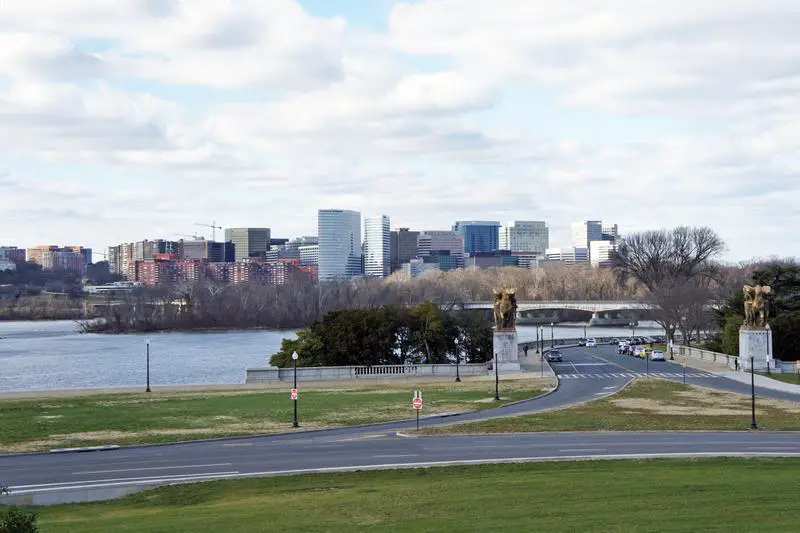
Rank Last Year: 4 (No Change)
Population: 235,764
Population 2010: 197,467
Growth: 19.4%
More on Arlington: Data | Cost Of Living | Real Estate
/10
Rank Last Year: 5 (No Change)
Population: 225,676
Population 2010: 201,828
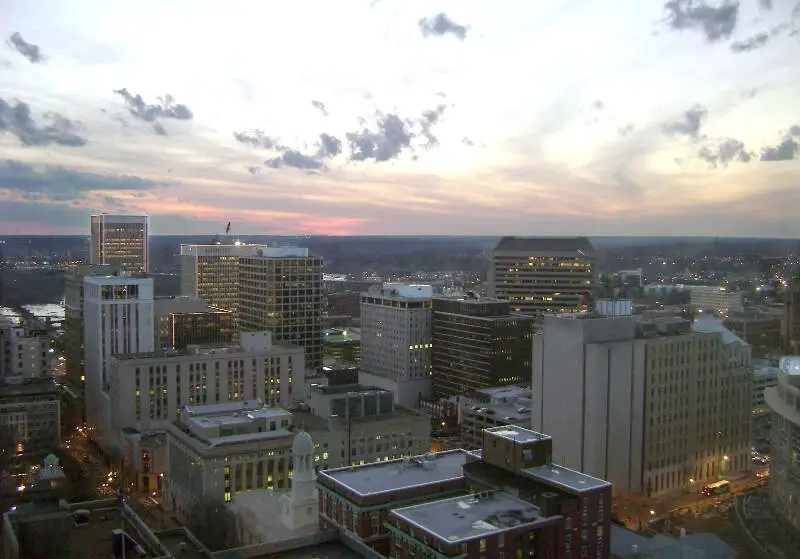
Growth: 11.8%
More on Richmond: Data | Crime | Cost Of Living | Real Estate
/10
Rank Last Year: 6 (No Change)
Population: 185,069
Population 2010: 181,822
Growth: 1.8%
More on Newport News: Data | Crime | Cost Of Living | Real Estate
/10
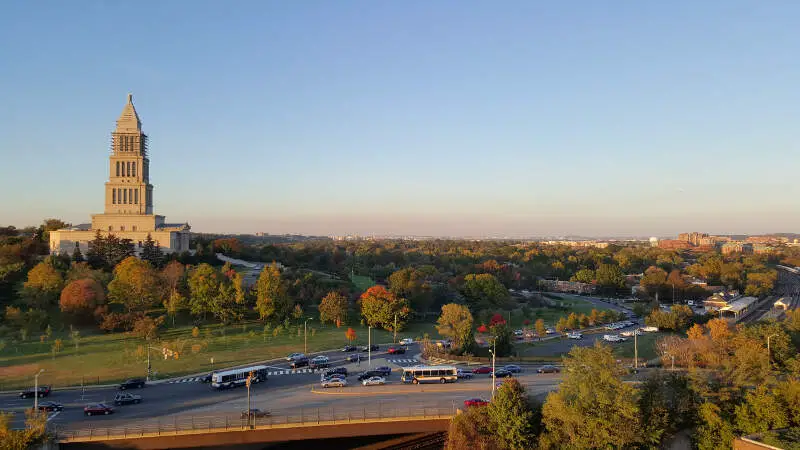
Rank Last Year: 7 (No Change)
Population: 158,185
Population 2010: 133,647
Growth: 18.4%
More on Alexandria: Data | Crime | Cost Of Living | Real Estate
/10
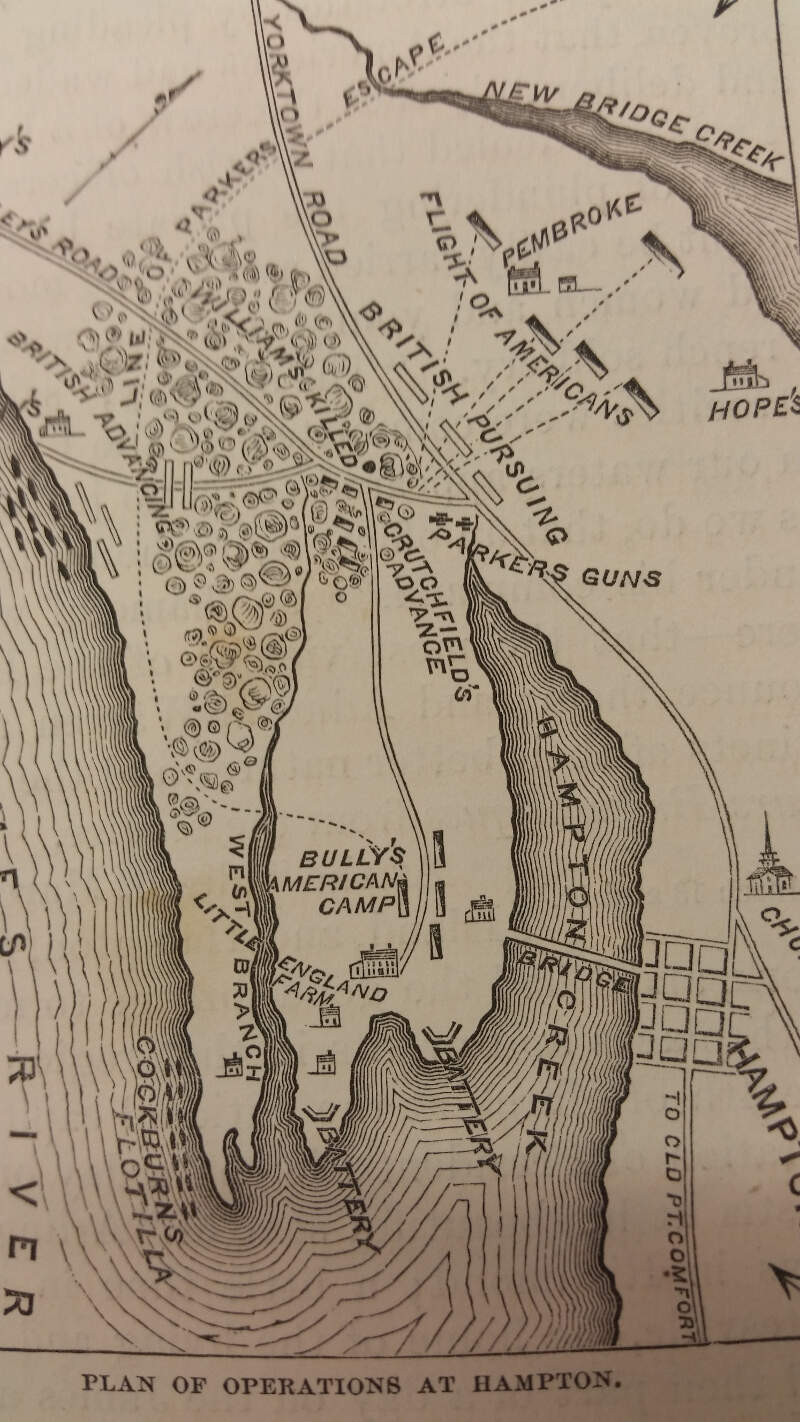
Rank Last Year: 8 (No Change)
Population: 136,748
Population 2010: 139,046
Growth: -1.7%
More on Hampton: Data | Crime | Cost Of Living | Real Estate
/10
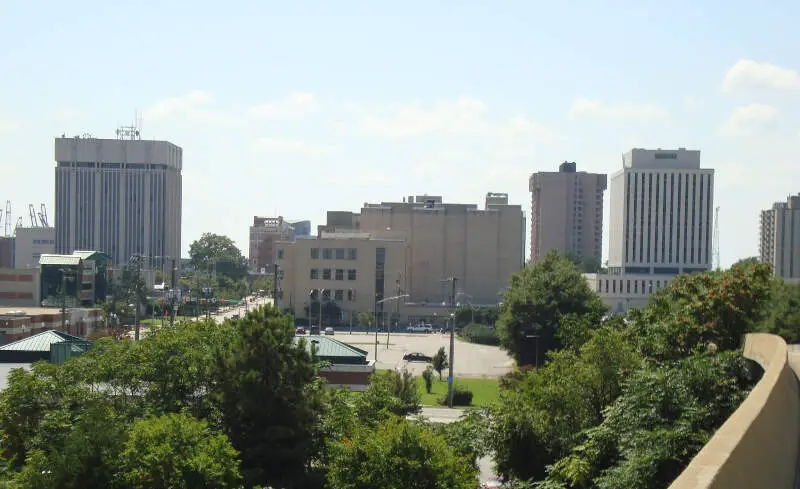
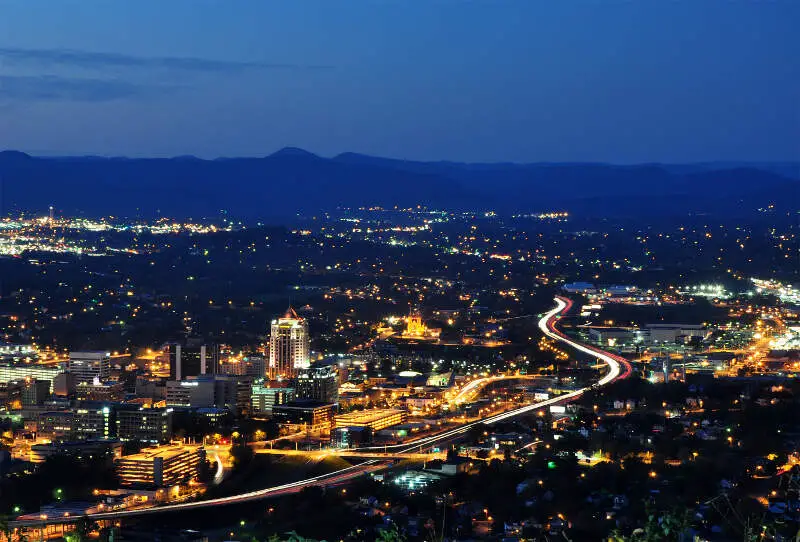
Rank Last Year: 9 (No Change)
Population: 99,578
Population 2010: 95,793
Growth: 4.0%
More on Roanoke: Data | Crime | Cost Of Living | Real Estate
/10
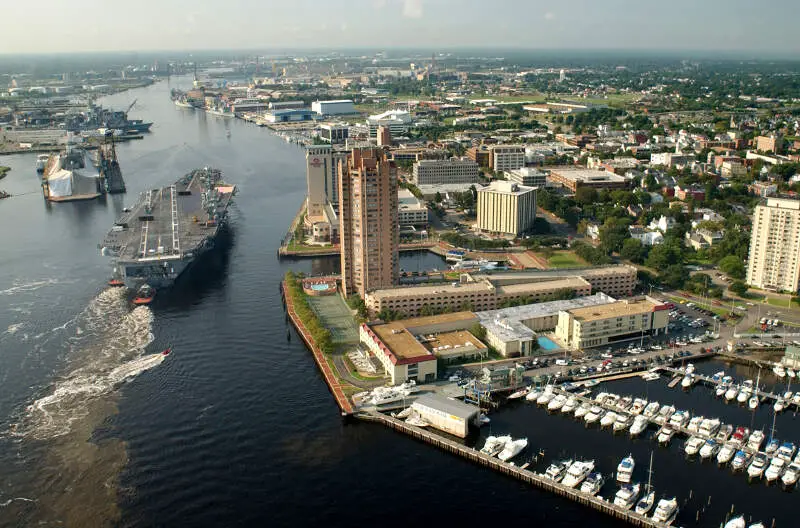
Rank Last Year: 10 (No Change)
Population: 97,454
Population 2010: 96,785
Growth: 0.7%
More on Portsmouth: Data | Crime | Cost Of Living | Real Estate
How We Determined The Largest Cities In Virginia
We've been ranking and dissecting cities in the Old Dominion for over 4 years now -- making this actually the fourth time we've run the numbers. We always use the best data, the US Census. In this case, that means we are using the American Community Survey.
It what is probably the most simple analysis we run each year, we ranked every place in Virginia from biggest to smallest. The biggest city this year? That would be Virginia Beach.
The smallest? Amelia Court House, although there are places smaller than 1,000 people not listed here, so keep that in mind as we take a look at the top ten.
Now on to numbers 11-100 Biggest in Virginia
We hope that you find the big city, or really any city, that's right for you. Below is a list of the rest of the biggest cities along with every other place in Virginia.
Have fun snacking around in the Old Dominion!
For more reading on Virginia, check out:
- Best Places To Raise A Family In Virginia
- Best Places To Retire In Virginia
- Richest Cities In Virginia
- Safest Places In Virginia
- Worst Cities In Virginia For 2017
- Most Expensive Places To Live In Virginia
Detailed List Of The Biggest Cities In Virginia
| Rank | City | Current Population | 2010 | Growth | |||||
|---|---|---|---|---|---|---|---|---|---|
| 1 | Virginia Beach | 457,658 | 435,996 | 5.0% | |||||
| 2 | Chesapeake | 247,172 | 219,268 | 12.7% | |||||
| 3 | Norfolk | 238,556 | 242,143 | -1.5% | |||||
| 4 | Arlington | 235,764 | 197,467 | 19.4% | |||||
| 5 | Richmond | 225,676 | 201,828 | 11.8% | |||||
| 6 | Newport News | 185,069 | 181,822 | 1.8% | |||||
| 7 | Alexandria | 158,185 | 133,647 | 18.4% | |||||
| 8 | Hampton | 136,748 | 139,046 | -1.7% | |||||
| 9 | Roanoke | 99,578 | 95,793 | 4.0% | |||||
| 10 | Portsmouth | 97,454 | 96,785 | 0.7% | |||||
| 11 | Suffolk | 93,268 | 82,544 | 13.0% | |||||
| 12 | Lynchburg | 78,973 | 73,726 | 7.1% | |||||
| 13 | Dale City | 73,716 | 63,625 | 15.9% | |||||
| 14 | Centreville | 73,064 | 72,406 | 0.9% | |||||
| 15 | Reston | 62,453 | 53,257 | 17.3% | |||||
| 16 | Harrisonburg | 52,062 | 47,406 | 9.8% | |||||
| 17 | Mclean | 49,310 | 46,132 | 6.9% | |||||
| 18 | Leesburg | 48,223 | 40,713 | 18.4% | |||||
| 19 | Tuckahoe | 48,187 | 45,174 | 6.7% | |||||
| 20 | Charlottesville | 46,597 | 42,267 | 10.2% | |||||
| 21 | Ashburn | 44,950 | 42,369 | 6.1% | |||||
| 22 | Lake Ridge | 44,697 | 39,421 | 13.4% | |||||
| 23 | Blacksburg | 44,385 | 42,149 | 5.3% | |||||
| 24 | Burke | 44,191 | 41,472 | 6.6% | |||||
| 25 | Woodbridge | 42,734 | 3,984 | 972.6% | |||||
| 26 | Manassas | 42,596 | 36,067 | 18.1% | |||||
| 27 | Danville | 42,556 | 43,787 | -2.8% | |||||
| 28 | Linton Hall | 42,089 | 33,458 | 25.8% | |||||
| 29 | Annandale | 41,869 | 38,439 | 8.9% | |||||
| 30 | Mechanicsville | 37,767 | 35,628 | 6.0% | |||||
| 31 | Oakton | 36,675 | 33,518 | 9.4% | |||||
| 32 | Fair Oaks | 34,437 | 27,539 | 25.0% | |||||
| 33 | South Riding | 33,828 | 22,982 | 47.2% | |||||
| 34 | Petersburg | 33,229 | 32,303 | 2.9% | |||||
| 35 | Springfield | 31,769 | 30,548 | 4.0% | |||||
| 36 | Sterling | 31,202 | 25,516 | 22.3% | |||||
| 37 | West Falls Church | 31,023 | 27,608 | 12.4% | |||||
| 38 | Winchester | 28,194 | 25,953 | 8.6% | |||||
| 39 | Fredericksburg | 28,027 | 23,375 | 19.9% | |||||
| 40 | Short Pump | 27,332 | 24,035 | 13.7% | |||||
| 41 | Staunton | 25,358 | 23,806 | 6.5% | |||||
| 42 | Salem | 25,335 | 24,641 | 2.8% | |||||
| 43 | Cave Spring | 25,248 | 25,539 | -1.1% | |||||
| 44 | Herndon | 24,574 | 22,726 | 8.1% | |||||
| 45 | Bailey's Crossroads | 24,501 | 20,855 | 17.5% | |||||
| 46 | Fairfax | 23,980 | 22,058 | 8.7% | |||||
| 47 | Chantilly | 23,564 | 22,120 | 6.5% | |||||
| 48 | West Springfield | 23,562 | 22,272 | 5.8% | |||||
| 49 | Christiansburg | 23,174 | 20,288 | 14.2% | |||||
| 50 | Hopewell | 23,020 | 22,506 | 2.3% | |||||
| 51 | Chester | 22,512 | 19,918 | 13.0% | |||||
| 52 | Waynesboro | 22,149 | 20,885 | 6.1% | |||||
| 53 | Cherry Hill | 22,118 | 15,511 | 42.6% | |||||
| 54 | Brambleton | 21,986 | 8,595 | 155.8% | |||||
| 55 | Montclair | 21,961 | 19,360 | 13.4% | |||||
| 56 | Lorton | 21,394 | 19,262 | 11.1% | |||||
| 57 | Mcnair | 20,980 | 15,213 | 37.9% | |||||
| 58 | Lincolnia | 20,704 | 20,646 | 0.3% | |||||
| 59 | Culpeper | 19,740 | 15,607 | 26.5% | |||||
| 60 | Meadowbrook | 19,574 | 19,293 | 1.5% | |||||
| 61 | Merrifield | 19,075 | 14,264 | 33.7% | |||||
| 62 | Franklin Farm | 18,906 | 19,531 | -3.2% | |||||
| 63 | Buckhall | 18,751 | 15,351 | 22.1% | |||||
| 64 | Sudley | 18,613 | 15,283 | 21.8% | |||||
| 65 | Hybla Valley | 18,410 | 14,617 | 25.9% | |||||
| 66 | Kingstowne | 18,369 | 14,513 | 26.6% | |||||
| 67 | Franconia | 18,310 | 18,451 | -0.8% | |||||
| 68 | Colonial Heights | 18,127 | 17,472 | 3.7% | |||||
| 69 | Burke Centre | 18,113 | 16,975 | 6.7% | |||||
| 70 | Laurel | 17,962 | 16,101 | 11.6% | |||||
| 71 | Bon Air | 17,846 | 15,865 | 12.5% | |||||
| 72 | Idylwood | 17,687 | 15,676 | 12.8% | |||||
| 73 | Manassas Park | 17,081 | 13,195 | 29.5% | |||||
| 74 | Gainesville | 17,081 | 10,793 | 58.3% | |||||
| 75 | Bristol | 16,996 | 17,704 | -4.0% | |||||
| 76 | East Highland Park | 16,669 | 14,037 | 18.8% | |||||
| 77 | Vienna | 16,465 | 15,387 | 7.0% | |||||
| 78 | Wolf Trap | 16,394 | 16,680 | -1.7% | |||||
| 79 | Fort Hunt | 16,322 | 15,944 | 2.4% | |||||
| 80 | Radford | 16,205 | 16,318 | -0.7% | |||||
| 81 | Hollins | 15,857 | 14,923 | 6.3% | |||||
| 82 | Stone Ridge | 15,776 | 6,029 | 161.7% | |||||
| 83 | Williamsburg | 15,299 | 13,421 | 14.0% | |||||
| 84 | Front Royal | 15,039 | 14,508 | 3.7% | |||||
| 85 | Broadlands | 14,835 | 10,702 | 38.6% | |||||
| 86 | Highland Springs | 14,823 | 16,332 | -9.2% | |||||
| 87 | Glen Allen | 14,783 | 15,580 | -5.1% | |||||
| 88 | Great Falls | 14,690 | 15,925 | -7.8% | |||||
| 89 | Falls Church | 14,494 | 11,465 | 26.4% | |||||
| 90 | Groveton | 14,402 | 13,634 | 5.6% | |||||
| 91 | Huntington | 13,979 | 10,359 | 34.9% | |||||
| 92 | Kings Park West | 13,812 | 14,384 | -4.0% | |||||
| 93 | Brandermill | 13,745 | 12,569 | 9.4% | |||||
| 94 | Mount Vernon | 13,707 | 11,753 | 16.6% | |||||
| 95 | Martinsville | 13,476 | 14,029 | -3.9% | |||||
| 96 | Newington | 13,419 | 13,212 | 1.6% | |||||
| 97 | Lansdowne | 13,029 | 9,823 | 32.6% | |||||
| 98 | Timberlake | 12,972 | 14,067 | -7.8% | |||||
| 99 | Sugarland Run | 12,928 | 10,920 | 18.4% | |||||
| 100 | Lakeside | 12,690 | 12,001 | 5.7% | |||||
| 101 | Newington Forest | 12,641 | 13,114 | -3.6% | |||||
| 102 | Cascades | 12,509 | 12,051 | 3.8% | |||||
| 103 | Poquoson | 12,382 | 12,099 | 2.3% | |||||
| 104 | Fairfax Station | 12,322 | 11,708 | 5.2% | |||||
| 105 | Manchester | 12,192 | 11,073 | 10.1% | |||||
| 106 | Wyndham | 12,143 | 9,346 | 29.9% | |||||
| 107 | Stuarts Draft | 11,954 | 7,540 | 58.5% | |||||
| 108 | Dranesville | 11,951 | 12,553 | -4.8% | |||||
| 109 | Wakefield | 11,534 | 11,553 | -0.2% | |||||
| 110 | New Baltimore | 11,517 | 7,854 | 46.6% | |||||
| 111 | Gloucester Point | 11,313 | 10,406 | 8.7% | |||||
| 112 | Lowes Island | 11,272 | 11,390 | -1.0% | |||||
| 113 | Forest | 11,045 | 9,116 | 21.2% | |||||
| 114 | Triangle | 10,868 | 7,693 | 41.3% | |||||
| 115 | Madison Heights | 10,790 | 11,036 | -2.2% | |||||
| 116 | Lake Barcroft | 10,682 | 9,061 | 17.9% | |||||
| 117 | Loudoun Valley Estates | 10,460 | 2,401 | 335.7% | |||||
| 118 | Lake Monticello | 10,438 | 10,634 | -1.8% | |||||
| 119 | Woodburn | 10,168 | 8,707 | 16.8% | |||||
| 120 | Yorkshire | 10,033 | 6,800 | 47.5% | |||||
| 121 | Warrenton | 10,002 | 9,245 | 8.2% | |||||
| 122 | George Mason | 9,927 | 8,877 | 11.8% | |||||
| 123 | Independent Hill | 9,855 | 7,313 | 34.8% | |||||
| 124 | Belmont | 9,589 | 5,267 | 82.1% | |||||
| 125 | University Of Virginia | 9,384 | 6,994 | 34.2% | |||||
| 126 | Countryside | 9,384 | 9,562 | -1.9% | |||||
| 127 | Dunn Loring | 9,251 | 9,249 | 0.0% | |||||
| 128 | Seven Corners | 9,191 | 8,333 | 10.3% | |||||
| 129 | Pulaski | 8,984 | 9,180 | -2.1% | |||||
| 130 | Innsbrook | 8,966 | 7,319 | 22.5% | |||||
| 131 | Purcellville | 8,910 | 7,102 | 25.5% | |||||
| 132 | Fishersville | 8,909 | 6,675 | 33.5% | |||||
| 133 | Fair Lakes | 8,689 | 7,960 | 9.2% | |||||
| 134 | Hollymead | 8,668 | 8,026 | 8.0% | |||||
| 135 | Lake Of The Woods | 8,557 | 7,825 | 9.4% | |||||
| 136 | Smithfield | 8,513 | 7,869 | 8.2% | |||||
| 137 | Dumbarton | 8,443 | 6,686 | 26.3% | |||||
| 138 | Laurel Hill | 8,415 | 6,056 | 39.0% | |||||
| 139 | Abingdon | 8,350 | 8,128 | 2.7% | |||||
| 140 | Wytheville | 8,260 | 8,163 | 1.2% | |||||
| 141 | Franklin | 8,249 | 8,549 | -3.5% | |||||
| 142 | Bellwood | 8,138 | 5,573 | 46.0% | |||||
| 143 | Vinton | 8,039 | 8,074 | -0.4% | |||||
| 144 | South Boston | 8,011 | 8,202 | -2.3% | |||||
| 145 | Greenbriar | 7,914 | 7,672 | 3.2% | |||||
| 146 | Rockwood | 7,880 | 7,839 | 0.5% | |||||
| 147 | Fort Belvoir | 7,850 | 6,288 | 24.8% | |||||
| 148 | Crozet | 7,840 | 5,175 | 51.5% | |||||
| 149 | Mantua | 7,771 | 7,514 | 3.4% | |||||
| 150 | Long Branch | 7,734 | 7,943 | -2.6% | |||||
| 151 | Montrose | 7,612 | 7,182 | 6.0% | |||||
| 152 | Floris | 7,592 | 8,141 | -6.7% | |||||
| 153 | Collinsville | 7,529 | 7,106 | 6.0% | |||||
| 154 | Ashland | 7,478 | 7,225 | 3.5% | |||||
| 155 | Woodlake | 7,398 | 7,906 | -6.4% | |||||
| 156 | North Springfield | 7,323 | 7,283 | 0.5% | |||||
| 157 | Lexington | 7,287 | 6,990 | 4.2% | |||||
| 158 | Farmville | 7,266 | 8,417 | -13.7% | |||||
| 159 | Carrollton | 7,171 | 4,137 | 73.3% | |||||
| 160 | Sandston | 7,083 | 7,673 | -7.7% | |||||
| 161 | Strasburg | 7,036 | 6,081 | 15.7% | |||||
| 162 | South Run | 6,953 | 6,729 | 3.3% | |||||
| 163 | Potomac Mills | 6,759 | 4,715 | 43.4% | |||||
| 164 | Galax | 6,681 | 6,936 | -3.7% | |||||
| 165 | Buena Vista | 6,649 | 6,653 | -0.1% | |||||
| 166 | Belle Haven | 6,434 | 6,559 | -1.9% | |||||
| 167 | Fort Lee | 6,271 | 6,099 | 2.8% | |||||
| 168 | Aquia Harbour | 6,161 | 6,478 | -4.9% | |||||
| 169 | Pimmit Hills | 6,150 | 6,235 | -1.4% | |||||
| 170 | Massanetta Springs | 6,132 | 4,286 | 43.1% | |||||
| 171 | Bridgewater | 6,092 | 5,581 | 9.2% | |||||
| 172 | Bensley | 5,945 | 5,179 | 14.8% | |||||
| 173 | Marion | 5,817 | 6,032 | -3.6% | |||||
| 174 | Emporia | 5,761 | 5,822 | -1.0% | |||||
| 175 | Covington | 5,716 | 5,989 | -4.6% | |||||
| 176 | Woodstock | 5,716 | 4,994 | 14.5% | |||||
| 177 | Quantico Base | 5,683 | 6,004 | -5.3% | |||||
| 178 | Dumfries | 5,669 | 4,947 | 14.6% | |||||
| 179 | Dulles Town Center | 5,612 | 3,884 | 44.5% | |||||
| 180 | Spotsylvania Courthouse | 5,548 | 3,972 | 39.7% | |||||
| 181 | Richlands | 5,300 | 5,927 | -10.6% | |||||
| 182 | Big Stone Gap | 5,280 | 5,435 | -2.9% | |||||
| 183 | Ettrick | 5,169 | 5,892 | -12.3% | |||||
| 184 | Bluefield | 5,079 | 5,425 | -6.4% | |||||
| 185 | Chamberlayne | 5,069 | 5,741 | -11.7% | |||||
| 186 | Crosspointe | 5,049 | 5,624 | -10.2% | |||||
| 187 | Orange | 5,012 | 4,723 | 6.1% | |||||
| 188 | Stafford Courthouse | 4,910 | 4,064 | 20.8% | |||||
| 189 | Rocky Mount | 4,863 | 4,798 | 1.4% | |||||
| 190 | Luray | 4,784 | 4,938 | -3.1% | |||||
| 191 | King George | 4,657 | 3,613 | 28.9% | |||||
| 192 | South Hill | 4,636 | 4,650 | -0.3% | |||||
| 193 | Bethel Manor | 4,607 | 4,068 | 13.2% | |||||
| 194 | Falmouth | 4,536 | 4,012 | 13.1% | |||||
| 195 | Berryville | 4,494 | 4,032 | 11.5% | |||||
| 196 | Tazewell | 4,459 | 4,661 | -4.3% | |||||
| 197 | Enon | 4,411 | 3,225 | 36.8% | |||||
| 198 | Verona | 4,410 | 4,511 | -2.2% | |||||
| 199 | Hayfield | 4,348 | 3,848 | 13.0% | |||||
| 200 | Pantops | 4,288 | 2,287 | 87.5% | |||||
| 201 | Mount Hermon | 4,242 | 3,940 | 7.7% | |||||
| 202 | Kings Park | 4,194 | 4,664 | -10.1% | |||||
| 203 | University Center | 4,176 | 3,240 | 28.9% | |||||
| 204 | Loch Lomond | 4,153 | 3,536 | 17.4% | |||||
| 205 | Broadway | 4,152 | 3,440 | 20.7% | |||||
| 206 | Bealeton | 4,043 | 3,907 | 3.5% | |||||
| 207 | Colonial Beach | 3,838 | 3,465 | 10.8% | |||||
| 208 | Lake Land'or | 3,726 | 3,618 | 3.0% | |||||
| 209 | Norton | 3,696 | 3,886 | -4.9% | |||||
| 210 | Clifton Forge | 3,549 | 3,946 | -10.1% | |||||
| 211 | Cloverdale | 3,483 | 2,954 | 17.9% | |||||
| 212 | Shenandoah Farms | 3,463 | 2,772 | 24.9% | |||||
| 213 | Dahlgren | 3,448 | 2,345 | 47.0% | |||||
| 214 | Blackstone | 3,402 | 3,626 | -6.2% | |||||
| 215 | Altavista | 3,396 | 3,435 | -1.1% | |||||
| 216 | West Point | 3,364 | 3,236 | 4.0% | |||||
| 217 | Chincoteague | 3,285 | 3,183 | 3.2% | |||||
| 218 | Gloucester Courthouse | 3,198 | 2,555 | 25.2% | |||||
| 219 | North Shore | 3,188 | 2,652 | 20.2% | |||||
| 220 | Southern Gateway | 3,163 | 3,522 | -10.2% | |||||
| 221 | Lebanon | 3,158 | 3,448 | -8.4% | |||||
| 222 | Marshall | 3,114 | 1,541 | 102.1% | |||||
| 223 | Blue Ridge | 3,078 | 3,220 | -4.4% | |||||
| 224 | Daleville | 2,979 | 2,020 | 47.5% | |||||
| 225 | Wise | 2,976 | 3,324 | -10.5% | |||||
| 226 | Timberville | 2,943 | 2,448 | 20.2% | |||||
| 227 | Lake Wilderness | 2,940 | 2,338 | 25.7% | |||||
| 228 | Elkton | 2,938 | 2,742 | 7.1% | |||||
| 229 | Grottoes | 2,886 | 2,569 | 12.3% | |||||
| 230 | Pearisburg | 2,878 | 2,778 | 3.6% | |||||
| 231 | Hillsville | 2,863 | 2,723 | 5.1% | |||||
| 232 | Crewe | 2,853 | 2,592 | 10.1% | |||||
| 233 | Shenandoah | 2,837 | 2,423 | 17.1% | |||||
| 234 | Windsor | 2,759 | 2,595 | 6.3% | |||||
| 235 | Waverly | 2,696 | 2,965 | -9.1% | |||||
| 236 | Merrimac | 2,663 | 2,093 | 27.2% | |||||
| 237 | Dublin | 2,633 | 2,517 | 4.6% | |||||
| 238 | Lovettsville | 2,608 | 1,202 | 117.0% | |||||
| 239 | Fairlawn | 2,553 | 2,204 | 15.8% | |||||
| 240 | Amherst | 2,504 | 2,471 | 1.3% | |||||
| 241 | Oak Grove | 2,500 | 1,695 | 47.5% | |||||
| 242 | Chase City | 2,478 | 2,606 | -4.9% | |||||
| 243 | Matoaca | 2,440 | 2,413 | 1.1% | |||||
| 244 | Ravensworth | 2,370 | 2,562 | -7.5% | |||||
| 245 | Shawneeland | 2,366 | 2,460 | -3.8% | |||||
| 246 | Lake Holiday | 2,324 | 1,932 | 20.3% | |||||
| 247 | Stephens City | 2,308 | 1,708 | 35.1% | |||||
| 248 | New Market | 2,281 | 2,247 | 1.5% | |||||
| 249 | Warsaw | 2,281 | 1,117 | 104.2% | |||||
| 250 | Arcola | 2,258 | 13 | 17269.2% | |||||
| 251 | Saltville | 2,225 | 2,227 | -0.1% | |||||
| 252 | Appomattox | 2,214 | 1,995 | 11.0% | |||||
| 253 | Massanutten | 2,184 | 1,973 | 10.7% | |||||
| 254 | Weyers Cave | 2,167 | 2,071 | 4.6% | |||||
| 255 | Crimora | 2,159 | 2,216 | -2.6% | |||||
| 256 | Patrick Springs | 2,151 | 1,593 | 35.0% | |||||
| 257 | Raven | 2,133 | 2,950 | -27.7% | |||||
| 258 | Narrows | 2,099 | 2,617 | -19.8% | |||||
| 259 | Pennington Gap | 2,079 | 2,657 | -21.8% | |||||
| 260 | Glade Spring | 2,068 | 1,764 | 17.2% | |||||
| 261 | Chilhowie | 2,060 | 2,180 | -5.5% | |||||
| 262 | Mount Jackson | 2,041 | 1,912 | 6.7% | |||||
| 263 | Stanley | 2,029 | 1,897 | 7.0% | |||||
| 264 | Victoria | 2,022 | 1,403 | 44.1% | |||||
| 265 | Horse Pasture | 2,006 | 2,175 | -7.8% | |||||
| 266 | Louisa | 1,999 | 1,629 | 22.7% | |||||
| 267 | Rivanna | 1,954 | 1,732 | 12.8% | |||||
| 268 | Tappahannock | 1,945 | 2,323 | -16.3% | |||||
| 269 | Rustburg | 1,944 | 665 | 192.3% | |||||
| 270 | Piney Mountain | 1,916 | 1,342 | 42.8% | |||||
| 271 | Gate City | 1,908 | 2,927 | -34.8% | |||||
| 272 | Mason Neck | 1,903 | 2,245 | -15.2% | |||||
| 273 | East Lexington | 1,893 | 949 | 99.5% | |||||
| 274 | Courtland | 1,872 | 1,045 | 79.1% | |||||
| 275 | Hampden-Sydney | 1,840 | 1,271 | 44.8% | |||||
| 276 | Ferrum | 1,832 | 1,632 | 12.3% | |||||
| 277 | Gordonsville | 1,783 | 2,000 | -10.9% | |||||
| 278 | Laymantown | 1,770 | 2,886 | -38.7% | |||||
| 279 | Bull Run Mountain Estates | 1,732 | 931 | 86.0% | |||||
| 280 | Prince George | 1,707 | 1,950 | -12.5% | |||||
| 281 | Westlake Corner | 1,691 | 929 | 82.0% | |||||
| 282 | Lyndhurst | 1,654 | 1,032 | 60.3% | |||||
| 283 | Adwolf | 1,646 | 1,751 | -6.0% | |||||
| 284 | Halifax | 1,645 | 1,219 | 34.9% | |||||
| 285 | Exmore | 1,635 | 1,401 | 16.7% | |||||
| 286 | Shawsville | 1,628 | 1,526 | 6.7% | |||||
| 287 | Dayton | 1,615 | 1,659 | -2.7% | |||||
| 288 | Coeburn | 1,615 | 2,035 | -20.6% | |||||
| 289 | Middl | 1,608 | 1,245 | 29.2% | |||||
| 290 | Boswell's Corner | 1,580 | 1,490 | 6.0% | |||||
| 291 | Chatham | 1,558 | 1,166 | 33.6% | |||||
| 292 | Haymarket | 1,556 | 1,520 | 2.4% | |||||
| 293 | Weber City | 1,554 | 1,839 | -15.5% | |||||
| 294 | Twin Lakes | 1,552 | 2,111 | -26.5% | |||||
| 295 | Clarksville | 1,542 | 1,220 | 26.4% | |||||
| 296 | Rural Retreat | 1,518 | 1,527 | -0.6% | |||||
| 297 | Bowling Green | 1,494 | 992 | 50.6% | |||||
| 298 | Greenville | 1,476 | 737 | 100.3% | |||||
| 299 | Appalachia | 1,472 | 1,557 | -5.5% | |||||
| 300 | Cana | 1,469 | 1,335 | 10.0% | |||||
| 301 | Lake Caroline | 1,454 | 1,981 | -26.6% | |||||
| 302 | Hurt | 1,452 | 1,418 | 2.4% | |||||
| 303 | Glasgow | 1,437 | 994 | 44.6% | |||||
| 304 | Stuart | 1,431 | 1,488 | -3.8% | |||||
| 305 | Nokesville | 1,431 | 1,352 | 5.8% | |||||
| 306 | Kilmarnock | 1,424 | 1,558 | -8.6% | |||||
| 307 | Mountain Road | 1,423 | 1,085 | 31.2% | |||||
| 308 | Edinburg | 1,414 | 990 | 42.8% | |||||
| 309 | Apple Mountain Lake | 1,413 | 977 | 44.6% | |||||
| 310 | Captains Cove | 1,408 | 449 | 213.6% | |||||
| 311 | Central Garage | 1,401 | 964 | 45.3% | |||||
| 312 | Clintwood | 1,379 | 1,627 | -15.2% | |||||
| 313 | Brightwood | 1,359 | 875 | 55.3% | |||||
| 314 | Nellysford | 1,337 | 799 | 67.3% | |||||
| 315 | Penhook | 1,337 | 521 | 156.6% | |||||
| 316 | Lawrenceville | 1,334 | 1,978 | -32.6% | |||||
| 317 | Ruckersville | 1,325 | 1,118 | 18.5% | |||||
| 318 | Riner | 1,322 | 625 | 111.5% | |||||
| 319 | Basye | 1,318 | 879 | 49.9% | |||||
| 320 | Jonesville | 1,313 | 1,360 | -3.5% | |||||
| 321 | Gretna | 1,310 | 1,440 | -9.0% | |||||
| 322 | Onancock | 1,291 | 1,585 | -18.5% | |||||
| 323 | Kenbridge | 1,281 | 1,193 | 7.4% | |||||
| 324 | Belmont Estates | 1,257 | 1,283 | -2.0% | |||||
| 325 | Ridgeway | 1,252 | 804 | 55.7% | |||||
| 326 | Castlewood | 1,238 | 2,029 | -39.0% | |||||
| 327 | Springville | 1,223 | 1,120 | 9.2% | |||||
| 328 | Chatmoss | 1,214 | 1,691 | -28.2% | |||||
| 329 | Honaker | 1,207 | 1,996 | -39.5% | |||||
| 330 | Passapatanzy | 1,201 | 1,126 | 6.7% | |||||
| 331 | Dooms | 1,191 | 1,131 | 5.3% | |||||
| 332 | Claypool Hill | 1,169 | 1,923 | -39.2% | |||||
| 333 | Cedar Bluff | 1,159 | 1,173 | -1.2% | |||||
| 334 | Buchanan | 1,147 | 1,350 | -15.0% | |||||
| 335 | Independence | 1,146 | 1,305 | -12.2% | |||||
| 336 | Elliston | 1,141 | 1,077 | 5.9% | |||||
| 337 | Stanleytown | 1,139 | 1,287 | -11.5% | |||||
| 338 | St. Paul | 1,134 | 997 | 13.7% | |||||
| 339 | Cape Charles | 1,134 | 1,112 | 2.0% | |||||
| 340 | Grundy | 1,112 | 908 | 22.5% | |||||
| 341 | Occoquan | 1,112 | 582 | 91.1% | |||||
| 342 | Atkins | 1,090 | 1,118 | -2.5% | |||||
| 343 | Union Hall | 1,081 | 1,464 | -26.2% | |||||
| 344 | Pembroke | 1,064 | 1,371 | -22.4% | |||||
| 345 | Brookneal | 1,064 | 1,073 | -0.8% | |||||
| 346 | Mathews | 1,052 | 785 | 34.0% | |||||
| 347 | Bassett | 1,045 | 913 | 14.5% | |||||
| 348 | Emory | 1,025 | 1,246 | -17.7% | |||||
| 349 | Chester Gap | 1,021 | 962 | 6.1% | |||||
| 350 | Gratton | 1,009 | 644 | 56.7% | |||||
| 351 | Prices Fork | 1,009 | 1,220 | -17.3% | |||||
| 352 | Concord | 1,005 | 919 | 9.4% | |||||
| 353 | Amelia Court House | 1,004 | 1,660 | -39.5% | |||||