
Suppose real estate is the most significant investment a majority of people make in their lifetime. In that case, it’s best to understand the places in Texas with best potential return on investment.
After working in real estate adjacent roles for over a decade, I had the hypothesis that the best place to buy for a return on investment would be up-and-coming cities. Smaller cities where crime might be high now, but people still move to.
To test my hypothesis, we are going to look at places in Texas that are growing faster than average, but where home prices are below average, and crime rates are higher than average.
In everyday terms, these might be “deals”. The best deal in Texas at the moment according to Saturday Night Science? That would be Josephine.
Table Of Contents: Top Ten | Methodology | Summary | Table
The 10 Best Places To Buy A Home In Texas For 2026
- Josephine
- Northlake
- Lavon
- Mabank
- Nassau Bay
- Venus
- Justin
- Van Alstyne
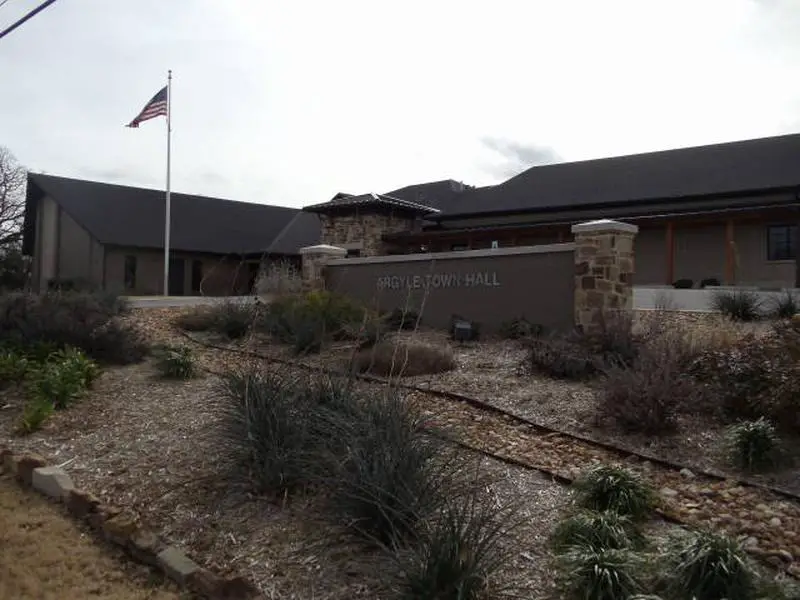
- Argyle
- Alvarado
The methodology that wen’t into this can be a bit complicated, so we’ll break it down for you in as much detail as we can below.
For more Texas reading:
- Best Counties To Live In Texas
- Best Places To Raise A Family In Texas
- Best Places To Retire In Texas
The 10 Best Cities To Buy A House In Texas For 2026
1. Josephine
/10
Population: 5,842
Median Home Price: $287,282
Population Change: 29.9%
Home Price Change: 2.1%
More on Josephine: Crime | Movers
/10
/10
4. Mabank
/10
Population: 5,187
Median Home Price: $274,128
Population Change: 15.8%
Home Price Change: -1.1%
More on Mabank: Movers
/10
6. Venus
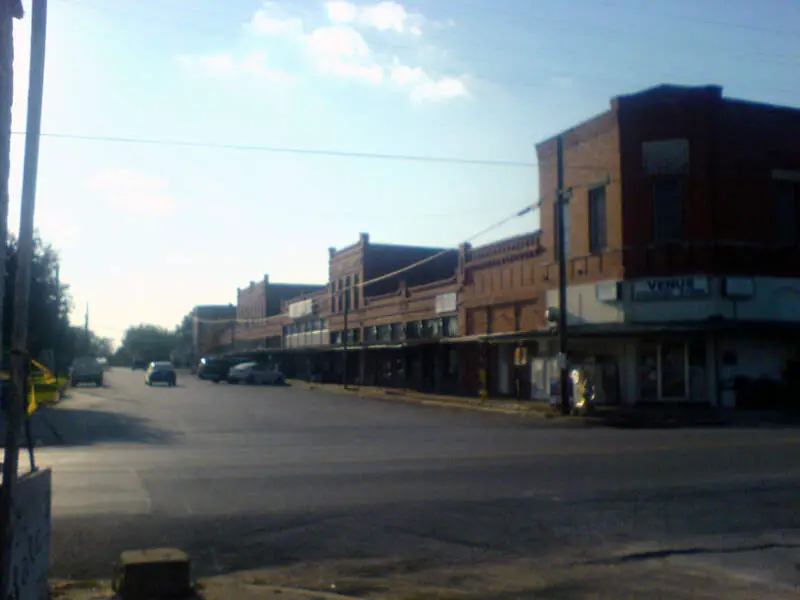
/10
Population: 6,745
Median Home Price: $321,977
Population Change: 14.8%
Home Price Change: 2.1%
More on Venus: Crime | Movers
/10
Population: 5,447
Median Home Price: $371,850
Population Change: 7.5%
Home Price Change: 1.1%
More on Justin: Data | Movers
8. Van Alstyne
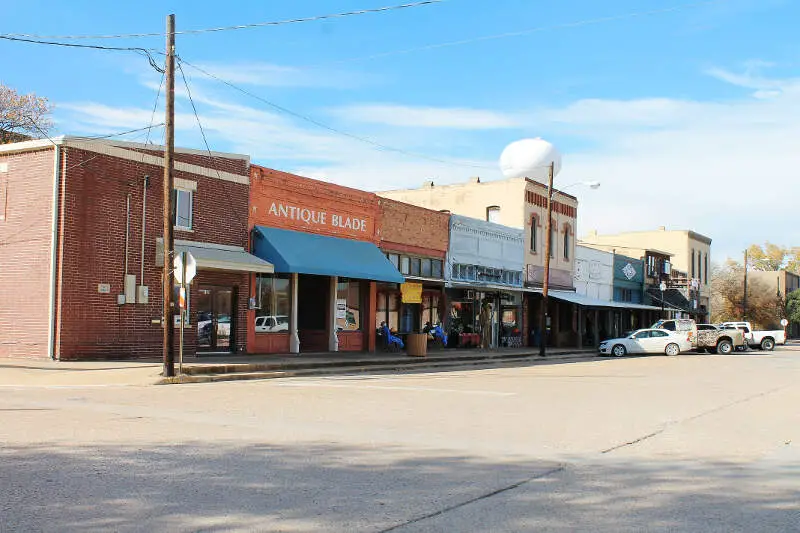
/10
Population: 5,952
Median Home Price: $433,827
Population Change: 10.7%
Home Price Change: 0.1%
More on Van Alstyne: Crime | Movers
/10
10. Alvarado
/10
Population: 6,307
Median Home Price: $305,899
Population Change: 16.3%
Home Price Change: 2.5%
More on Alvarado: Crime | Movers
Methodology: How do you determine the best places to buy a home in Texas for 2026?
We were in real estate for almost five years and have worked on this site for another 11. Suffice it to say we’ve put a lot of thought into finding an excellent place to buy a home.
So all that thinking has come to this moment where we get to spell out how we’d approach finding an up-and-coming place to live in Texas. Put differently, the analysis will try to find places in Texas with undervalued homes relative to pent-up demand using Saturday Night Science.
To do that, we looked at the most recent American Community Survey Census data for 2020-2024 and compared it to the previous vintage. Specifically, we used the following criteria:
- Y-o-Y Change In Population (People want to live here)
- Y-o-Y Change In Median Home Prices (People are willing to pay for it)
- Home Prices Relative To The State Average (It’s still kinda cheap)
We want places that are growing, have seen home prices increase in recent years, and are still “cheap” for Texas with the following caveats:
- Home prices had to be within 20% of the state average (Much lower than that, and you get to some of the more dangerous places)
- Home prices increased in the last year, and
- Above 5,000 people (Bigger cities have more data points)
So of the 0 cities and towns in Texas, only 372 places made it through our initial filters to even be considered.
We then ranked each place from 1 to 372 for the above criteria, with 1 being the best. We averaged the rankings to create a “best place to buy” index, with the place having the lowest index being the best.
Turns out that Josephine is the best potential gem in the not-so-rough in the Lone Star State.
Summary: The Best Places To Purchase A House In Texas for 2026
There’s our analysis of the best places to buy a house in Texas. And, to be clear, we aren’t necessarily saying these places are the best places to live, just that it looks like they might be in a couple of years based on the data.
In fact, every place in the following table meets our criteria, so even though it may not look super long, remember we started off with all 0 places in the state.
The best cities to buy a house in Texas are Josephine, Northlake, Lavon, Mabank, Nassau Bay, Venus, Justin, Van Alstyne, Argyle, and Alvarado.
So if we’d could rent or buy in these cities, we’d definitely buy.
For more Texas reading, check out:
Best Places To Buy A Home In Texas
| Rank | City | Population | Median Home Price | Population Change | Home Price Increase |
|---|---|---|---|---|---|
| 1 | Josephine | 5,842 | $287,282 | 29.9% | 2.1% |
| 2 | Northlake | 8,283 | $497,060 | 16.0% | 0.6% |
| 3 | Lavon | 6,498 | $349,797 | 15.5% | -0.9% |
| 4 | Mabank | 5,187 | $274,128 | 15.8% | -1.1% |
| 5 | Nassau Bay | 5,230 | $397,246 | 0.4% | 2.0% |
| 6 | Venus | 6,745 | $321,977 | 14.8% | 2.1% |
| 7 | Justin | 5,447 | $371,850 | 7.5% | 1.1% |
| 8 | Van Alstyne | 5,952 | $433,827 | 10.7% | 0.1% |
| 9 | Argyle | 5,371 | $594,341 | 8.1% | 0.2% |
| 10 | Alvarado | 6,307 | $305,899 | 16.3% | 2.5% |
| 11 | Aubrey | 7,396 | $363,613 | 11.4% | -1.2% |
| 12 | Pilot Point | 5,332 | $329,619 | 10.4% | -4.8% |
| 13 | Liberty Hill | 8,371 | $485,095 | 24.8% | 2.0% |
| 14 | Wilmer | 6,391 | $226,032 | 8.8% | 8.3% |
| 15 | Hickory Creek | 5,611 | $494,276 | 8.7% | -0.7% |
| 16 | Mineola | 5,068 | $267,345 | 2.3% | -1.4% |
| 17 | Aledo | 5,825 | $537,267 | 7.2% | -1.6% |
| 18 | Parker | 5,999 | $1,088,169 | 3.9% | 0.9% |
| 19 | Dripping Springs | 7,405 | $689,079 | 17.1% | 0.2% |
| 20 | Primera | 5,344 | $170,627 | 1.2% | 1.0% |
| 21 | Hudson | 5,104 | $182,080 | 1.7% | -6.1% |
| 22 | Bowie | 5,770 | $239,905 | 2.7% | -3.9% |
| 23 | Oak Point | 5,887 | $419,834 | 9.1% | -0.6% |
| 24 | Krum | 6,189 | $338,247 | 5.0% | -0.3% |
| 25 | Giddings | 5,151 | $295,834 | 1.3% | 0.0% |
| 26 | Wolfforth | 6,701 | $268,400 | 8.3% | 1.3% |
| 27 | Gilmer | 5,025 | $239,436 | 1.4% | -0.6% |
| 28 | Granite Shoals | 5,328 | $358,051 | 1.5% | 0.6% |
| 29 | Livingston | 5,718 | $197,158 | -0.2% | 0.3% |
| 30 | Center | 5,271 | $198,362 | 1.4% | -5.1% |
| 31 | Mcgregor | 5,761 | $235,103 | 2.7% | 40.3% |
| 32 | Bulverde | 6,486 | $476,431 | 5.2% | 2.3% |
| 33 | Brady | 5,230 | $115,851 | 0.3% | 4.6% |
| 34 | Iowa Colony | 12,891 | $339,031 | 16.9% | -1.8% |
| 35 | Sinton | 5,584 | $161,876 | 1.3% | 8.2% |
| 36 | Terrell Hills | 5,070 | $883,660 | 0.4% | 0.1% |
| 37 | Breckenridge | 5,170 | $136,982 | -0.2% | 1.8% |
| 38 | Atlanta | 5,439 | $163,217 | 0.1% | 3.0% |
| 39 | Cameron | 5,416 | $254,327 | 0.6% | 4.9% |
| 40 | Rockdale | 5,523 | $241,930 | 1.2% | 3.3% |
| 41 | Muleshoe | 5,667 | $144,581 | 6.4% | 2.1% |
| 42 | Willow Park | 5,874 | $407,700 | 7.8% | -1.2% |
| 43 | Sansom Park | 5,392 | $200,626 | 0.1% | 5.8% |
| 44 | Rusk | 5,477 | $207,435 | 2.7% | -1.0% |
| 45 | Brookshire | 5,495 | $348,438 | 3.1% | -1.0% |
| 46 | Marlin | 5,516 | $91,227 | 0.3% | -7.0% |
| 47 | Wake Village | 5,867 | $202,775 | -0.3% | 1.4% |
| 48 | Edna | 6,027 | $212,347 | 0.6% | -2.8% |
| 49 | Nolanville | 6,690 | $311,056 | 5.0% | 0.1% |
| 50 | Yoakum | 5,846 | $214,801 | 3.5% | 1.1% |
| 51 | Hutchins | 7,496 | $249,516 | 31.2% | 3.5% |
| 52 | Luling | 5,531 | $225,021 | 0.8% | 1.2% |
| 53 | Windcrest | 5,820 | $309,778 | 0.1% | 0.1% |
| 54 | Littlefield | 5,822 | $109,264 | -1.1% | 8.2% |
| 55 | Slaton | 5,761 | $140,026 | -0.9% | 7.5% |
| 56 | Gladewater | 6,227 | $166,926 | -1.1% | 2.8% |
| 57 | Alpine | 6,014 | $254,370 | 0.2% | 1.5% |
| 58 | Penitas | 6,444 | $172,285 | 1.4% | 8.1% |
| 59 | Childress | 5,834 | $120,183 | -2.2% | 9.0% |
| 60 | Gun Barrel City | 6,570 | $245,837 | 2.5% | -2.4% |
| 61 | Mont Belvieu | 9,020 | $439,307 | 7.2% | -0.2% |
| 62 | Lindale | 6,644 | $295,137 | 4.0% | -1.0% |
| 63 | Everman | 6,106 | $219,883 | 0.8% | 1.4% |
| 64 | Port Isabel | 5,111 | $262,760 | 0.3% | 2.9% |
| 65 | Kermit | 5,689 | $131,769 | 0.1% | 10.9% |
| 66 | White Oak | 6,235 | $244,808 | 0.4% | 0.6% |
| 67 | Burnet | 6,732 | $411,325 | 1.5% | 1.2% |
| 68 | Iowa Park | 6,578 | $192,108 | 0.1% | 2.7% |
| 69 | Crockett | 6,364 | $185,185 | 0.7% | 2.0% |
| 70 | Sealy | 7,053 | $373,691 | 1.7% | -3.0% |
| 71 | Carthage | 6,601 | $200,497 | 0.5% | 1.4% |
| 72 | Keene | 6,691 | $254,365 | 1.8% | -0.4% |
| 73 | Bridgeport | 6,331 | $223,656 | 2.5% | 4.1% |
| 74 | Silsbee | 6,842 | $172,423 | -0.6% | 2.4% |
| 75 | Sunnyvale | 8,336 | $631,290 | 3.3% | -0.6% |
| 76 | Lacy-Lakeview | 7,274 | $190,057 | 0.4% | 1.8% |
| 77 | Willis | 6,878 | $284,060 | 2.8% | 0.1% |
| 78 | Marble Falls | 7,752 | $403,824 | 6.9% | -2.3% |
| 79 | Bee Cave | 8,862 | $823,338 | 0.0% | -6.8% |
| 80 | Prairie View | 8,431 | $217,583 | 2.6% | 4.2% |
| 81 | Decatur | 7,426 | $435,802 | 4.8% | -0.4% |
| 82 | Elsa | 5,697 | $139,852 | 0.2% | 3.3% |
| 83 | Lago Vista | 9,650 | $402,383 | 3.3% | 1.0% |
| 84 | Crystal City | 6,159 | $87,877 | -1.3% | 3.8% |
| 85 | La Feria | 6,891 | $182,095 | 1.0% | 5.0% |
| 86 | Mexia | 6,859 | $126,059 | -0.1% | -6.3% |
| 87 | Providence Village | 8,721 | $372,220 | 7.5% | 0.9% |
| 88 | Jasper | 7,299 | $164,332 | 1.2% | -1.5% |
| 89 | Gonzales | 7,200 | $251,993 | 0.3% | 1.3% |
| 90 | Kaufman | 8,538 | $291,010 | 6.6% | 1.5% |
| 91 | River Oaks | 7,584 | $222,017 | 0.9% | 3.8% |
| 92 | Monahans | 7,452 | $193,258 | -1.1% | 7.9% |
| 93 | Seminole | 7,184 | $253,279 | 1.2% | 1.4% |
| 94 | Los Fresnos | 8,291 | $218,340 | 1.4% | 4.4% |
| 95 | Navasota | 8,542 | $272,473 | 4.6% | -0.5% |
| 96 | Joshua | 8,550 | $355,622 | 3.3% | 1.4% |
| 97 | Hitchcock | 7,563 | $214,106 | 1.1% | 2.2% |
| 98 | Floresville | 8,007 | $351,700 | 4.3% | -1.7% |
| 99 | Lampasas | 7,671 | $287,103 | 2.2% | -0.3% |
| 100 | Jersey Village | 7,817 | $385,931 | 0.0% | 0.9% |