American Canyon SnackAbility
Overall SnackAbility
Crime in American Canyon summary. We use data from the FBI to determine the crime rates in American Canyon. Key points include:
There were 332 total crimes in American Canyon in the last reporting year.
The overall crime rate per 100,000 people in American Canyon is 1,566.1 / 100k people.
The violent crime rate per 100,000 people in American Canyon is 325.5 / 100k people.
The property crime rate per 100,000 people in American Canyon is 1,240.6 / 100k people.
Overall, crime in American Canyon is -26.10% below the national average.
Total Crimes
Below National Average
Crime In American Canyon Comparison Table
| Statistic | Count Raw |
American Canyon / 100k People |
California / 100k People |
National / 100k People |
|---|---|---|---|---|
| Total Crimes Per 100K | 332 | 1,566.1 | 2,564.5 | 2,119.2 |
| Violent Crime | 69 | 325.5 | 486.0 | 359.0 |
| Murder | 1 | 4.7 | 4.5 | 5.0 |
| Robbery | 14 | 66.0 | 119.1 | 61.0 |
| Aggravated Assault | 43 | 202.8 | 325.8 | 256.0 |
| Property Crime | 263 | 1,240.6 | 2,078.4 | 1,760.0 |
| Burglary | 9 | 42.5 | 305.8 | 229.0 |
| Larceny | 204 | 962.3 | 1,345.2 | 1,272.0 |
| Car Theft | 50 | 235.9 | 427.5 | 259.0 |
Source: FBI Uniform Crime Reporting (2024)
Cost of living in American Canyon summary. We use data on the cost of living to determine how expensive it is to live in American Canyon. Real estate prices drive most of the variance in cost of living around California. Key points include:
The cost of living in American Canyon is 162 with 100 being average.
The cost of living in American Canyon is 1.6x higher than the national average.
The median home value in American Canyon is $743,650.
The median income in American Canyon is $121,700.
American Canyon's Overall Cost Of Living
Higher Than The National Average
Cost Of Living In American Canyon Comparison Table
| Living Expense | American Canyon | California | National Average |
|---|---|---|---|
| Overall | 162 | 142 | 100 |
| Services | 113 | 110 | 100 |
| Groceries | 115 | 118 | 100 |
| Health | 259 | 197 | 100 |
| Housing | 124 | 120 | 100 |
| Transportation | 120 | 121 | 100 |
| Utilities | 120 | 121 | 100 |
Source: Cost of living index, normalized to US average = 100
American Canyon, CA Weather
The average high in American Canyon is 72.1° and the average low is 46.6°.
There are 43.8 days of precipitation each year.
Expect an average of 33.8 inches of precipitation each year with 0.0 inches of snow.
| Stat | American Canyon |
|---|---|
| Average Annual High | 72.1 |
| Average Annual Low | 46.6 |
| Annual Precipitation Days | 43.8 |
| Average Annual Precipitation | 33.8 |
| Average Annual Snowfall | 0.0 |
Average High
Days of Rain
Source: NOAA climate normals (30-year)
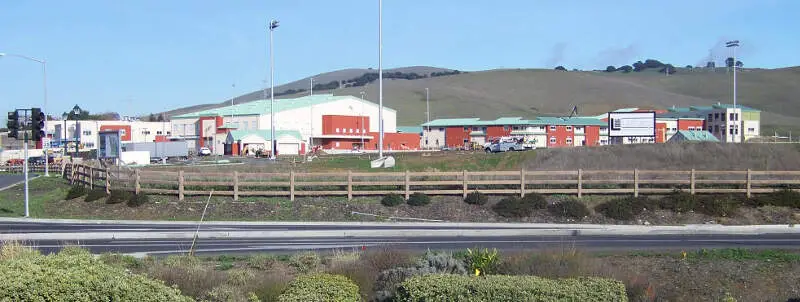
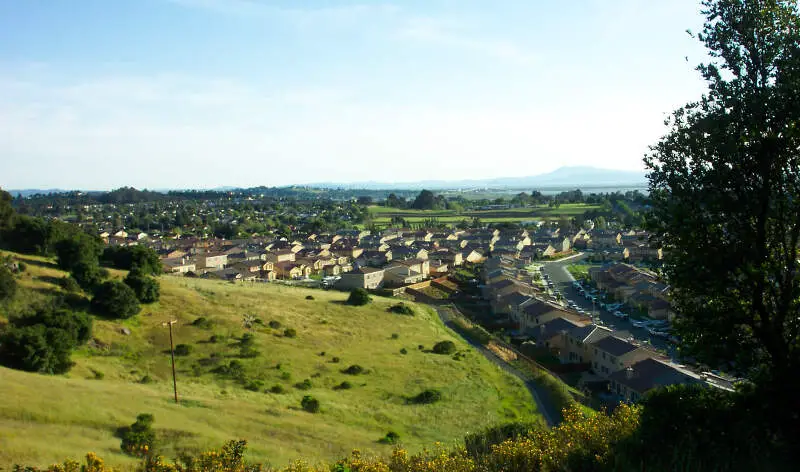
American Canyon, CA Photos

Rankings & Articles For American Canyon


Locations Around American Canyon
Map Of American Canyon, CA
Best Places Around American Canyon
Kensington, CA
Population 5,179
Lucas Valley-Marinwood, CA
Population 6,473
Mountain View, CA
Population 83,732
Hercules, CA
Population 26,302
Martinez, CA
Population 36,903
Napa, CA
Population 78,239
Pleasant Hill, CA
Population 34,235
Novato, CA
Population 52,546
San Rafael, CA
Population 60,433
Albany, CA
Population 19,414
American Canyon Demographics And Statistics
Population over time in American Canyon
The current population in American Canyon is 21,691. The population has increased 22.6% from 2010.
| Year | Population | % Change |
|---|---|---|
| 2024 | 21,691 | -0.0% |
| 2023 | 21,698 | 0.1% |
| 2022 | 21,669 | -0.3% |
| 2021 | 21,735 | 7.3% |
| 2020 | 20,256 | -0.0% |
| 2019 | 20,261 | -0.2% |
| 2018 | 20,306 | -0.2% |
| 2017 | 20,341 | 0.0% |
| 2016 | 20,334 | 0.3% |
| 2015 | 20,271 | 0.9% |
| 2014 | 20,089 | 2.2% |
| 2013 | 19,656 | 2.8% |
| 2012 | 19,127 | 3.5% |
| 2011 | 18,489 | 4.5% |
| 2010 | 17,692 | - |
Race / Ethnicity in American Canyon
See the full breakdown
American Canyon is:
20.5% White with 4,446 White residents.
4.8% African American with 1,045 African American residents.
0.2% American Indian with 54 American Indian residents.
32.9% Asian with 7,131 Asian residents.
1.2% Hawaiian with 269 Hawaiian residents.
0.7% Other with 142 Other residents.
7.6% Two Or More with 1,642 Two Or More residents.
32.1% Hispanic with 6,962 Hispanic residents.
| Race | American Canyon | CA | USA |
|---|---|---|---|
| White | 20.5% | 33.8% | 57.4% |
| African American | 4.8% | 5.2% | 11.9% |
| American Indian | 0.2% | 0.3% | 0.5% |
| Asian | 32.9% | 15.3% | 5.9% |
| Hawaiian | 1.2% | 0.3% | 0.2% |
| Other | 0.7% | 0.6% | 0.6% |
| Two Or More | 7.6% | 4.4% | 4.3% |
| Hispanic | 32.1% | 40.2% | 19.3% |
Gender in American Canyon
See the full breakdown
American Canyon is 51.7% female with 11,220 female residents.
American Canyon is 48.3% male with 10,471 male residents.
| Gender | American Canyon | CA | USA |
|---|---|---|---|
| Female | 51.7% | 50.1% | 50.5% |
| Male | 48.3% | 49.9% | 49.5% |
Highest level of educational attainment in American Canyon for adults over 25
See the full breakdown
9.0% of adults in American Canyon completed < 9th grade.
6.0% of adults in American Canyon completed 9-12th grade.
20.0% of adults in American Canyon completed high school / ged.
23.0% of adults in American Canyon completed some college.
9.0% of adults in American Canyon completed associate's degree.
25.0% of adults in American Canyon completed bachelor's degree.
6.0% of adults in American Canyon completed master's degree.
1.0% of adults in American Canyon completed professional degree.
1.0% of adults in American Canyon completed doctorate degree.
| Education | American Canyon | CA | USA |
|---|---|---|---|
| < 9th Grade | 9.0% | 8.0% | 4.0% |
| 9-12th Grade | 6.0% | 7.0% | 6.0% |
| High School / GED | 20.0% | 20.0% | 26.0% |
| Some College | 23.0% | 19.0% | 19.0% |
| Associate's Degree | 9.0% | 8.0% | 9.0% |
| Bachelor's Degree | 25.0% | 23.0% | 22.0% |
| Master's Degree | 6.0% | 10.0% | 10.0% |
| Professional Degree | 1.0% | 3.0% | 2.0% |
| Doctorate Degree | 1.0% | 2.0% | 2.0% |
Household Income For American Canyon, California
See the full breakdown
5.3% of households in American Canyon earn Less than $10,000.
1.2% of households in American Canyon earn $10,000 to $14,999.
2.8% of households in American Canyon earn $15,000 to $24,999.
6.4% of households in American Canyon earn $25,000 to $34,999.
6.1% of households in American Canyon earn $35,000 to $49,999.
9.5% of households in American Canyon earn $50,000 to $74,999.
10.0% of households in American Canyon earn $75,000 to $99,999.
19.5% of households in American Canyon earn $100,000 to $149,999.
14.8% of households in American Canyon earn $150,000 to $199,999.
24.6% of households in American Canyon earn $200,000 or more.
| Income | American Canyon | CA | USA |
|---|---|---|---|
| Less than $10,000 | 5.3% | 4.5% | 5.0% |
| $10,000 to $14,999 | 1.2% | 2.9% | 3.4% |
| $15,000 to $24,999 | 2.8% | 5.0% | 6.3% |
| $25,000 to $34,999 | 6.4% | 5.3% | 6.6% |
| $35,000 to $49,999 | 6.1% | 8.1% | 10.1% |
| $50,000 to $74,999 | 9.5% | 13.0% | 15.5% |
| $75,000 to $99,999 | 10.0% | 11.6% | 12.6% |
| $100,000 to $149,999 | 19.5% | 17.8% | 17.5% |
| $150,000 to $199,999 | 14.8% | 11.3% | 9.6% |
| $200,000 or more | 24.6% | 20.5% | 13.4% |
Source: U.S. Census ACS 5-year estimates (2024)


