

What do Biggie, Tupac, and Snoop Dogg have in common? They’ve all written songs about some of the most dangerous places in California.
That’s right, from Stockton to Compton, The Golden State has some pretty sketchy places, and we’re here to tell you just where those places are located. We’ve put the research into creating a list of the top ten most dangerous places in California for 2026.
To compile our list, we looked at FBI data for violent and property crimes per capita in California cities with a population of 5,000 — that left us with 414 cities.
We discovered that many of California’s biggest cities are among its most dangerous. Cities like Oakland and San Bernardino just can’t catch a break.
1,448 violent crimes /100k · 12,360 property crimes /100k · #2 most violent in California
 Located in
Los Angeles County, California
Located in
Los Angeles County, California
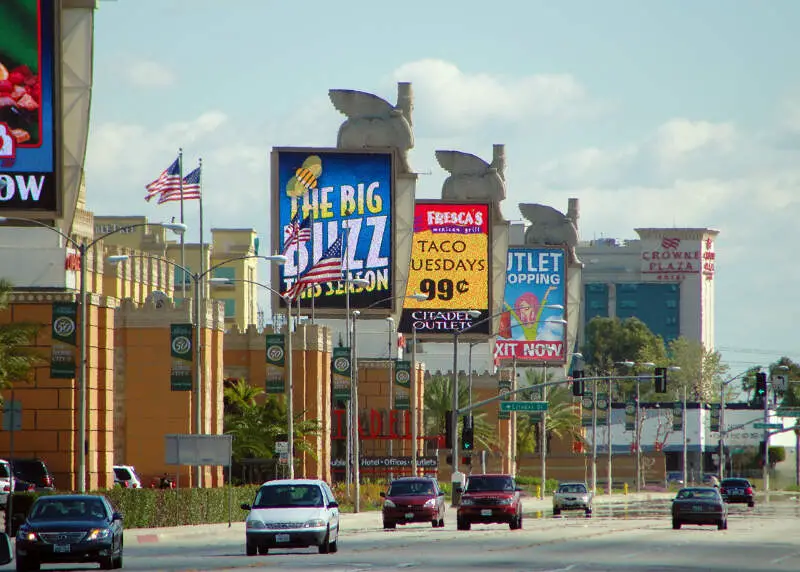
Located just southeast of Los Angeles, Commerce is nicknamed “The Model City,” but it has a long way to go before it can be truly described as a model for crime rates. Over the course of a year, any given resident has a 1 in 8 chance of being the victim of a property crime, the second highest rate in California.
Commerce’s violent crime, on the other hand, has been dropping at a steady rate in recent years, but it’s still prevalent enough to rank as the second most violent place in California for 2024. At least nobody has to resort to pickpocketing for bus fare, because Commerce is one of the few cities in California to offer free bus service.
Data | Crime | Cost of living | Movers
1,925 violent crimes /100k · 7,230 property crimes /100k · #1 most violent in California
 Located in
Alameda County, California
Located in
Alameda County, California
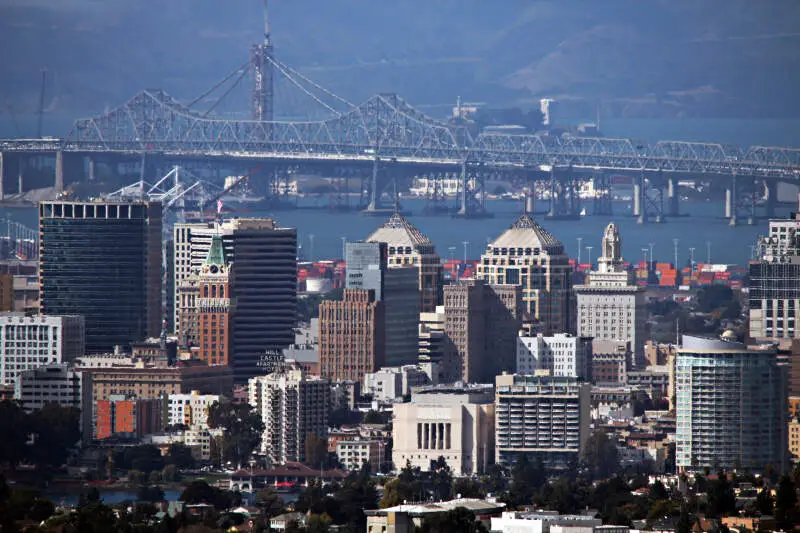
Oakland gets a bad wrap for being hella dangerous, but, in this case, the stereotype is all too true. With an overall crime rate 150% higher than the national average, a murder happening every five days on average, and the third highest rate of property crime in California, the statistics lead to the inescapable conclusion that Bump City is far from safe.
On the plus side, Oakland still has plenty of family-friendly spots where you don’t have to be looking over your shoulder constantly, like the entertainment and business destination, Jack London Square on the city’s waterfront, and the Oakland Zoo in Grass Valley.
Data | Crime | Cost of living | Movers | Compare

1,386 violent crimes /100k · 6,462 property crimes /100k · #3 most violent in California
In purely geographical terms, Crescent City represents an excellent place to live. Located in the extreme north of the state, less than a half hour south of the Oregon border, the community sits along the Pacific coast. It even gets its name from a crescent-shaped beach nearby.
If only you could live there alone. Unfortunately, residents of Crescent City have reason to distrust their neighbors. After all, this is number 3 most dangerous spot in California.
For a community of just 5,339 people, the area experienced 74 violent crimes. This included 7 sexual assaults, giving it the number 4 scariest rate in this disturbing category.
Data | Crime | Cost of living | Movers
1,231 violent crimes /100k · 13,487 property crimes /100k · #6 most violent in California
 Located in
Alameda County, California
Located in
Alameda County, California
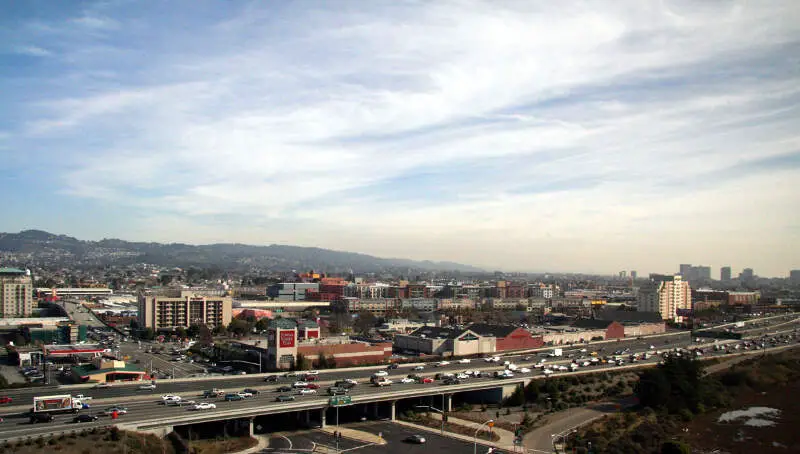
Four years running, and Emeryville still tops our list of the most dangerous places to live in California; not exactly a title they’re keen to hold onto, I’m sure. Located north of Oakland and east of San Francisco, Emeryville is also home to the Pixar Studios.
Those cute Pixar characters would be way out of their element if they landed in Emeryville, though, where they’d have a 1 in 81 chance of being the victim of a violent crime and a shocking 1 in 7 chance of being at the receiving end of a property crime.
So if you’re out for a shopping spree on Bay Street, be sure to get out quick, or your day’s haul could easily get snatched. The good news? Emeryville didn’t have a single murder last year, so that’s something.
Data | Crime | Cost of living | Movers
1,277 violent crimes /100k · 4,250 property crimes /100k · #4 most violent in California
 Located in
Tehama County, California
Located in
Tehama County, California
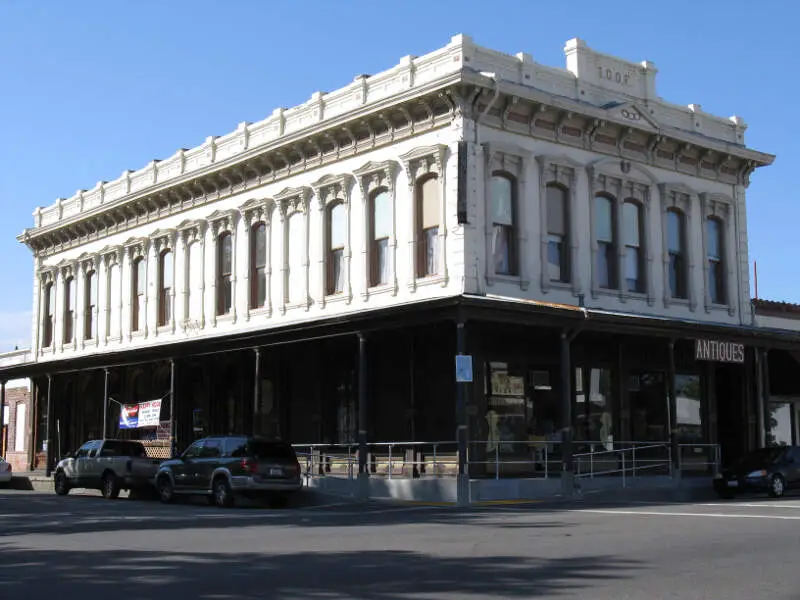
Located on the northern edge of the Sacramento Valley, Red Bluff comes in as the fifth most dangerous place in California. While it may not be a major city, or near a major city, Red Bluff experienced a shocking rate of violent crime in 2024, the fourth highest statewide. So if you’re out for a day at the Sacramento River Bend, your reasons for bringing along some bear mace are twofold.
Property crime is slightly less of a problem in Red Bluff, but a 1 in 23 chance of being robbed or having your property damaged is certainly less than ideal. Unfortunately, Red Bluff also had the highest rate of rape cases in California recorded in 2024.
Data | Crime | Cost of living | Movers
913 violent crimes /100k · 5,918 property crimes /100k · #15 most violent in California
 Located in
Los Angeles County, California
Located in
Los Angeles County, California
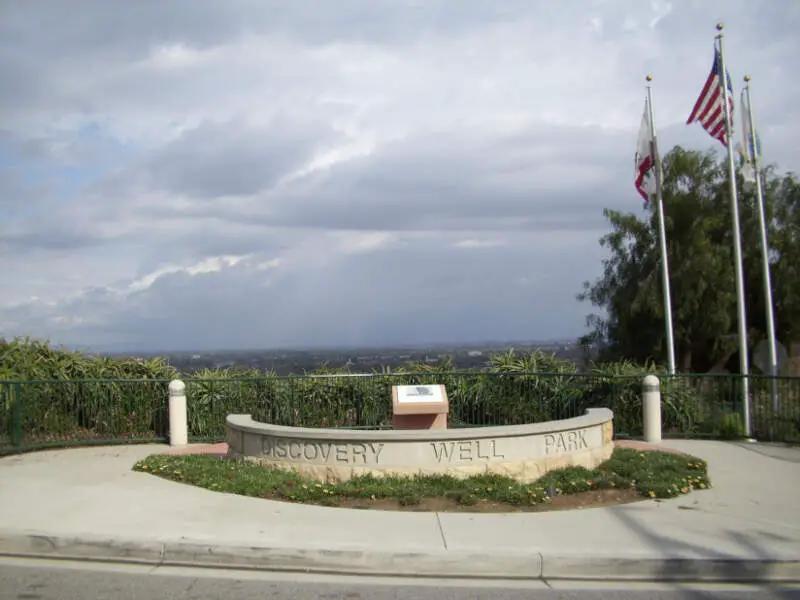
An enclave surrounded entirely by Long Beach, Signal Hill comes in as the sixth most dangerous place to call home in California.
It’s honestly hard to believe you’re less than 15 minutes from the ritzy Naples neighborhood of Long Beach in Signal Hill. Residents have a 1 in 16 chance of being the victim of a property crime, the sixth highest rate in California.
On the bright side, Signal Hill’s violent crime rate is better than most cities on this list. The bad news? Signal Hill wasn’t even in the top 20 most dangerous places last year, so things are becoming markedly less safe here.
Data | Crime | Cost of living | Movers
906 violent crimes /100k · 6,161 property crimes /100k · #17 most violent in California
 Located in
Los Angeles County, California
Located in
Los Angeles County, California
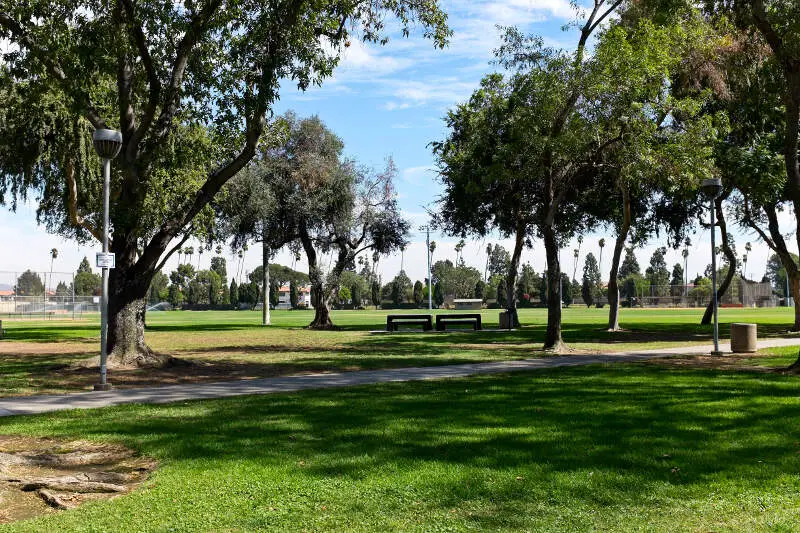
Santa Fe Springs is a city in Los Angeles County, California, United States. It is one of the Gateway Cities of southeast Los Angeles County. The population was 16,223 at the 2010 census, down from 17,438 at the 2000 census.
Data | Crime | Cost of living | Movers
884 violent crimes /100k · 5,491 property crimes /100k · #20 most violent in California
 Located in
Los Angeles County, California
Located in
Los Angeles County, California
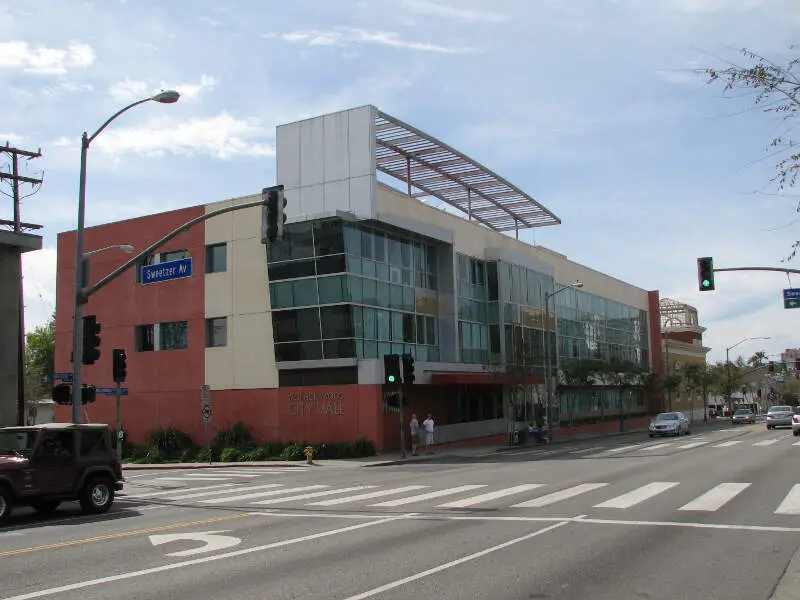
Hollywood is famous for producing films that showcase ungodly amounts of violence and property damage, but the real West Hollywood is a hub of such acts in its own right. West Hollywood’s property crime rate is the eighth highest in the state, and rape cases are the 25th highest.
West Hollywood somewhat makes up for these disappointing numbers by having one of the lowest rates of violent crime on this list, as well as an 8/10 overall SnackAbility score. Plus, it’s home to one of the largest LGBTQ communities in the nation, and the Sunset Strip is an excellent place to spend the day (just be sure to buddy up after dark).
Data | Crime | Cost of living | Movers

981 violent crimes /100k · 3,819 property crimes /100k · #12 most violent in California
 Located in
Butte County, California
Located in
Butte County, California
Oroville is the county seat of Butte County, California, United States. The population was 15,506 at the 2010 census, up from 13,004 in the 2000 census. Oroville is considered the gateway to Lake Oroville and Feather River recreational areas. The city of Oroville has recently annexed two locations in South Oroville, areas A and B, which have a combined population of 2,725 people. The U.S. Census Bureau estimated the population of the city to be 17,996 as of January 1, 2016, up 1,908 people or 11.9 percent since 2010. The Berry Creek Rancheria of Maidu Indians of California is headquartered here.
Data | Crime | Cost of living | Movers
778 violent crimes /100k · 4,790 property crimes /100k · #26 most violent in California
 Located in
Los Angeles County, California
Located in
Los Angeles County, California
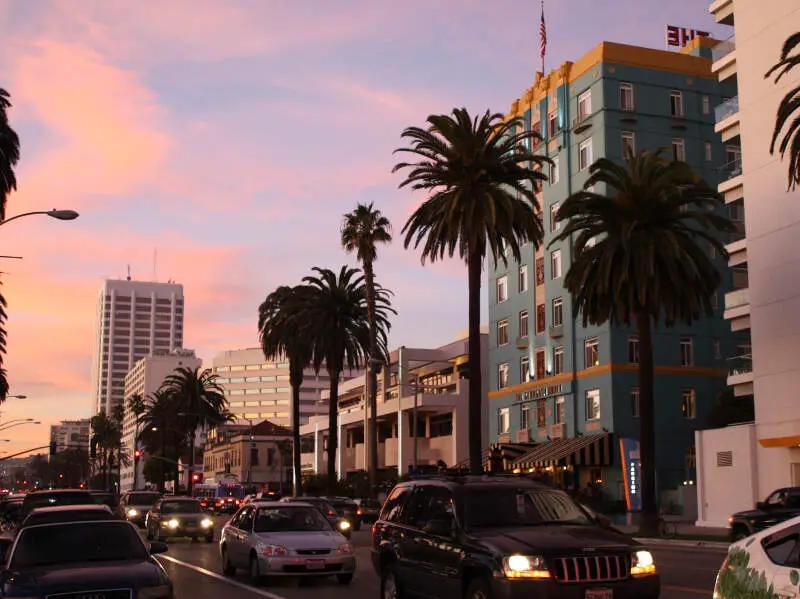
Santa Monica has a lot going for it; its titular pier is a favorite for locals and tourists alike, its beaches are world-class, and downtown is chock full of excellent entertainment, restaurants, and shops.
But there’s a seamy underbelly of crime in Santa Monica, much of it centered around the Pico neighborhood and its gang activity. So while Santa Monica’s property crime and violent crime rates are around the top ten worst in California, note that staying out of the city’s worst areas should yield a safe experience.
Data | Crime | Cost of living | Movers | Compare
The receipts
Compare the top ten
Pick a metric. The bars rescale. The red line is California’s statewide median.
On the map
Where crime hits hardest in California
Saturday Night Science
How we determined the most dangerous cities in California for 2026?
Every year the FBI release two crime datasets on cities in California. First a preliminary dataset limited to the biggest cities in California, followed by a more detailed release at the end of the year.
For our analysis, we focused on the 2024 data, specifically the 2024 Crime In The United States Report for California.
So what criteria did we use? Have a look:
- Violent Crimes Per Capita
- Property Crimes Per Capita
In order to make the analysis as apples to apples as possible, we only considered California cities over 5,000 in population. That left us with 414 cities in California.
We then ranked each city from 1 to 414 for the two criteria with a #1 ranking being the most dangerous for the particular criteria.
Next, we averaged the two rankings into one “Dangerous Index”.
Finally, we ranked every city on the “Dangerous Index” with the lowest index being the most dangerous in California — Commerce. Any ties went to the smaller city.
This article is an opinion based on facts and is meant as infotainment. It is our eleventh time ranking the most dangerous places to live in California and is updated for 2026. Property crime in California runs about 18 percent above the national rate — worth a minute to compare home security systems before you sign a lease.
The full plate
Crime By City In California
Click any column to sort. Search by city name.
| Rank | City | Dangerous Index | Population | Total Crimes Per 100K | Violent Crimes Per 100K | Property Crimes Per 100K | Murders |
|---|---|---|---|---|---|---|---|
| 1 | Commerce | 2.00 | 11,464 | 13,808 | 1,448 | 12,360 | 1 |
| 2 | Oakland | 2.00 | 435,042 | 9,156 | 1,925 | 7,230 | 81 |
| 3 | Crescent City | 3.50 | 5,339 | 7,848 | 1,386 | 6,462 | 0 |
| 4 | Emeryville | 3.50 | 12,671 | 14,719 | 1,231 | 13,487 | 0 |
| 5 | Red Bluff | 9.50 | 14,329 | 5,527 | 1,277 | 4,250 | 1 |
| 6 | Signal Hill | 10.50 | 11,068 | 6,831 | 913 | 5,918 | 0 |
| 7 | Santa Fe Springs | 11.00 | 20,534 | 7,066 | 906 | 6,161 | 1 |
| 8 | West Hollywood | 14.00 | 33,928 | 6,375 | 884 | 5,491 | 2 |
| 9 | Oroville | 16.50 | 19,270 | 4,800 | 981 | 3,819 | 0 |
| 10 | Santa Monica | 19.50 | 88,948 | 5,568 | 778 | 4,790 | 4 |
| 11 | Compton | 20.50 | 89,564 | 4,417 | 1,272 | 3,145 | 18 |
| 12 | Eureka | 22.50 | 25,485 | 4,187 | 1,016 | 3,170 | 0 |
| 13 | Vallejo | 23.50 | 121,795 | 4,730 | 740 | 3,990 | 20 |
| 14 | Lynwood | 24.00 | 62,089 | 4,118 | 910 | 3,208 | 5 |
| 15 | Culver City | 29.00 | 38,514 | 6,530 | 667 | 5,863 | 0 |
| 16 | Fresno | 31.50 | 546,722 | 4,007 | 735 | 3,271 | 32 |
| 17 | San Bernardino | 32.50 | 224,283 | 3,795 | 897 | 2,898 | 25 |
| 18 | Richmond | 35.50 | 113,418 | 3,685 | 923 | 2,762 | 9 |
| 19 | Berkeley | 35.50 | 117,400 | 5,868 | 639 | 5,229 | 7 |
| 20 | Stockton | 35.50 | 319,069 | 3,785 | 1,146 | 2,640 | 51 |
| 21 | Barstow | 36.50 | 24,817 | 3,747 | 1,108 | 2,639 | 1 |
| 22 | Inglewood | 37.50 | 101,399 | 4,289 | 675 | 3,614 | 7 |
| 23 | Long Beach | 37.50 | 444,232 | 4,155 | 676 | 3,479 | 37 |
| 24 | Gardena | 39.50 | 57,584 | 3,755 | 703 | 3,051 | 3 |
| 25 | Merced | 39.50 | 96,077 | 3,577 | 785 | 2,793 | 7 |
| 26 | Montclair | 40.00 | 37,414 | 4,290 | 644 | 3,646 | 0 |
| 27 | Huntington Park | 40.50 | 51,054 | 3,812 | 691 | 3,120 | 3 |
| 28 | Costa Mesa | 40.50 | 107,235 | 3,574 | 738 | 2,837 | 3 |
| 29 | Malibu | 41.50 | 10,164 | 4,260 | 640 | 3,621 | 0 |
| 30 | San Francisco | 45.00 | 802,856 | 4,526 | 596 | 3,929 | 35 |
| 31 | Pomona | 47.50 | 143,726 | 3,469 | 716 | 2,753 | 12 |
| 32 | Sacramento | 49.50 | 526,670 | 3,302 | 755 | 2,547 | 45 |
| 33 | Palm Springs | 50.50 | 45,406 | 3,817 | 603 | 3,213 | 5 |
| 34 | Antioch | 50.50 | 117,675 | 3,800 | 607 | 3,194 | 16 |
| 35 | Fort Bragg | 54.00 | 6,901 | 3,333 | 696 | 2,637 | 0 |
| 36 | San Leandro | 55.00 | 84,200 | 4,471 | 549 | 3,923 | 4 |
| 37 | El Segundo | 55.50 | 16,196 | 5,977 | 512 | 5,464 | 0 |
| 38 | Beverly Hills | 58.50 | 30,457 | 4,951 | 512 | 4,439 | 0 |
| 39 | Hawthorne | 59.50 | 81,941 | 3,193 | 727 | 2,465 | 8 |
| 40 | South Gate | 60.50 | 89,223 | 4,124 | 526 | 3,599 | 4 |
| 41 | Riverside | 62.50 | 320,148 | 3,422 | 590 | 2,832 | 10 |
| 42 | Yreka | 63.00 | 7,813 | 3,149 | 704 | 2,445 | 0 |
| 43 | Victorville | 63.00 | 140,309 | 3,144 | 1,016 | 2,129 | 11 |
| 44 | San Jose | 67.00 | 956,840 | 3,195 | 607 | 2,588 | 26 |
| 45 | San Pablo | 69.50 | 30,974 | 3,135 | 626 | 2,509 | 1 |
| 46 | Santa Cruz | 70.00 | 61,346 | 3,128 | 613 | 2,515 | 3 |
| 47 | Modesto | 70.50 | 218,990 | 3,070 | 656 | 2,415 | 7 |
| 48 | Atwater | 71.00 | 32,093 | 2,904 | 710 | 2,194 | 2 |
| 49 | Paramount | 72.00 | 50,265 | 3,362 | 547 | 2,815 | 1 |
| 50 | Rialto | 73.50 | 103,164 | 3,037 | 642 | 2,395 | 2 |
| 51 | Hayward | 73.50 | 153,419 | 4,134 | 477 | 3,657 | 12 |
| 52 | Tehachapi | 75.50 | 10,275 | 3,124 | 574 | 2,550 | 0 |
| 53 | Marysville | 76.00 | 12,616 | 2,806 | 745 | 2,061 | 2 |
| 54 | Hawaiian Gardens | 77.00 | 13,172 | 2,839 | 736 | 2,103 | 3 |
| 55 | Campbell | 79.50 | 41,029 | 3,439 | 490 | 2,949 | 0 |
| 56 | Lancaster | 81.00 | 164,012 | 2,755 | 835 | 1,921 | 29 |
| 57 | South El Monte | 82.00 | 18,861 | 3,701 | 467 | 3,234 | 0 |
| 58 | El Cerrito | 82.00 | 25,424 | 3,524 | 480 | 3,044 | 0 |
| 59 | Concord | 82.50 | 121,341 | 3,371 | 485 | 2,886 | 3 |
| 60 | Bakersfield | 84.50 | 416,120 | 3,024 | 555 | 2,470 | 28 |
| 61 | Lakeport | 85.50 | 5,170 | 2,998 | 1,180 | 1,818 | 0 |
| 62 | San Rafael | 85.50 | 59,037 | 3,015 | 559 | 2,456 | 1 |
| 63 | Bellflower | 85.50 | 73,883 | 2,783 | 613 | 2,170 | 5 |
| 64 | Montebello | 88.50 | 59,231 | 3,108 | 495 | 2,613 | 2 |
| 65 | Dos Palos | 89.50 | 5,683 | 2,622 | 739 | 1,883 | 0 |
| 66 | National City | 90.00 | 54,915 | 2,635 | 696 | 1,939 | 4 |
| 67 | Seal Beach | 90.50 | 24,079 | 3,231 | 482 | 2,749 | 0 |
| 68 | Dinuba | 92.00 | 26,230 | 2,768 | 579 | 2,188 | 0 |
| 69 | Pasadena | 92.00 | 131,966 | 3,177 | 480 | 2,697 | 1 |
| 70 | Chico | 93.00 | 100,831 | 2,597 | 699 | 1,898 | 2 |
| 71 | Anaheim | 93.00 | 338,488 | 2,728 | 596 | 2,132 | 12 |
| 72 | Taft | 95.00 | 6,801 | 3,176 | 471 | 2,705 | 0 |
| 73 | Carson | 99.50 | 89,767 | 3,351 | 420 | 2,931 | 9 |
| 74 | Newark | 100.00 | 46,736 | 4,344 | 381 | 3,963 | 1 |
| 75 | Corning | 100.50 | 8,020 | 2,643 | 948 | 1,696 | 0 |
| 76 | Santa Maria | 100.50 | 110,056 | 2,543 | 661 | 1,883 | 3 |
| 77 | Grass Valley | 102.00 | 14,070 | 2,687 | 540 | 2,146 | 0 |
| 78 | East Palo Alto | 103.50 | 27,663 | 2,527 | 607 | 1,920 | 2 |
| 79 | Cerritos | 104.00 | 45,961 | 5,683 | 350 | 5,333 | 1 |
| 80 | Lakewood | 104.00 | 76,818 | 3,038 | 453 | 2,585 | 3 |
| 81 | Whittier | 104.50 | 83,186 | 2,866 | 490 | 2,375 | 5 |
| 82 | San Luis Obispo | 106.50 | 49,948 | 3,093 | 424 | 2,669 | 0 |
| 83 | Burbank | 107.00 | 101,377 | 3,462 | 391 | 3,072 | 2 |
| 84 | Santa Barbara | 111.00 | 85,758 | 2,458 | 648 | 1,810 | 0 |
| 85 | Oxnard | 111.00 | 197,361 | 2,474 | 596 | 1,877 | 6 |
| 86 | Artesia | 111.50 | 15,358 | 2,806 | 475 | 2,331 | 0 |
| 87 | Westminster | 112.50 | 88,026 | 2,934 | 436 | 2,498 | 3 |
| 88 | Alameda | 113.00 | 74,458 | 5,231 | 317 | 4,914 | 6 |
| 89 | Lawndale | 113.50 | 29,647 | 2,459 | 594 | 1,865 | 0 |
| 90 | Clearlake | 116.00 | 16,410 | 2,413 | 829 | 1,584 | 4 |
| 91 | Redding | 117.50 | 92,468 | 2,393 | 648 | 1,745 | 6 |
| 92 | Tulare | 121.00 | 71,689 | 2,415 | 572 | 1,843 | 8 |
| 93 | Gilroy | 121.50 | 57,877 | 2,625 | 461 | 2,163 | 0 |
| 94 | Palmdale | 121.50 | 158,983 | 2,416 | 551 | 1,865 | 9 |
| 95 | Pittsburg | 123.50 | 75,621 | 2,609 | 460 | 2,149 | 2 |
| 96 | Claremont | 125.00 | 35,139 | 2,419 | 501 | 1,918 | 0 |
| 97 | Milpitas | 126.00 | 76,523 | 3,497 | 314 | 3,183 | 3 |
| 98 | South Lake Tahoe | 129.00 | 21,005 | 2,247 | 786 | 1,462 | 0 |
| 99 | Hermosa Beach | 129.50 | 18,312 | 2,851 | 393 | 2,457 | 0 |
| 100 | Citrus Heights | 130.00 | 85,809 | 2,566 | 439 | 2,127 | 3 |
Source: FBI UCR 2024. 414 cities with more than 5,000 residents.
Summary
Summary: Locking It All Up In California
So what is the most dangerous city in California? After analyzing 414 cities in California, Commerce takes the top spot as the most dangerous city in California based on the most recently reported FBI data — 2024.
The latest FBI crime data shows that Commerce ranks as the most dangerous city in California for 2026.
The most dangerous cities in California are Commerce, Oakland, Crescent City, Emeryville, Red Bluff, Signal Hill, Santa Fe Springs, West Hollywood, Oroville, and Santa Monica.
We want to point out again that there’s still safes places in Commerce and that this isn’t a comment on the people that live there. So please don’t beat us up. Not sold on California? Take the two-minute Find Your Place quiz and see which state actually fits you.
Questions and answers
Most Dangerous Places To Live In California FAQs
What is the most dangerous city in California?
Commerce is the most dangerous city in California for 2026, based on the most recent FBI crime data. It logs 1,448 violent crimes and 12,360 property crimes per 100,000 residents.
What are the 10 most dangerous cities in California?
The ten most dangerous cities in California are Commerce, Oakland, Crescent City, Emeryville, Red Bluff, Signal Hill, Santa Fe Springs, West Hollywood, Oroville, and Santa Monica. We ranked all 414 cities with more than 5,000 residents on violent and property crime per capita.
Is California a dangerous state?
California is the 4th most dangerous state in the United States by our national ranking. Statewide numbers hide a lot, though; the highest crime rates in California belong to Commerce, Oakland, and Crescent City.
What is the safest city in California?
Holtville is the safest city in California, posting the lowest crime rate of the 414 places we analyzed. The full most-dangerous-to-safest ordering is in the table above.
How do you decide which California cities are the most dangerous?
We take each city’s violent and property crimes from the latest FBI Uniform Crime Report, divide by population, and rank every place with more than 5,000 residents. The city with the highest combined rate, Commerce, comes out most dangerous for 2026.



