Compare Burbank to…
Burbank SnackAbility
Overall SnackAbility
Crime in Burbank summary. We use data from the FBI to determine the crime rates in Burbank. Key points include:
There were 3,510 total crimes in Burbank in the last reporting year.
The overall crime rate per 100,000 people in Burbank is 3,462.3 / 100k people.
The violent crime rate per 100,000 people in Burbank is 390.6 / 100k people.
The property crime rate per 100,000 people in Burbank is 3,071.7 / 100k people.
Overall, crime in Burbank is 63.38% above the national average.
Total Crimes
Above National Average
Crime In Burbank Comparison Table
| Statistic | Count Raw |
Burbank / 100k People |
California / 100k People |
National / 100k People |
|---|---|---|---|---|
| Total Crimes Per 100K | 3,510 | 3,462.3 | 2,564.5 | 2,119.2 |
| Violent Crime | 396 | 390.6 | 486.0 | 359.0 |
| Murder | 2 | 2.0 | 4.5 | 5.0 |
| Robbery | 96 | 94.7 | 119.1 | 61.0 |
| Aggravated Assault | 286 | 282.1 | 325.8 | 256.0 |
| Property Crime | 3,114 | 3,071.7 | 2,078.4 | 1,760.0 |
| Burglary | 347 | 342.3 | 305.8 | 229.0 |
| Larceny | 2,470 | 2,436.5 | 1,345.2 | 1,272.0 |
| Car Theft | 297 | 293.0 | 427.5 | 259.0 |
Source: FBI Uniform Crime Reporting (2024)
Cost of living in Burbank summary. We use data on the cost of living to determine how expensive it is to live in Burbank. Real estate prices drive most of the variance in cost of living around California. Key points include:
The cost of living in Burbank is 193 with 100 being average.
The cost of living in Burbank is 1.9x higher than the national average.
The median home value in Burbank is $1,200,884.
The median income in Burbank is $97,082.
Burbank's Overall Cost Of Living
Higher Than The National Average
Cost Of Living In Burbank Comparison Table
| Living Expense | Burbank | California | National Average |
|---|---|---|---|
| Overall | 193 | 142 | 100 |
| Services | 112 | 110 | 100 |
| Groceries | 120 | 118 | 100 |
| Health | 358 | 197 | 100 |
| Housing | 123 | 120 | 100 |
| Transportation | 117 | 121 | 100 |
| Utilities | 121 | 121 | 100 |
Source: Cost of living index, normalized to US average = 100
Burbank, CA Weather
The average high in Burbank is 75.3° and the average low is 54.1°.
There are 22.7 days of precipitation each year.
Expect an average of 16.2 inches of precipitation each year with 0.2 inches of snow.
| Stat | Burbank |
|---|---|
| Average Annual High | 75.3 |
| Average Annual Low | 54.1 |
| Annual Precipitation Days | 22.7 |
| Average Annual Precipitation | 16.2 |
| Average Annual Snowfall | 0.2 |
Average High
Days of Rain
Source: NOAA climate normals (30-year)
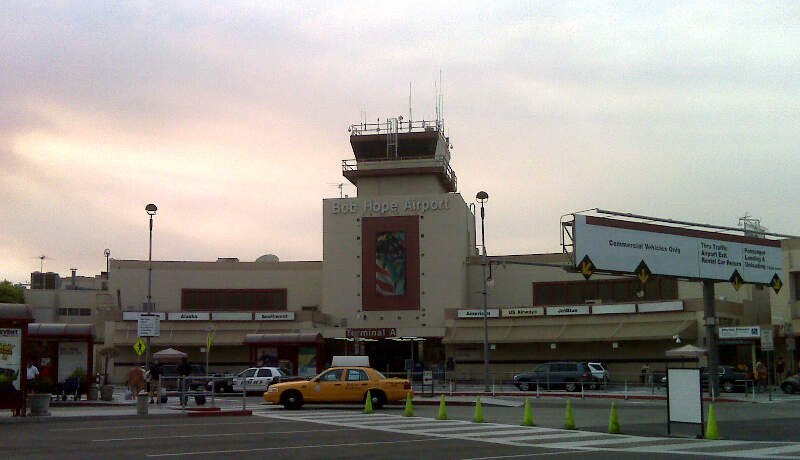
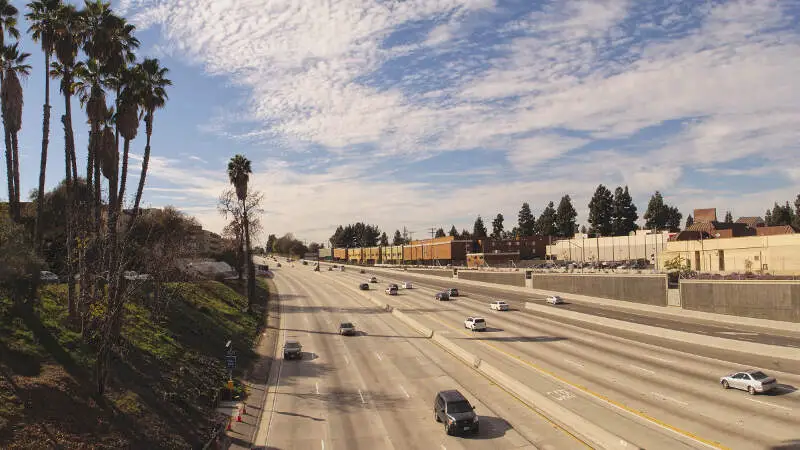
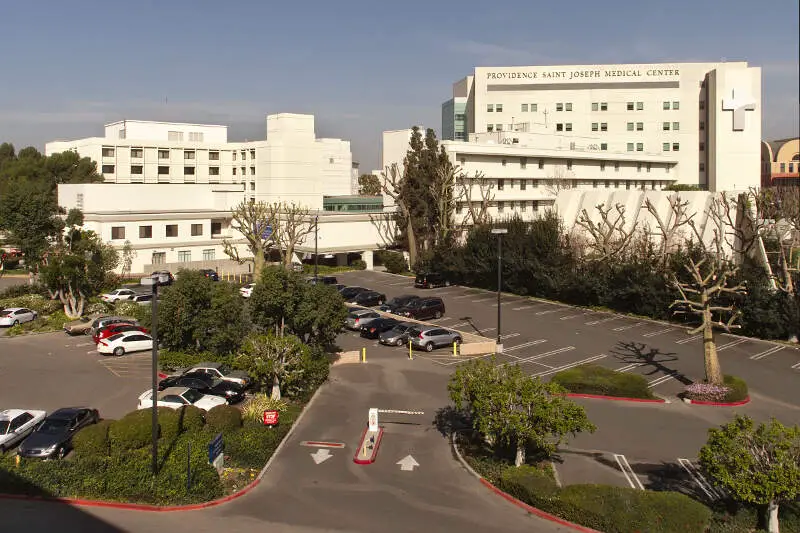
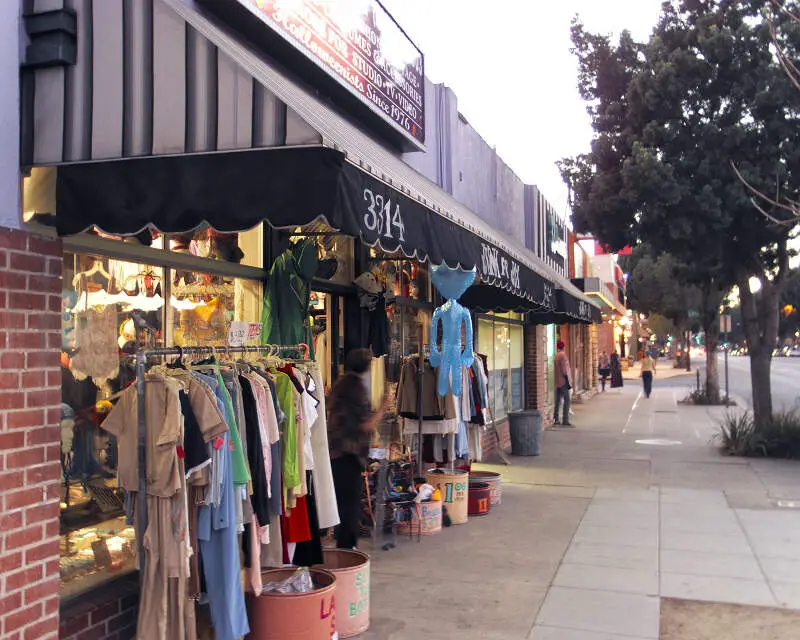
Burbank, CA Photos


Rankings & Articles For Burbank


Locations Around Burbank
Map Of Burbank, CA
Best Places Around Burbank
Burbank Demographics And Statistics
Population over time in Burbank
The current population in Burbank is 104,546. The population has increased 1.8% from 2010.
| Year | Population | % Change |
|---|---|---|
| 2024 | 104,546 | -0.6% |
| 2023 | 105,165 | -1.2% |
| 2022 | 106,389 | -0.9% |
| 2021 | 107,364 | 3.8% |
| 2020 | 103,411 | -0.3% |
| 2019 | 103,703 | -0.5% |
| 2018 | 104,275 | -0.5% |
| 2017 | 104,765 | 0.2% |
| 2016 | 104,583 | -0.1% |
| 2015 | 104,725 | 0.2% |
| 2014 | 104,484 | 0.6% |
| 2013 | 103,850 | 0.4% |
| 2012 | 103,420 | 0.4% |
| 2011 | 103,037 | 0.3% |
| 2010 | 102,723 | - |
Race / Ethnicity in Burbank
See the full breakdown
Burbank is:
54.1% White with 56,610 White residents.
3.9% African American with 4,129 African American residents.
0.2% American Indian with 173 American Indian residents.
11.5% Asian with 12,021 Asian residents.
0.1% Hawaiian with 60 Hawaiian residents.
0.9% Other with 983 Other residents.
5.3% Two Or More with 5,553 Two Or More residents.
23.9% Hispanic with 25,017 Hispanic residents.
| Race | Burbank | CA | USA |
|---|---|---|---|
| White | 54.1% | 33.8% | 57.4% |
| African American | 3.9% | 5.2% | 11.9% |
| American Indian | 0.2% | 0.3% | 0.5% |
| Asian | 11.5% | 15.3% | 5.9% |
| Hawaiian | 0.1% | 0.3% | 0.2% |
| Other | 0.9% | 0.6% | 0.6% |
| Two Or More | 5.3% | 4.4% | 4.3% |
| Hispanic | 23.9% | 40.2% | 19.3% |
Gender in Burbank
See the full breakdown
Burbank is 51.5% female with 53,818 female residents.
Burbank is 48.5% male with 50,727 male residents.
| Gender | Burbank | CA | USA |
|---|---|---|---|
| Female | 51.5% | 50.1% | 50.5% |
| Male | 48.5% | 49.9% | 49.5% |
Highest level of educational attainment in Burbank for adults over 25
See the full breakdown
5.0% of adults in Burbank completed < 9th grade.
3.0% of adults in Burbank completed 9-12th grade.
16.0% of adults in Burbank completed high school / ged.
19.0% of adults in Burbank completed some college.
10.0% of adults in Burbank completed associate's degree.
31.0% of adults in Burbank completed bachelor's degree.
12.0% of adults in Burbank completed master's degree.
3.0% of adults in Burbank completed professional degree.
1.0% of adults in Burbank completed doctorate degree.
| Education | Burbank | CA | USA |
|---|---|---|---|
| < 9th Grade | 5.0% | 8.0% | 4.0% |
| 9-12th Grade | 3.0% | 7.0% | 6.0% |
| High School / GED | 16.0% | 20.0% | 26.0% |
| Some College | 19.0% | 19.0% | 19.0% |
| Associate's Degree | 10.0% | 8.0% | 9.0% |
| Bachelor's Degree | 31.0% | 23.0% | 22.0% |
| Master's Degree | 12.0% | 10.0% | 10.0% |
| Professional Degree | 3.0% | 3.0% | 2.0% |
| Doctorate Degree | 1.0% | 2.0% | 2.0% |
Household Income For Burbank, California
See the full breakdown
4.8% of households in Burbank earn Less than $10,000.
4.2% of households in Burbank earn $10,000 to $14,999.
6.3% of households in Burbank earn $15,000 to $24,999.
5.1% of households in Burbank earn $25,000 to $34,999.
6.8% of households in Burbank earn $35,000 to $49,999.
12.6% of households in Burbank earn $50,000 to $74,999.
11.5% of households in Burbank earn $75,000 to $99,999.
17.7% of households in Burbank earn $100,000 to $149,999.
12.2% of households in Burbank earn $150,000 to $199,999.
18.8% of households in Burbank earn $200,000 or more.
| Income | Burbank | CA | USA |
|---|---|---|---|
| Less than $10,000 | 4.8% | 4.5% | 5.0% |
| $10,000 to $14,999 | 4.2% | 2.9% | 3.4% |
| $15,000 to $24,999 | 6.3% | 5.0% | 6.3% |
| $25,000 to $34,999 | 5.1% | 5.3% | 6.6% |
| $35,000 to $49,999 | 6.8% | 8.1% | 10.1% |
| $50,000 to $74,999 | 12.6% | 13.0% | 15.5% |
| $75,000 to $99,999 | 11.5% | 11.6% | 12.6% |
| $100,000 to $149,999 | 17.7% | 17.8% | 17.5% |
| $150,000 to $199,999 | 12.2% | 11.3% | 9.6% |
| $200,000 or more | 18.8% | 20.5% | 13.4% |
Source: U.S. Census ACS 5-year estimates (2024)


