Capitola, CA
Demographics And Statistics
Living In Capitola, California Summary
Life in Capitola research summary. HomeSnacks has been using Saturday Night Science to research the quality of life in Capitola over the past nine years using Census, FBI, Zillow, and other primary data sources. Based on the most recently available data, we found the following about life in Capitola:
The population in Capitola is 9,813.
The median home value in Capitola is $1,219,945.
The median income in Capitola is $96,412.
The cost of living in Capitola is 183 which is 1.8x higher than the national average.
The median rent in Capitola is $2,376.
The unemployment rate in Capitola is 2.5%.
The poverty rate in Capitola is 13.9%.
The average high in Capitola is 68.6° and the average low is 46.7°.
Capitola SnackAbility
Overall SnackAbility
Capitola, CA Crime Report
Crime in Capitola summary. We use data from the FBI to determine the crime rates in Capitola. Key points include:
There were 298 total crimes in Capitola in the last reporting year.
The overall crime rate per 100,000 people in Capitola is 3,150.4 / 100k people.
The violent crime rate per 100,000 people in Capitola is 243.2 / 100k people.
The property crime rate per 100,000 people in Capitola is 2,907.3 / 100k people.
Overall, crime in Capitola is 48.66% above the national average.
Total Crimes
Above National Average
Crime In Capitola Comparison Table
| Statistic | Count Raw |
Capitola / 100k People |
California / 100k People |
National / 100k People |
|---|---|---|---|---|
| Total Crimes Per 100K | 298 | 3,150.4 | 2,564.5 | 2,119.2 |
| Violent Crime | 23 | 243.2 | 486.0 | 359.0 |
| Murder | 0 | 0.0 | 4.5 | 5.0 |
| Robbery | 6 | 63.4 | 119.1 | 61.0 |
| Aggravated Assault | 12 | 126.9 | 325.8 | 256.0 |
| Property Crime | 275 | 2,907.3 | 2,078.4 | 1,760.0 |
| Burglary | 14 | 148.0 | 305.8 | 229.0 |
| Larceny | 247 | 2,611.3 | 1,345.2 | 1,272.0 |
| Car Theft | 14 | 148.0 | 427.5 | 259.0 |
Capitola, CA Cost Of Living
Cost of living in Capitola summary. We use data on the cost of living to determine how expensive it is to live in Capitola. Real estate prices drive most of the variance in cost of living around California. Key points include:
The cost of living in Capitola is 183 with 100 being average.
The cost of living in Capitola is 1.8x higher than the national average.
The median home value in Capitola is $1,219,945.
The median income in Capitola is $96,412.
Capitola's Overall Cost Of Living
Higher Than The National Average
Cost Of Living In Capitola Comparison Table
| Living Expense | Capitola | California | National Average | |
|---|---|---|---|---|
| Overall | 183 | 141 | 100 | |
| Services | 110 | 110 | 100 | |
| Groceries | 117 | 112 | 100 | |
| Health | 122 | 110 | 100 | |
| Housing | 331 | 195 | 100 | |
| Transportation | 129 | 125 | 100 | |
| Utilities | 130 | 128 | 100 | |
Capitola, CA Weather
The average high in Capitola is 68.6° and the average low is 46.7°.
There are 45.1 days of precipitation each year.
Expect an average of 38.1 inches of precipitation each year with 0.0 inches of snow.
| Stat | Capitola |
|---|---|
| Average Annual High | 68.6 |
| Average Annual Low | 46.7 |
| Annual Precipitation Days | 45.1 |
| Average Annual Precipitation | 38.1 |
| Average Annual Snowfall | 0.0 |
Average High
Days of Rain
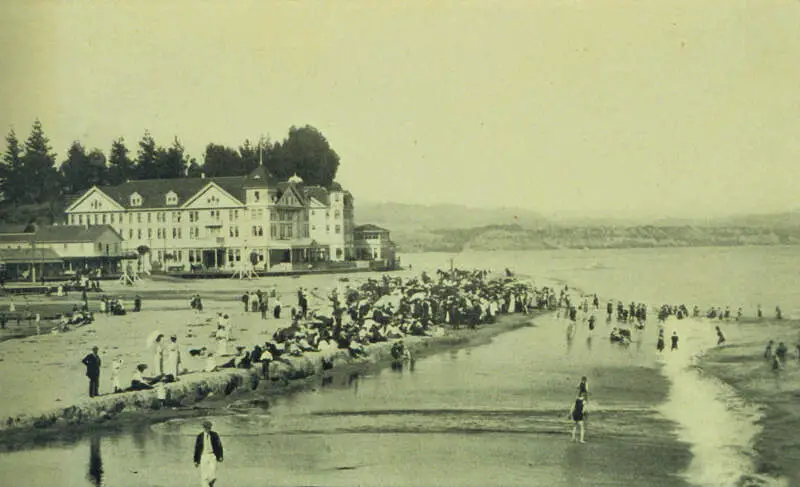
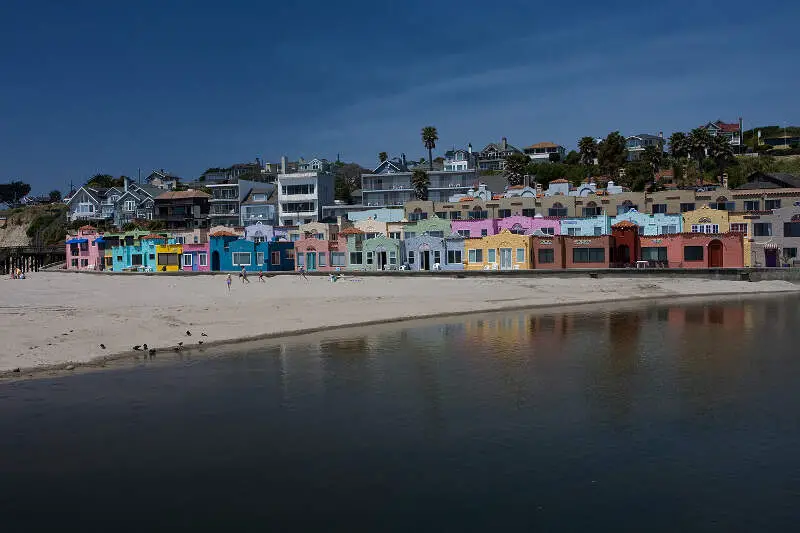
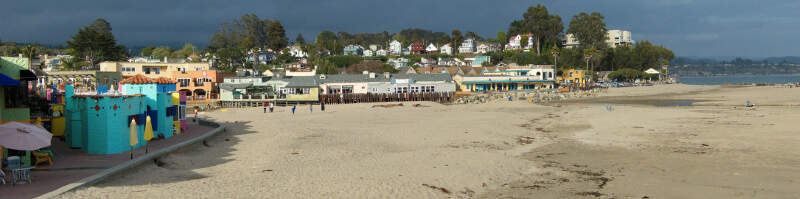
Capitola, CA Photos

Rankings for Capitola in California


Locations Around Capitola
Map Of Capitola, CA
Best Places Around Capitola
Los Gatos, CA
Population 32,773
Interlaken, CA
Population 8,191
Castroville, CA
Population 6,870
Scotts Valley, CA
Population 12,138
Soquel, CA
Population 10,691
Aptos, CA
Population 6,124
Rio del Mar, CA
Population 8,938
Santa Cruz, CA
Population 60,953
Watsonville, CA
Population 51,968
Ben Lomond, CA
Population 6,849
Capitola Demographics And Statistics
Population over time in Capitola
The current population in Capitola is 9,813. The population has increased 0.1% from 2010.
| Year | Population | % Change |
|---|---|---|
| 2023 | 9,813 | -1.1% |
| 2022 | 9,921 | -1.2% |
| 2021 | 10,041 | -0.5% |
| 2020 | 10,090 | -0.3% |
| 2019 | 10,121 | -0.1% |
| 2018 | 10,135 | -0.2% |
| 2017 | 10,158 | 0.5% |
| 2016 | 10,109 | 0.3% |
| 2015 | 10,077 | 0.3% |
| 2014 | 10,043 | 0.6% |
| 2013 | 9,982 | 0.7% |
| 2012 | 9,914 | 0.5% |
| 2011 | 9,864 | 0.6% |
| 2010 | 9,801 | - |
Race / Ethnicity in Capitola
Capitola is:
59.5% White with 5,835 White residents.
0.3% African American with 32 African American residents.
0.4% American Indian with 37 American Indian residents.
4.4% Asian with 428 Asian residents.
0.0% Hawaiian with 4 Hawaiian residents.
0.1% Other with 7 Other residents.
4.0% Two Or More with 397 Two Or More residents.
31.3% Hispanic with 3,073 Hispanic residents.
| Race | Capitola | CA | USA |
|---|---|---|---|
| White | 59.5% | 34.6% | 58.2% |
| African American | 0.3% | 5.3% | 12.0% |
| American Indian | 0.4% | 0.3% | 0.5% |
| Asian | 4.4% | 15.1% | 5.7% |
| Hawaiian | 0.0% | 0.3% | 0.2% |
| Other | 0.1% | 0.5% | 0.5% |
| Two Or More | 4.0% | 4.1% | 3.9% |
| Hispanic | 31.3% | 39.8% | 19.0% |
Gender in Capitola
Capitola is 50.0% female with 4,908 female residents.
Capitola is 50.0% male with 4,905 male residents.
| Gender | Capitola | CA | USA |
|---|---|---|---|
| Female | 50.0% | 50.0% | 50.5% |
| Male | 50.0% | 50.0% | 49.5% |
Highest level of educational attainment in Capitola for adults over 25
4.0% of adults in Capitola completed < 9th grade.
5.0% of adults in Capitola completed 9-12th grade.
14.0% of adults in Capitola completed high school / ged.
20.0% of adults in Capitola completed some college.
12.0% of adults in Capitola completed associate's degree.
29.0% of adults in Capitola completed bachelor's degree.
11.0% of adults in Capitola completed master's degree.
3.0% of adults in Capitola completed professional degree.
2.0% of adults in Capitola completed doctorate degree.
| Education | Capitola | CA | USA |
|---|---|---|---|
| < 9th Grade | 4.0% | 8.0% | 5.0% |
| 9-12th Grade | 5.0% | 7.0% | 6.0% |
| High School / GED | 14.0% | 20.0% | 26.0% |
| Some College | 20.0% | 20.0% | 19.0% |
| Associate's Degree | 12.0% | 8.0% | 9.0% |
| Bachelor's Degree | 29.0% | 22.0% | 21.0% |
| Master's Degree | 11.0% | 10.0% | 10.0% |
| Professional Degree | 3.0% | 3.0% | 2.0% |
| Doctorate Degree | 2.0% | 2.0% | 2.0% |
Household Income For Capitola, California
3.8% of households in Capitola earn Less than $10,000.
2.6% of households in Capitola earn $10,000 to $14,999.
4.8% of households in Capitola earn $15,000 to $24,999.
4.9% of households in Capitola earn $25,000 to $34,999.
7.0% of households in Capitola earn $35,000 to $49,999.
11.9% of households in Capitola earn $50,000 to $74,999.
18.4% of households in Capitola earn $75,000 to $99,999.
17.9% of households in Capitola earn $100,000 to $149,999.
12.8% of households in Capitola earn $150,000 to $199,999.
15.9% of households in Capitola earn $200,000 or more.
| Income | Capitola | CA | USA |
|---|---|---|---|
| Less than $10,000 | 3.8% | 4.4% | 4.9% |
| $10,000 to $14,999 | 2.6% | 3.0% | 3.6% |
| $15,000 to $24,999 | 4.8% | 5.2% | 6.6% |
| $25,000 to $34,999 | 4.9% | 5.5% | 6.8% |
| $35,000 to $49,999 | 7.0% | 8.4% | 10.4% |
| $50,000 to $74,999 | 11.9% | 13.3% | 15.7% |
| $75,000 to $99,999 | 18.4% | 11.8% | 12.7% |
| $100,000 to $149,999 | 17.9% | 17.9% | 17.4% |
| $150,000 to $199,999 | 12.8% | 11.1% | 9.3% |
| $200,000 or more | 15.9% | 19.4% | 12.6% |


