Colusa SnackAbility
Overall SnackAbility
Crime in Colusa summary. We use data from the FBI to determine the crime rates in Colusa. Key points include:
There were 67 total crimes in Colusa in the last reporting year.
The overall crime rate per 100,000 people in Colusa is 1,020.4 / 100k people.
The violent crime rate per 100,000 people in Colusa is 441.7 / 100k people.
The property crime rate per 100,000 people in Colusa is 578.7 / 100k people.
Overall, crime in Colusa is -51.85% below the national average.
Total Crimes
Below National Average
Crime In Colusa Comparison Table
| Statistic | Count Raw |
Colusa / 100k People |
California / 100k People |
National / 100k People |
|---|---|---|---|---|
| Total Crimes Per 100K | 67 | 1,020.4 | 2,564.5 | 2,119.2 |
| Violent Crime | 29 | 441.7 | 486.0 | 359.0 |
| Murder | 0 | 0.0 | 4.5 | 5.0 |
| Robbery | 4 | 60.9 | 119.1 | 61.0 |
| Aggravated Assault | 22 | 335.1 | 325.8 | 256.0 |
| Property Crime | 38 | 578.7 | 2,078.4 | 1,760.0 |
| Burglary | 8 | 121.8 | 305.8 | 229.0 |
| Larceny | 20 | 304.6 | 1,345.2 | 1,272.0 |
| Car Theft | 10 | 152.3 | 427.5 | 259.0 |
Source: FBI Uniform Crime Reporting (2024)
Cost of living in Colusa summary. We use data on the cost of living to determine how expensive it is to live in Colusa. Real estate prices drive most of the variance in cost of living around California. Key points include:
The cost of living in Colusa is 119 with 100 being average.
The cost of living in Colusa is 1.2x higher than the national average.
The median home value in Colusa is $366,115.
The median income in Colusa is $71,250.
Colusa's Overall Cost Of Living
Higher Than The National Average
Cost Of Living In Colusa Comparison Table
| Living Expense | Colusa | California | National Average |
|---|---|---|---|
| Overall | 119 | 142 | 100 |
| Services | 113 | 110 | 100 |
| Groceries | 116 | 118 | 100 |
| Health | 120 | 197 | 100 |
| Housing | 116 | 120 | 100 |
| Transportation | 119 | 121 | 100 |
| Utilities | 116 | 121 | 100 |
Source: Cost of living index, normalized to US average = 100
Colusa, CA Weather
The average high in Colusa is 74.8° and the average low is 48.3°.
There are 55.8 days of precipitation each year.
Expect an average of 19.2 inches of precipitation each year with 0.6 inches of snow.
| Stat | Colusa |
|---|---|
| Average Annual High | 74.8 |
| Average Annual Low | 48.3 |
| Annual Precipitation Days | 55.8 |
| Average Annual Precipitation | 19.2 |
| Average Annual Snowfall | 0.6 |
Average High
Days of Rain
Source: NOAA climate normals (30-year)
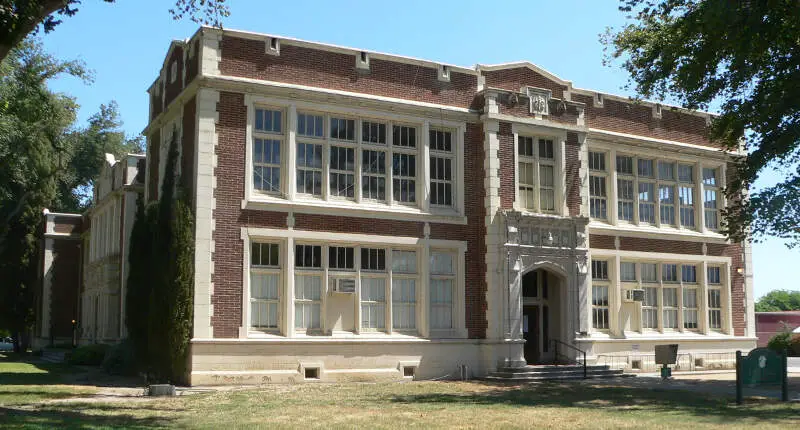
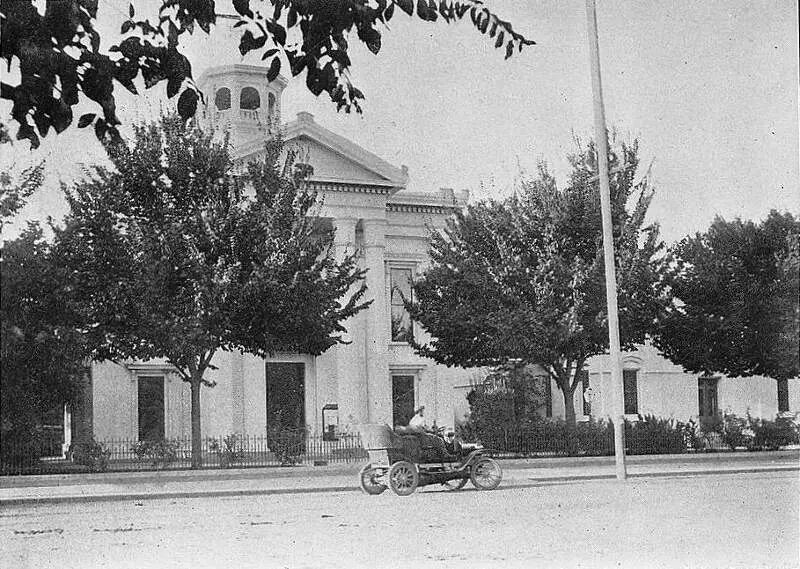
Colusa, CA Photos
Rankings & Articles For Colusa


Locations Around Colusa
Map Of Colusa, CA
Best Places Around Colusa
Davis, CA
Population 66,978
Rocklin, CA
Population 73,327
Winters, CA
Population 7,583
Antelope, CA
Population 48,301
Williams, CA
Population 5,585
Elverta, CA
Population 4,769
Durham, CA
Population 5,340
Woodland, CA
Population 61,854
Colusa Demographics And Statistics
Population over time in Colusa
The current population in Colusa is 6,505. The population has increased 9.5% from 2010.
| Year | Population | % Change |
|---|---|---|
| 2024 | 6,505 | 1.0% |
| 2023 | 6,439 | 0.9% |
| 2022 | 6,380 | 0.3% |
| 2021 | 6,359 | 4.1% |
| 2020 | 6,111 | 0.1% |
| 2019 | 6,106 | 3.5% |
| 2018 | 5,902 | -0.6% |
| 2017 | 5,938 | 0.1% |
| 2016 | 5,935 | -0.1% |
| 2015 | 5,939 | -0.4% |
| 2014 | 5,962 | 0.1% |
| 2013 | 5,956 | 0.3% |
| 2012 | 5,937 | -0.2% |
| 2011 | 5,951 | 0.2% |
| 2010 | 5,942 | - |
Race / Ethnicity in Colusa
See the full breakdown
Colusa is:
36.3% White with 2,360 White residents.
1.6% African American with 102 African American residents.
0.0% American Indian with 0 American Indian residents.
1.4% Asian with 90 Asian residents.
0.1% Hawaiian with 9 Hawaiian residents.
0.2% Other with 14 Other residents.
3.2% Two Or More with 210 Two Or More residents.
57.2% Hispanic with 3,720 Hispanic residents.
| Race | Colusa | CA | USA |
|---|---|---|---|
| White | 36.3% | 33.8% | 57.4% |
| African American | 1.6% | 5.2% | 11.9% |
| American Indian | 0.0% | 0.3% | 0.5% |
| Asian | 1.4% | 15.3% | 5.9% |
| Hawaiian | 0.1% | 0.3% | 0.2% |
| Other | 0.2% | 0.6% | 0.6% |
| Two Or More | 3.2% | 4.4% | 4.3% |
| Hispanic | 57.2% | 40.2% | 19.3% |
Gender in Colusa
See the full breakdown
Colusa is 46.8% female with 3,042 female residents.
Colusa is 53.2% male with 3,463 male residents.
| Gender | Colusa | CA | USA |
|---|---|---|---|
| Female | 46.8% | 50.1% | 50.5% |
| Male | 53.2% | 49.9% | 49.5% |
Highest level of educational attainment in Colusa for adults over 25
See the full breakdown
13.0% of adults in Colusa completed < 9th grade.
10.0% of adults in Colusa completed 9-12th grade.
27.0% of adults in Colusa completed high school / ged.
23.0% of adults in Colusa completed some college.
11.0% of adults in Colusa completed associate's degree.
11.0% of adults in Colusa completed bachelor's degree.
3.0% of adults in Colusa completed master's degree.
2.0% of adults in Colusa completed professional degree.
0.0% of adults in Colusa completed doctorate degree.
| Education | Colusa | CA | USA |
|---|---|---|---|
| < 9th Grade | 13.0% | 8.0% | 4.0% |
| 9-12th Grade | 10.0% | 7.0% | 6.0% |
| High School / GED | 27.0% | 20.0% | 26.0% |
| Some College | 23.0% | 19.0% | 19.0% |
| Associate's Degree | 11.0% | 8.0% | 9.0% |
| Bachelor's Degree | 11.0% | 23.0% | 22.0% |
| Master's Degree | 3.0% | 10.0% | 10.0% |
| Professional Degree | 2.0% | 3.0% | 2.0% |
| Doctorate Degree | 0.0% | 2.0% | 2.0% |
Household Income For Colusa, California
See the full breakdown
11.5% of households in Colusa earn Less than $10,000.
5.0% of households in Colusa earn $10,000 to $14,999.
8.8% of households in Colusa earn $15,000 to $24,999.
4.7% of households in Colusa earn $25,000 to $34,999.
8.6% of households in Colusa earn $35,000 to $49,999.
15.8% of households in Colusa earn $50,000 to $74,999.
15.9% of households in Colusa earn $75,000 to $99,999.
14.7% of households in Colusa earn $100,000 to $149,999.
8.4% of households in Colusa earn $150,000 to $199,999.
6.5% of households in Colusa earn $200,000 or more.
| Income | Colusa | CA | USA |
|---|---|---|---|
| Less than $10,000 | 11.5% | 4.5% | 5.0% |
| $10,000 to $14,999 | 5.0% | 2.9% | 3.4% |
| $15,000 to $24,999 | 8.8% | 5.0% | 6.3% |
| $25,000 to $34,999 | 4.7% | 5.3% | 6.6% |
| $35,000 to $49,999 | 8.6% | 8.1% | 10.1% |
| $50,000 to $74,999 | 15.8% | 13.0% | 15.5% |
| $75,000 to $99,999 | 15.9% | 11.6% | 12.6% |
| $100,000 to $149,999 | 14.7% | 17.8% | 17.5% |
| $150,000 to $199,999 | 8.4% | 11.3% | 9.6% |
| $200,000 or more | 6.5% | 20.5% | 13.4% |
Source: U.S. Census ACS 5-year estimates (2024)


