Eureka SnackAbility
Overall SnackAbility
Crime in Eureka summary. We use data from the FBI to determine the crime rates in Eureka. Key points include:
There were 1,067 total crimes in Eureka in the last reporting year.
The overall crime rate per 100,000 people in Eureka is 4,186.8 / 100k people.
The violent crime rate per 100,000 people in Eureka is 1,016.3 / 100k people.
The property crime rate per 100,000 people in Eureka is 3,170.5 / 100k people.
Overall, crime in Eureka is 97.56% above the national average.
Total Crimes
Above National Average
Crime In Eureka Comparison Table
| Statistic | Count Raw |
Eureka / 100k People |
California / 100k People |
National / 100k People |
|---|---|---|---|---|
| Total Crimes Per 100K | 1,067 | 4,186.8 | 2,564.5 | 2,119.2 |
| Violent Crime | 259 | 1,016.3 | 486.0 | 359.0 |
| Murder | 0 | 0.0 | 4.5 | 5.0 |
| Robbery | 58 | 227.6 | 119.1 | 61.0 |
| Aggravated Assault | 171 | 671.0 | 325.8 | 256.0 |
| Property Crime | 808 | 3,170.5 | 2,078.4 | 1,760.0 |
| Burglary | 135 | 529.7 | 305.8 | 229.0 |
| Larceny | 535 | 2,099.3 | 1,345.2 | 1,272.0 |
| Car Theft | 138 | 541.5 | 427.5 | 259.0 |
Source: FBI Uniform Crime Reporting (2024)
Cost of living in Eureka summary. We use data on the cost of living to determine how expensive it is to live in Eureka. Real estate prices drive most of the variance in cost of living around California. Key points include:
The cost of living in Eureka is 122 with 100 being average.
The cost of living in Eureka is 1.2x higher than the national average.
The median home value in Eureka is $410,992.
The median income in Eureka is $57,662.
Eureka's Overall Cost Of Living
Higher Than The National Average
Cost Of Living In Eureka Comparison Table
| Living Expense | Eureka | California | National Average |
|---|---|---|---|
| Overall | 122 | 142 | 100 |
| Services | 109 | 110 | 100 |
| Groceries | 118 | 118 | 100 |
| Health | 142 | 197 | 100 |
| Housing | 117 | 120 | 100 |
| Transportation | 121 | 121 | 100 |
| Utilities | 125 | 121 | 100 |
Source: Cost of living index, normalized to US average = 100
Eureka, CA Weather
The average high in Eureka is 64.7° and the average low is 44.7°.
There are 80.2 days of precipitation each year.
Expect an average of 54.7 inches of precipitation each year with 3.0 inches of snow.
| Stat | Eureka |
|---|---|
| Average Annual High | 64.7 |
| Average Annual Low | 44.7 |
| Annual Precipitation Days | 80.2 |
| Average Annual Precipitation | 54.7 |
| Average Annual Snowfall | 3.0 |
Average High
Days of Rain
Source: NOAA climate normals (30-year)
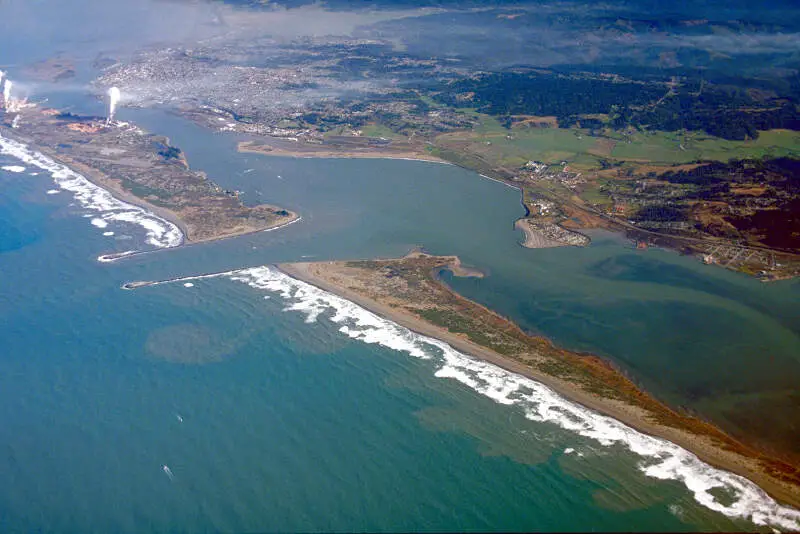
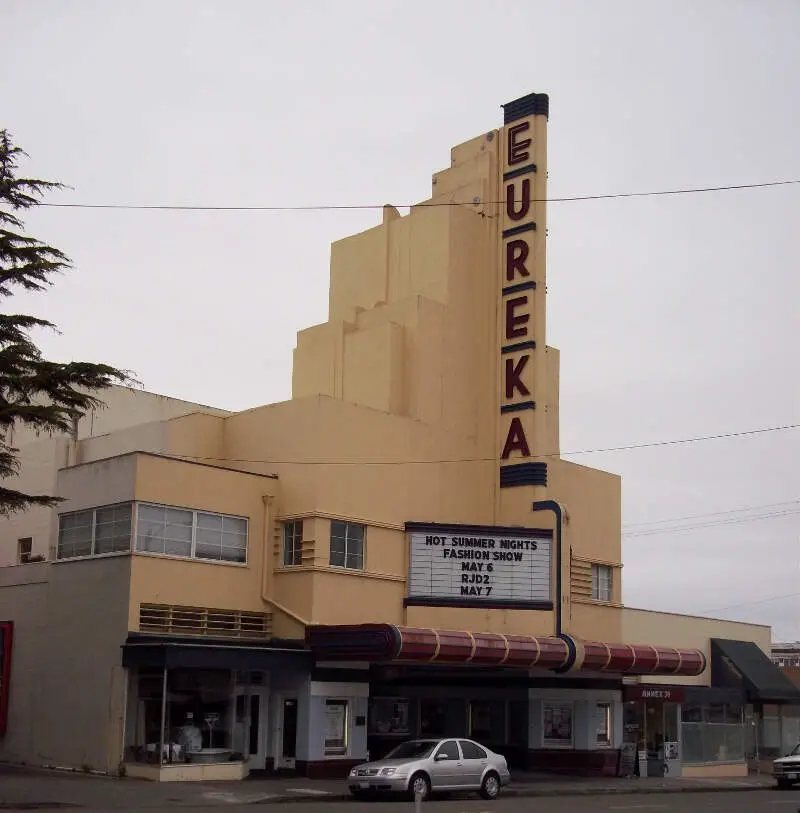
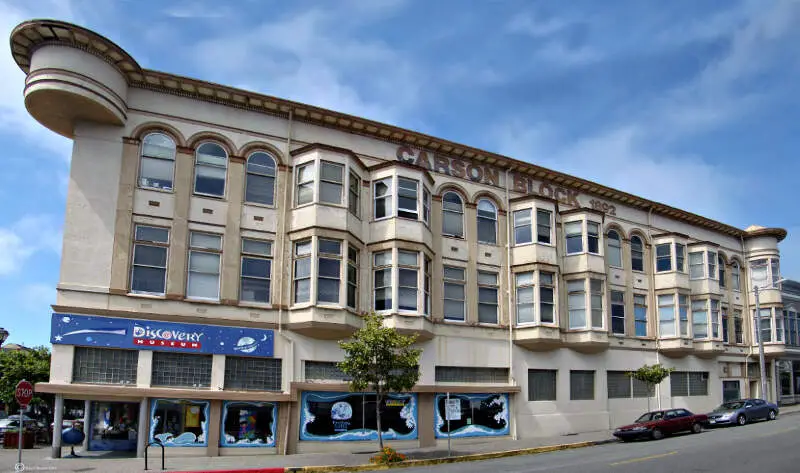
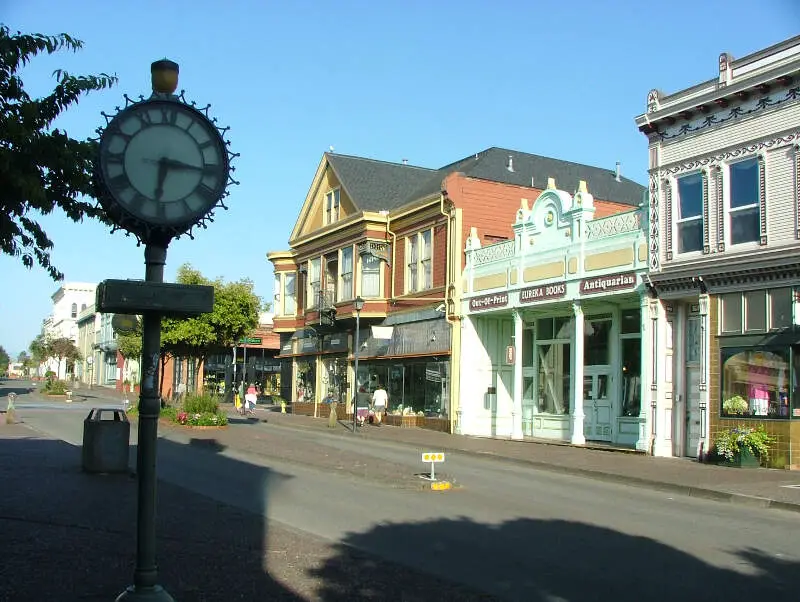
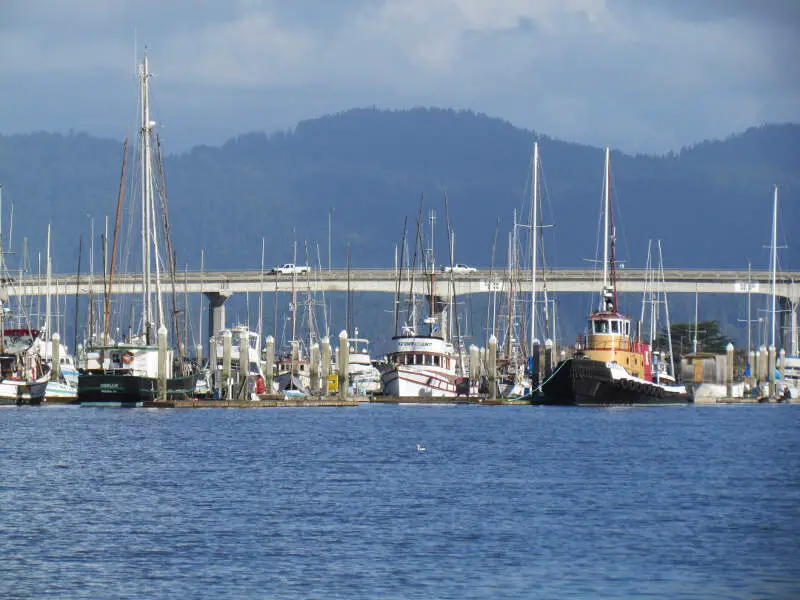
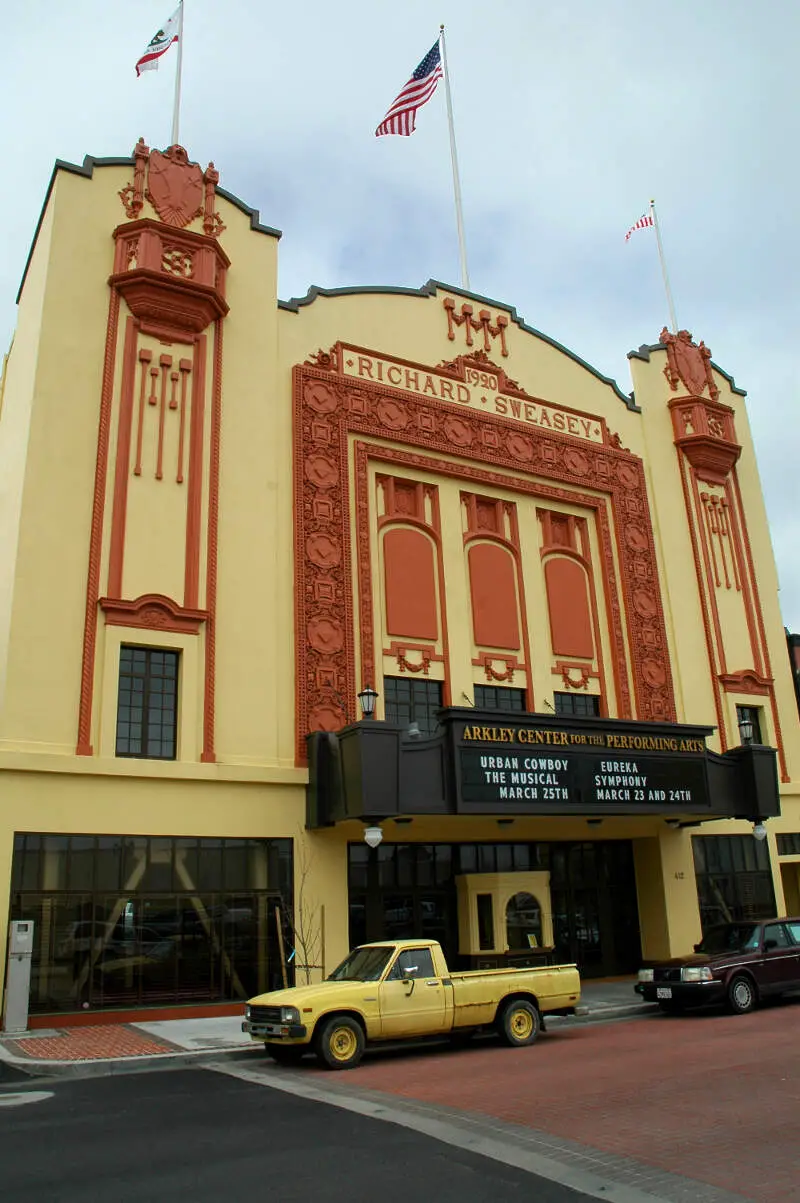
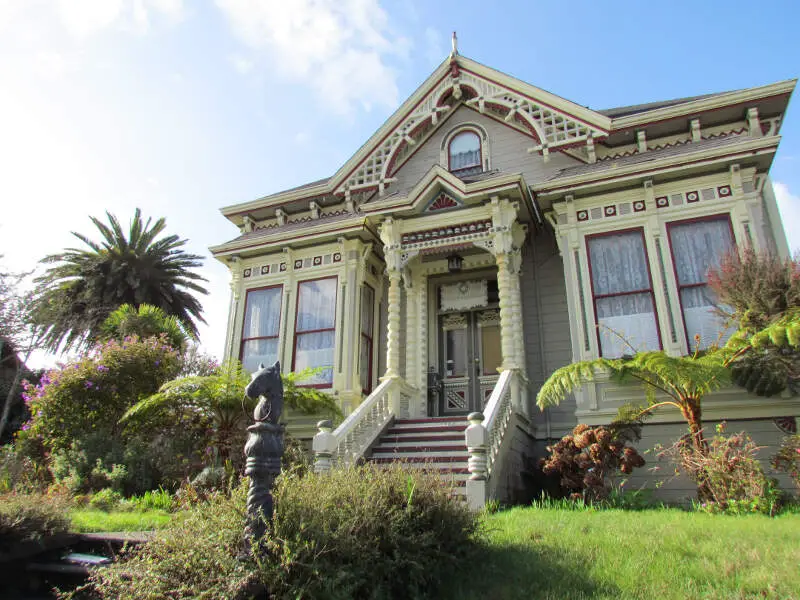
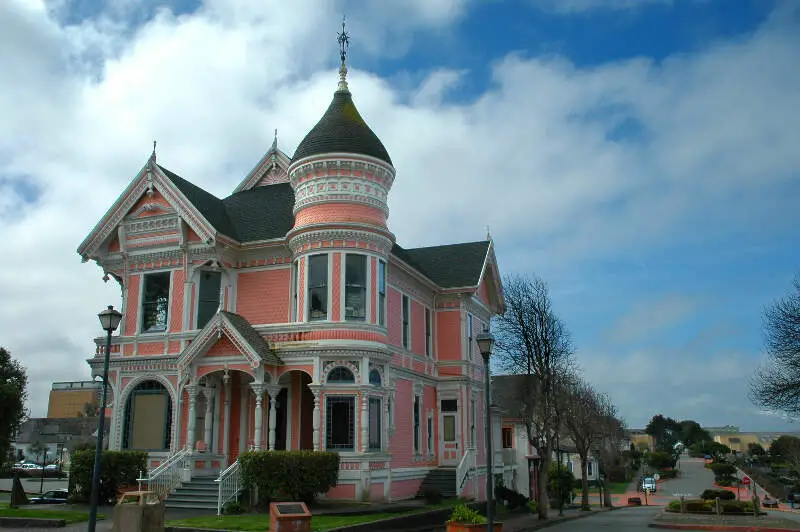
Eureka, CA Photos

1 Reviews & Comments About Eureka

I'd have to say is the worst place I have ever been to in my life: Eureka CA
I grew up there. My G*d, what a s**t hole. Beautiful scenery and surrounding areas aren't terrible, but Eureka is just atrocious. You can't even really call the people tweakers anymore, just zombies, everywhere. The sidewalks are full of passed out m**h and h****n addicts, beggars, and people screaming at the air and fighting with imaginary enemies.
I live in the high desert now and while adelanto and Hesperia aren't the nicest places, they are like Singapore compared to Eureka. I live in the Apple valley area and I really like the whole high desert region besides downtown victorville which is kind of strange and wacky but like I said is a paradise compared to Eureka.
I think growing up in Eureka was a great thing though: I hated it, but it set the bar extremely low for me in terms of expectations of a town and community. The high desert seems like s**t to many Californians because most are simply pampered in my opinion. I see the high desert as a paradise because I can actually walk on the side walk without being mistaken for a CIA operative by a tweaker zombie, or being assaulted or robbed.
Eureka is beyond what you'd call Ghetto: it's a tragedy.
Rankings & Articles For Eureka


Locations Around Eureka
Map Of Eureka, CA
Best Places Around Eureka
McKinleyville, CA
Population 17,113
Fortuna, CA
Population 12,326
Trinity, FL
Population 18,907
Arcata, CA
Population 18,607
Eureka Demographics And Statistics
Population over time in Eureka
The current population in Eureka is 26,010. The population has decreased 3.5% from 2010.
| Year | Population | % Change |
|---|---|---|
| 2024 | 26,010 | -1.1% |
| 2023 | 26,302 | -0.8% |
| 2022 | 26,519 | -0.9% |
| 2021 | 26,763 | -0.6% |
| 2020 | 26,938 | -0.1% |
| 2019 | 26,966 | -0.2% |
| 2018 | 27,020 | -0.0% |
| 2017 | 27,024 | 0.1% |
| 2016 | 27,002 | 0.1% |
| 2015 | 26,985 | -0.2% |
| 2014 | 27,039 | 0.0% |
| 2013 | 27,037 | 0.0% |
| 2012 | 27,037 | 0.0% |
| 2011 | 27,027 | 0.3% |
| 2010 | 26,954 | - |
Race / Ethnicity in Eureka
See the full breakdown
Eureka is:
64.1% White with 16,680 White residents.
2.0% African American with 516 African American residents.
1.7% American Indian with 446 American Indian residents.
5.5% Asian with 1,432 Asian residents.
0.8% Hawaiian with 215 Hawaiian residents.
0.7% Other with 182 Other residents.
9.3% Two Or More with 2,413 Two Or More residents.
15.9% Hispanic with 4,126 Hispanic residents.
| Race | Eureka | CA | USA |
|---|---|---|---|
| White | 64.1% | 33.8% | 57.4% |
| African American | 2.0% | 5.2% | 11.9% |
| American Indian | 1.7% | 0.3% | 0.5% |
| Asian | 5.5% | 15.3% | 5.9% |
| Hawaiian | 0.8% | 0.3% | 0.2% |
| Other | 0.7% | 0.6% | 0.6% |
| Two Or More | 9.3% | 4.4% | 4.3% |
| Hispanic | 15.9% | 40.2% | 19.3% |
Gender in Eureka
See the full breakdown
Eureka is 49.8% female with 12,949 female residents.
Eureka is 50.2% male with 13,061 male residents.
| Gender | Eureka | CA | USA |
|---|---|---|---|
| Female | 49.8% | 50.1% | 50.5% |
| Male | 50.2% | 49.9% | 49.5% |
Highest level of educational attainment in Eureka for adults over 25
See the full breakdown
6.0% of adults in Eureka completed < 9th grade.
5.0% of adults in Eureka completed 9-12th grade.
23.0% of adults in Eureka completed high school / ged.
27.0% of adults in Eureka completed some college.
10.0% of adults in Eureka completed associate's degree.
20.0% of adults in Eureka completed bachelor's degree.
7.0% of adults in Eureka completed master's degree.
1.0% of adults in Eureka completed professional degree.
1.0% of adults in Eureka completed doctorate degree.
| Education | Eureka | CA | USA |
|---|---|---|---|
| < 9th Grade | 6.0% | 8.0% | 4.0% |
| 9-12th Grade | 5.0% | 7.0% | 6.0% |
| High School / GED | 23.0% | 20.0% | 26.0% |
| Some College | 27.0% | 19.0% | 19.0% |
| Associate's Degree | 10.0% | 8.0% | 9.0% |
| Bachelor's Degree | 20.0% | 23.0% | 22.0% |
| Master's Degree | 7.0% | 10.0% | 10.0% |
| Professional Degree | 1.0% | 3.0% | 2.0% |
| Doctorate Degree | 1.0% | 2.0% | 2.0% |
Household Income For Eureka, California
See the full breakdown
5.2% of households in Eureka earn Less than $10,000.
5.2% of households in Eureka earn $10,000 to $14,999.
9.2% of households in Eureka earn $15,000 to $24,999.
9.3% of households in Eureka earn $25,000 to $34,999.
14.2% of households in Eureka earn $35,000 to $49,999.
18.7% of households in Eureka earn $50,000 to $74,999.
10.2% of households in Eureka earn $75,000 to $99,999.
15.4% of households in Eureka earn $100,000 to $149,999.
6.7% of households in Eureka earn $150,000 to $199,999.
5.8% of households in Eureka earn $200,000 or more.
| Income | Eureka | CA | USA |
|---|---|---|---|
| Less than $10,000 | 5.2% | 4.5% | 5.0% |
| $10,000 to $14,999 | 5.2% | 2.9% | 3.4% |
| $15,000 to $24,999 | 9.2% | 5.0% | 6.3% |
| $25,000 to $34,999 | 9.3% | 5.3% | 6.6% |
| $35,000 to $49,999 | 14.2% | 8.1% | 10.1% |
| $50,000 to $74,999 | 18.7% | 13.0% | 15.5% |
| $75,000 to $99,999 | 10.2% | 11.6% | 12.6% |
| $100,000 to $149,999 | 15.4% | 17.8% | 17.5% |
| $150,000 to $199,999 | 6.7% | 11.3% | 9.6% |
| $200,000 or more | 5.8% | 20.5% | 13.4% |
Source: U.S. Census ACS 5-year estimates (2024)


