Glendale SnackAbility
Overall SnackAbility
Crime in Glendale summary. We use data from the FBI to determine the crime rates in Glendale. Key points include:
There were 4,262 total crimes in Glendale in the last reporting year.
The overall crime rate per 100,000 people in Glendale is 2,314.0 / 100k people.
The violent crime rate per 100,000 people in Glendale is 287.2 / 100k people.
The property crime rate per 100,000 people in Glendale is 2,026.8 / 100k people.
Overall, crime in Glendale is 9.19% above the national average.
Total Crimes
Above National Average
Crime In Glendale Comparison Table
| Statistic | Count Raw |
Glendale / 100k People |
California / 100k People |
National / 100k People |
|---|---|---|---|---|
| Total Crimes Per 100K | 4,262 | 2,314.0 | 2,564.5 | 2,119.2 |
| Violent Crime | 529 | 287.2 | 486.0 | 359.0 |
| Murder | 4 | 2.2 | 4.5 | 5.0 |
| Robbery | 172 | 93.4 | 119.1 | 61.0 |
| Aggravated Assault | 319 | 173.2 | 325.8 | 256.0 |
| Property Crime | 3,733 | 2,026.8 | 2,078.4 | 1,760.0 |
| Burglary | 372 | 202.0 | 305.8 | 229.0 |
| Larceny | 2,937 | 1,594.6 | 1,345.2 | 1,272.0 |
| Car Theft | 424 | 230.2 | 427.5 | 259.0 |
Source: FBI Uniform Crime Reporting (2024)
Cost of living in Glendale summary. We use data on the cost of living to determine how expensive it is to live in Glendale. Real estate prices drive most of the variance in cost of living around California. Key points include:
The cost of living in Glendale is 195 with 100 being average.
The cost of living in Glendale is 1.9x higher than the national average.
The median home value in Glendale is $1,201,879.
The median income in Glendale is $88,393.
Glendale's Overall Cost Of Living
Higher Than The National Average
Cost Of Living In Glendale Comparison Table
| Living Expense | Glendale | California | National Average |
|---|---|---|---|
| Overall | 195 | 142 | 100 |
| Services | 111 | 110 | 100 |
| Groceries | 116 | 118 | 100 |
| Health | 372 | 197 | 100 |
| Housing | 118 | 120 | 100 |
| Transportation | 121 | 121 | 100 |
| Utilities | 127 | 121 | 100 |
Source: Cost of living index, normalized to US average = 100
Glendale, CA Weather
The average high in Glendale is 75.3° and the average low is 54.1°.
There are 22.7 days of precipitation each year.
Expect an average of 16.2 inches of precipitation each year with 0.2 inches of snow.
| Stat | Glendale |
|---|---|
| Average Annual High | 75.3 |
| Average Annual Low | 54.1 |
| Annual Precipitation Days | 22.7 |
| Average Annual Precipitation | 16.2 |
| Average Annual Snowfall | 0.2 |
Average High
Days of Rain
Source: NOAA climate normals (30-year)
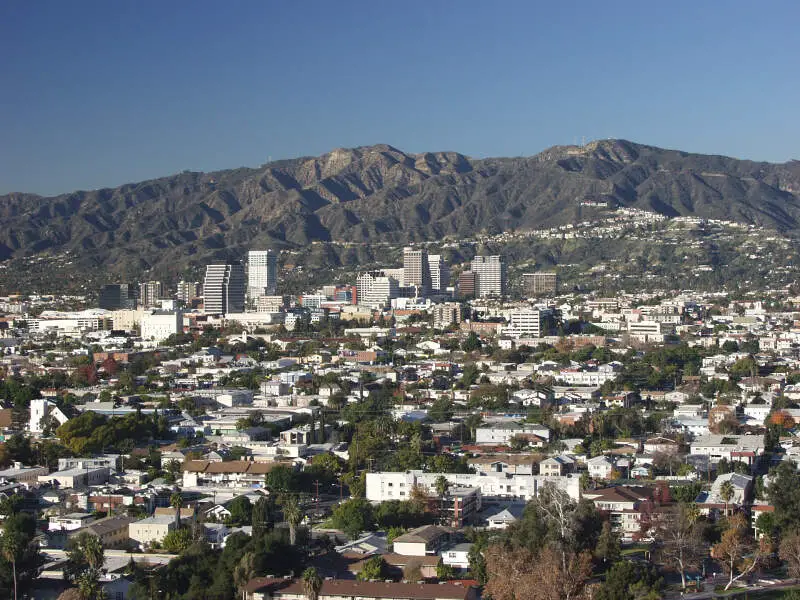
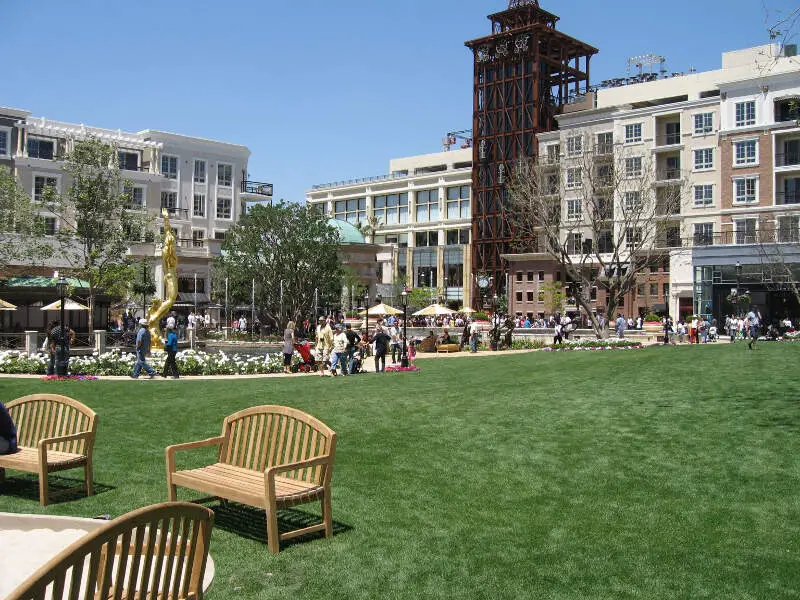
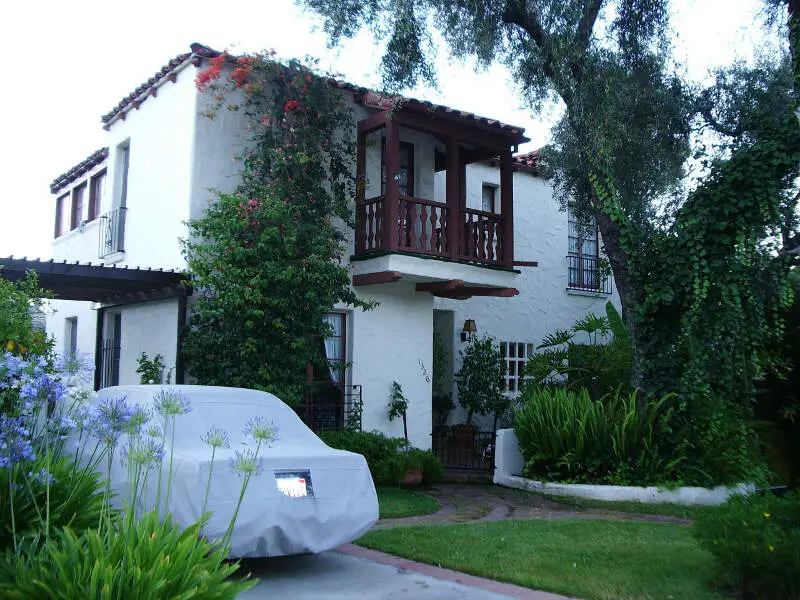
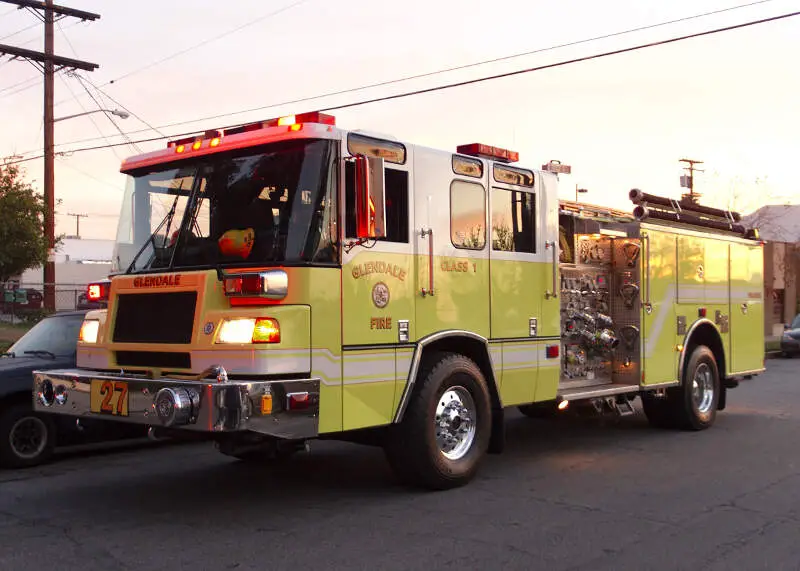
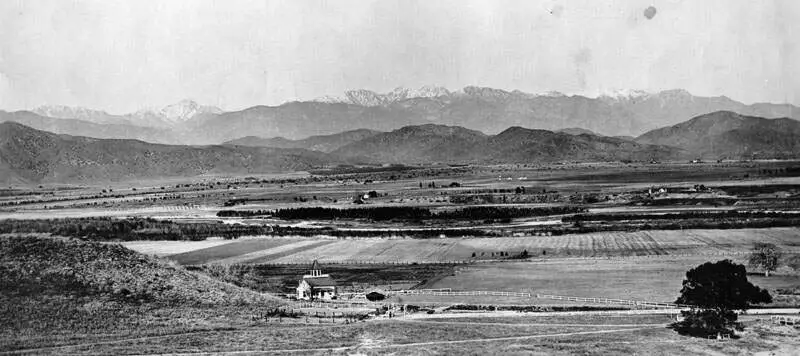
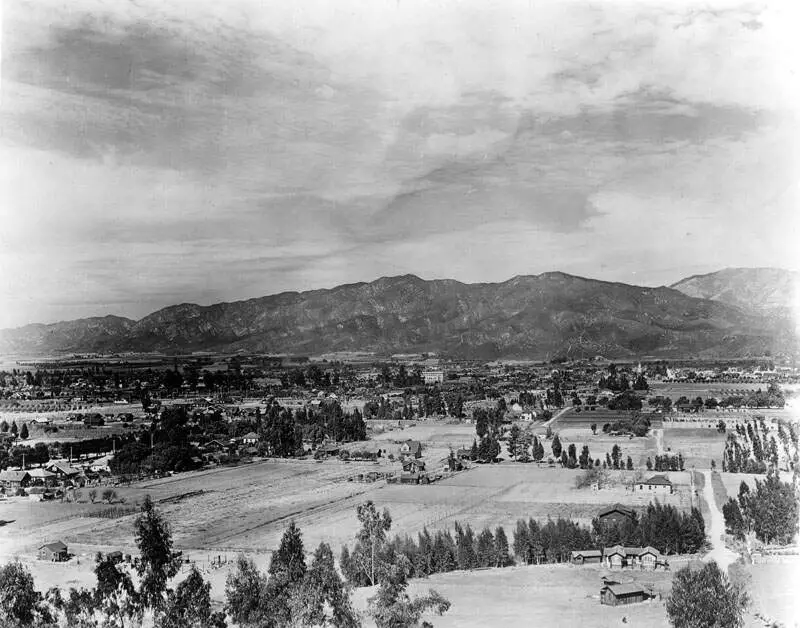
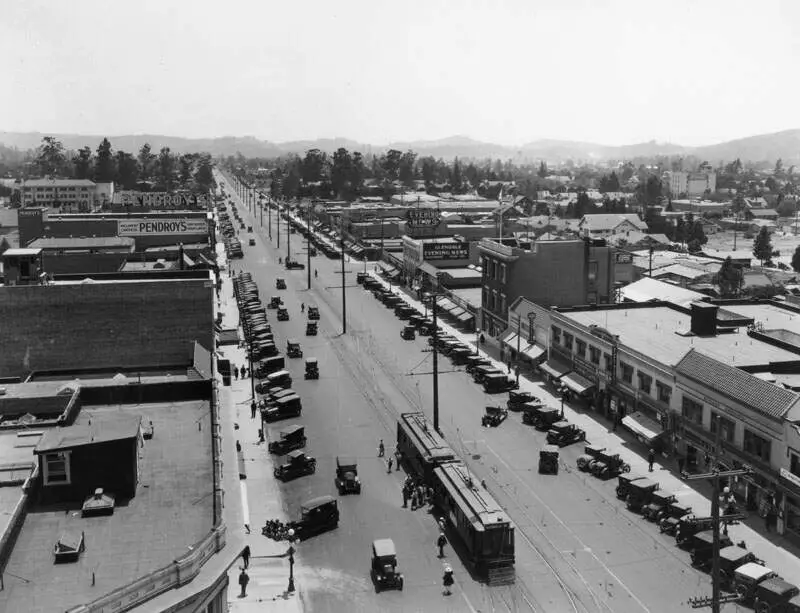
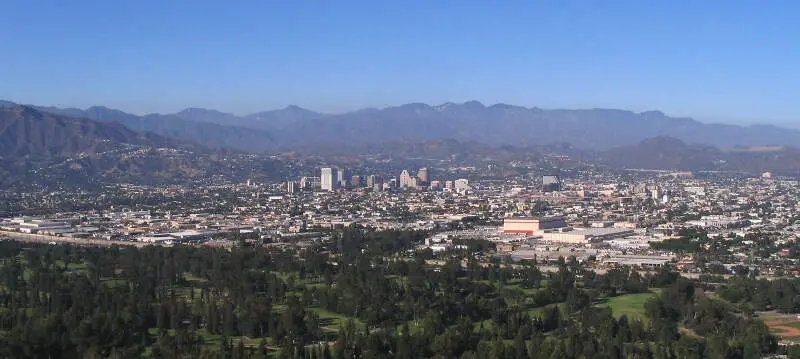
Glendale, CA Photos
Rankings & Articles For Glendale


Locations Around Glendale
Map Of Glendale, CA
Best Places Around Glendale
Del Aire, CA
Population 11,115
Vincent, CA
Population 15,340
West Puente Valley, CA
Population 22,495
South Monrovia Island, CA
Population 6,830
Avocado Heights, CA
Population 12,593
San Fernando, CA
Population 23,632
La Crescenta-Montrose, CA
Population 19,660
South Pasadena, CA
Population 26,068
West Whittier-Los Nietos, CA
Population 25,615
Altadena, CA
Population 41,705
Glendale Demographics And Statistics
Population over time in Glendale
The current population in Glendale is 190,748. The population has decreased 0.8% from 2010.
| Year | Population | % Change |
|---|---|---|
| 2024 | 190,748 | -0.8% |
| 2023 | 192,270 | -1.2% |
| 2022 | 194,512 | -1.0% |
| 2021 | 196,512 | -1.4% |
| 2020 | 199,357 | -0.4% |
| 2019 | 200,232 | -0.1% |
| 2018 | 200,372 | 0.3% |
| 2017 | 199,750 | 0.9% |
| 2016 | 197,895 | 0.5% |
| 2015 | 196,984 | 0.8% |
| 2014 | 195,380 | 1.0% |
| 2013 | 193,381 | 0.4% |
| 2012 | 192,537 | 0.2% |
| 2011 | 192,069 | -0.1% |
| 2010 | 192,190 | - |
Race / Ethnicity in Glendale
See the full breakdown
Glendale is:
62.8% White with 119,810 White residents.
1.4% African American with 2,584 African American residents.
0.0% American Indian with 87 American Indian residents.
12.8% Asian with 24,369 Asian residents.
0.1% Hawaiian with 200 Hawaiian residents.
0.6% Other with 1,097 Other residents.
4.2% Two Or More with 7,981 Two Or More residents.
18.1% Hispanic with 34,620 Hispanic residents.
| Race | Glendale | CA | USA |
|---|---|---|---|
| White | 62.8% | 33.8% | 57.4% |
| African American | 1.4% | 5.2% | 11.9% |
| American Indian | 0.0% | 0.3% | 0.5% |
| Asian | 12.8% | 15.3% | 5.9% |
| Hawaiian | 0.1% | 0.3% | 0.2% |
| Other | 0.6% | 0.6% | 0.6% |
| Two Or More | 4.2% | 4.4% | 4.3% |
| Hispanic | 18.1% | 40.2% | 19.3% |
Gender in Glendale
See the full breakdown
Glendale is 51.6% female with 98,396 female residents.
Glendale is 48.4% male with 92,351 male residents.
| Gender | Glendale | CA | USA |
|---|---|---|---|
| Female | 51.6% | 50.1% | 50.5% |
| Male | 48.4% | 49.9% | 49.5% |
Highest level of educational attainment in Glendale for adults over 25
See the full breakdown
5.0% of adults in Glendale completed < 9th grade.
4.0% of adults in Glendale completed 9-12th grade.
20.0% of adults in Glendale completed high school / ged.
14.0% of adults in Glendale completed some college.
9.0% of adults in Glendale completed associate's degree.
30.0% of adults in Glendale completed bachelor's degree.
12.0% of adults in Glendale completed master's degree.
4.0% of adults in Glendale completed professional degree.
2.0% of adults in Glendale completed doctorate degree.
| Education | Glendale | CA | USA |
|---|---|---|---|
| < 9th Grade | 5.0% | 8.0% | 4.0% |
| 9-12th Grade | 4.0% | 7.0% | 6.0% |
| High School / GED | 20.0% | 20.0% | 26.0% |
| Some College | 14.0% | 19.0% | 19.0% |
| Associate's Degree | 9.0% | 8.0% | 9.0% |
| Bachelor's Degree | 30.0% | 23.0% | 22.0% |
| Master's Degree | 12.0% | 10.0% | 10.0% |
| Professional Degree | 4.0% | 3.0% | 2.0% |
| Doctorate Degree | 2.0% | 2.0% | 2.0% |
Household Income For Glendale, California
See the full breakdown
5.3% of households in Glendale earn Less than $10,000.
5.2% of households in Glendale earn $10,000 to $14,999.
6.6% of households in Glendale earn $15,000 to $24,999.
5.5% of households in Glendale earn $25,000 to $34,999.
8.5% of households in Glendale earn $35,000 to $49,999.
12.4% of households in Glendale earn $50,000 to $74,999.
11.8% of households in Glendale earn $75,000 to $99,999.
15.1% of households in Glendale earn $100,000 to $149,999.
10.9% of households in Glendale earn $150,000 to $199,999.
18.7% of households in Glendale earn $200,000 or more.
| Income | Glendale | CA | USA |
|---|---|---|---|
| Less than $10,000 | 5.3% | 4.5% | 5.0% |
| $10,000 to $14,999 | 5.2% | 2.9% | 3.4% |
| $15,000 to $24,999 | 6.6% | 5.0% | 6.3% |
| $25,000 to $34,999 | 5.5% | 5.3% | 6.6% |
| $35,000 to $49,999 | 8.5% | 8.1% | 10.1% |
| $50,000 to $74,999 | 12.4% | 13.0% | 15.5% |
| $75,000 to $99,999 | 11.8% | 11.6% | 12.6% |
| $100,000 to $149,999 | 15.1% | 17.8% | 17.5% |
| $150,000 to $199,999 | 10.9% | 11.3% | 9.6% |
| $200,000 or more | 18.7% | 20.5% | 13.4% |
Source: U.S. Census ACS 5-year estimates (2024)


