Hemet SnackAbility
Overall SnackAbility
Crime in Hemet summary. We use data from the FBI to determine the crime rates in Hemet. Key points include:
There were 1,919 total crimes in Hemet in the last reporting year.
The overall crime rate per 100,000 people in Hemet is 2,058.7 / 100k people.
The violent crime rate per 100,000 people in Hemet is 424.8 / 100k people.
The property crime rate per 100,000 people in Hemet is 1,633.9 / 100k people.
Overall, crime in Hemet is -2.85% below the national average.
Total Crimes
Below National Average
Crime In Hemet Comparison Table
| Statistic | Count Raw |
Hemet / 100k People |
California / 100k People |
National / 100k People |
|---|---|---|---|---|
| Total Crimes Per 100K | 1,919 | 2,058.7 | 2,564.5 | 2,119.2 |
| Violent Crime | 396 | 424.8 | 486.0 | 359.0 |
| Murder | 4 | 4.3 | 4.5 | 5.0 |
| Robbery | 92 | 98.7 | 119.1 | 61.0 |
| Aggravated Assault | 267 | 286.4 | 325.8 | 256.0 |
| Property Crime | 1,523 | 1,633.9 | 2,078.4 | 1,760.0 |
| Burglary | 158 | 169.5 | 305.8 | 229.0 |
| Larceny | 1,135 | 1,217.7 | 1,345.2 | 1,272.0 |
| Car Theft | 230 | 246.7 | 427.5 | 259.0 |
Source: FBI Uniform Crime Reporting (2024)
Cost of living in Hemet summary. We use data on the cost of living to determine how expensive it is to live in Hemet. Real estate prices drive most of the variance in cost of living around California. Key points include:
The cost of living in Hemet is 120 with 100 being average.
The cost of living in Hemet is 1.2x higher than the national average.
The median home value in Hemet is $444,333.
The median income in Hemet is $57,719.
Hemet's Overall Cost Of Living
Higher Than The National Average
Cost Of Living In Hemet Comparison Table
| Living Expense | Hemet | California | National Average |
|---|---|---|---|
| Overall | 120 | 142 | 100 |
| Services | 110 | 110 | 100 |
| Groceries | 118 | 118 | 100 |
| Health | 120 | 197 | 100 |
| Housing | 113 | 120 | 100 |
| Transportation | 119 | 121 | 100 |
| Utilities | 125 | 121 | 100 |
Source: Cost of living index, normalized to US average = 100
Hemet, CA Weather
The average high in Hemet is 81.2° and the average low is 52.0°.
There are 18.0 days of precipitation each year.
Expect an average of 10.0 inches of precipitation each year with 1.7 inches of snow.
| Stat | Hemet |
|---|---|
| Average Annual High | 81.2 |
| Average Annual Low | 52.0 |
| Annual Precipitation Days | 18.0 |
| Average Annual Precipitation | 10.0 |
| Average Annual Snowfall | 1.7 |
Average High
Days of Rain
Source: NOAA climate normals (30-year)
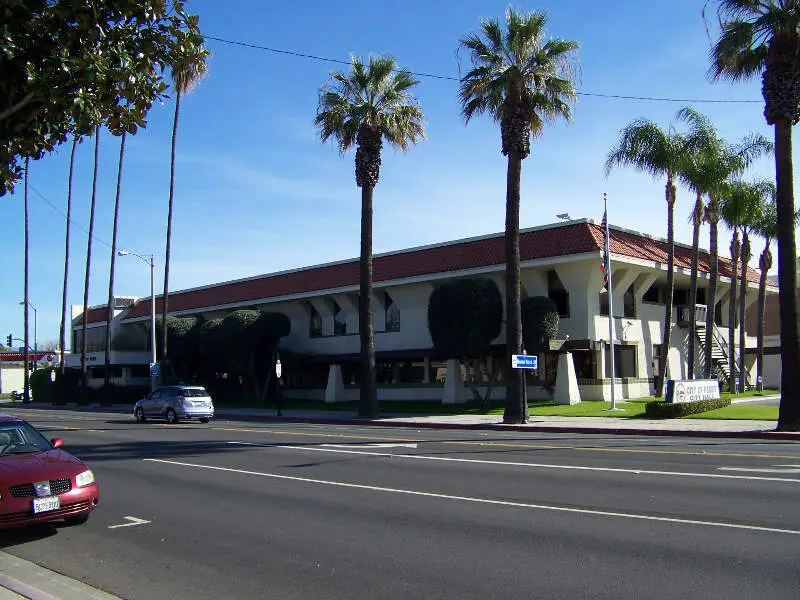
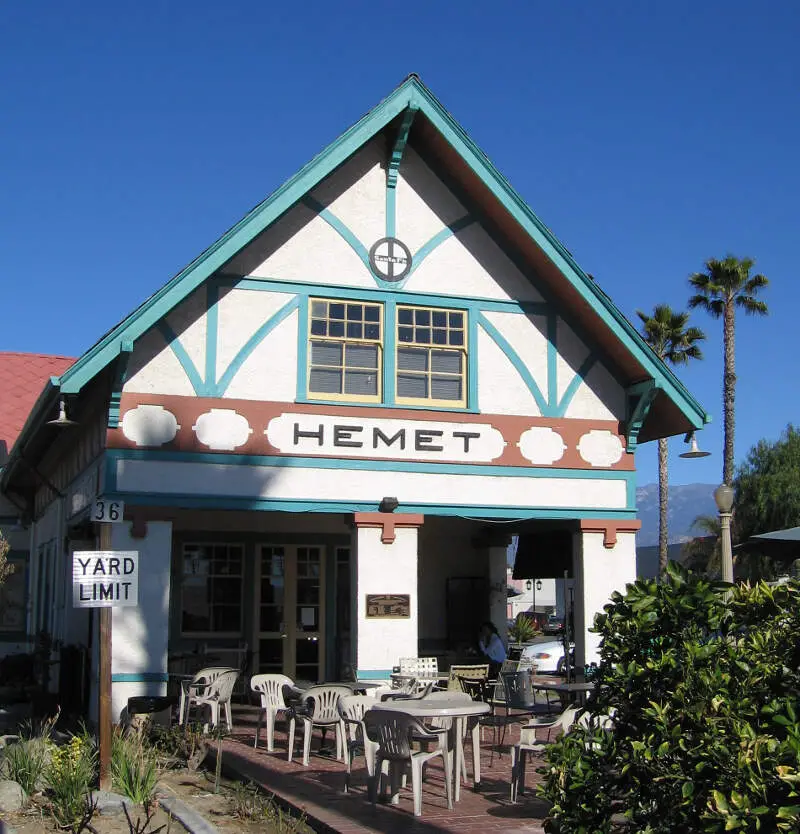
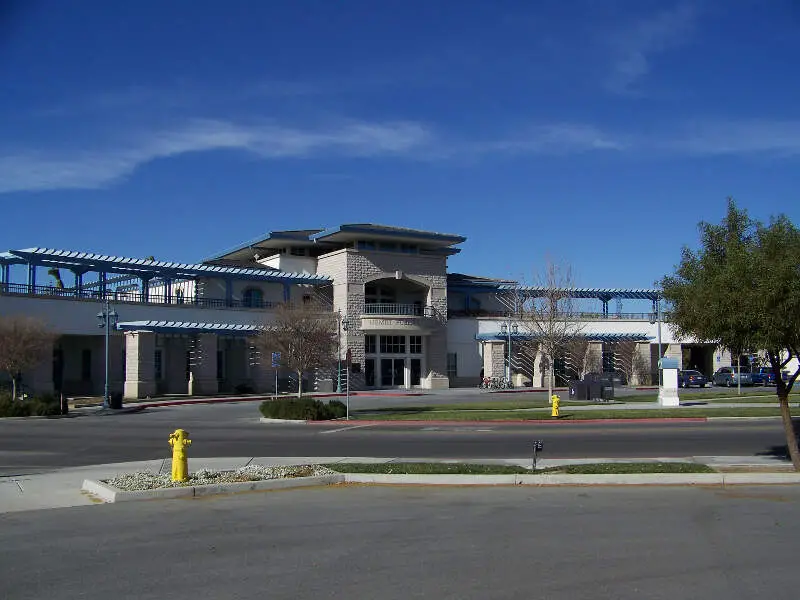
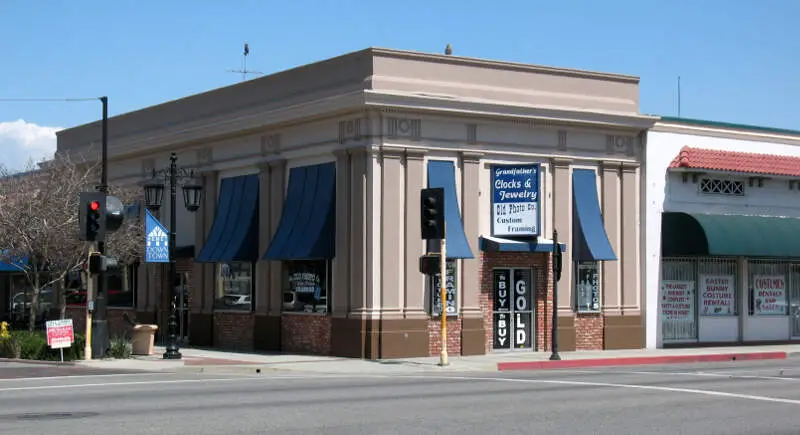
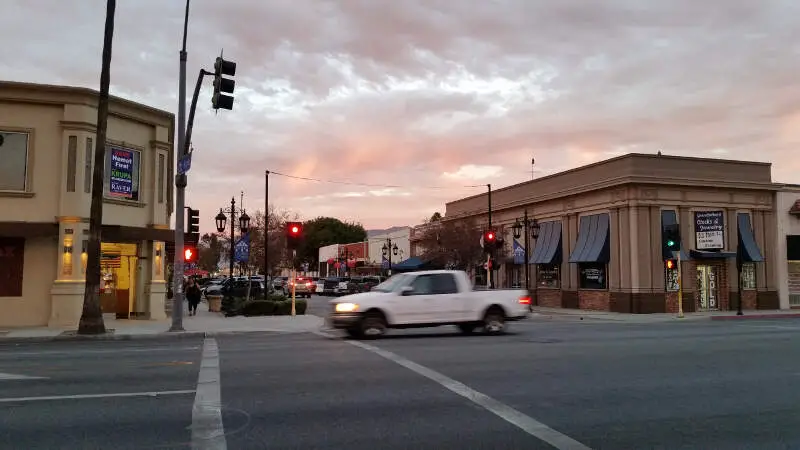
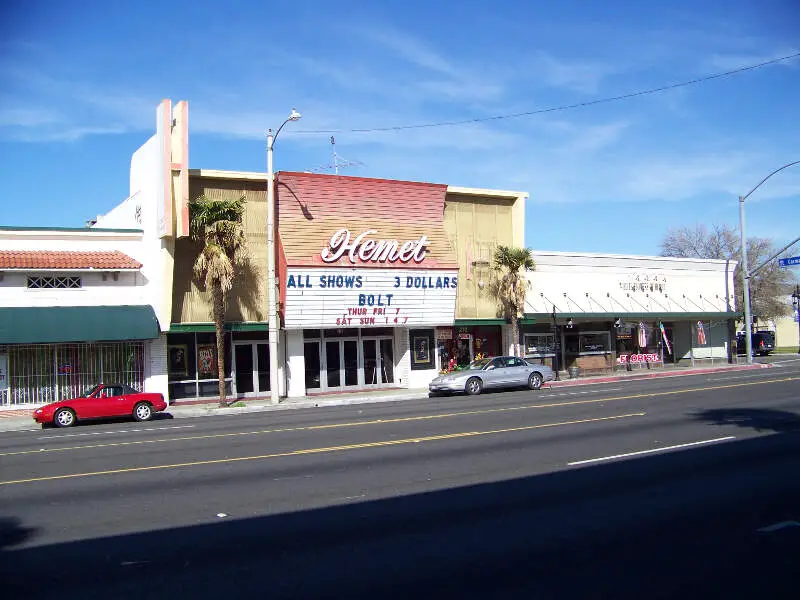
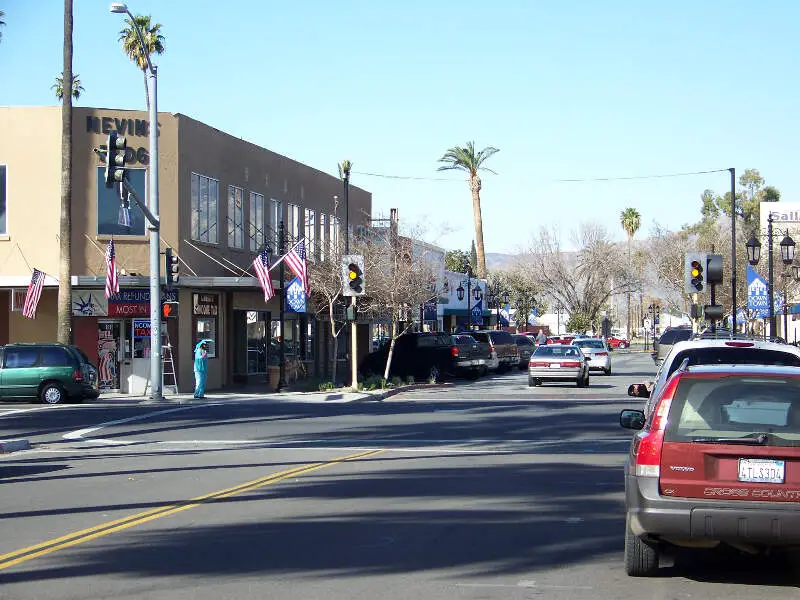
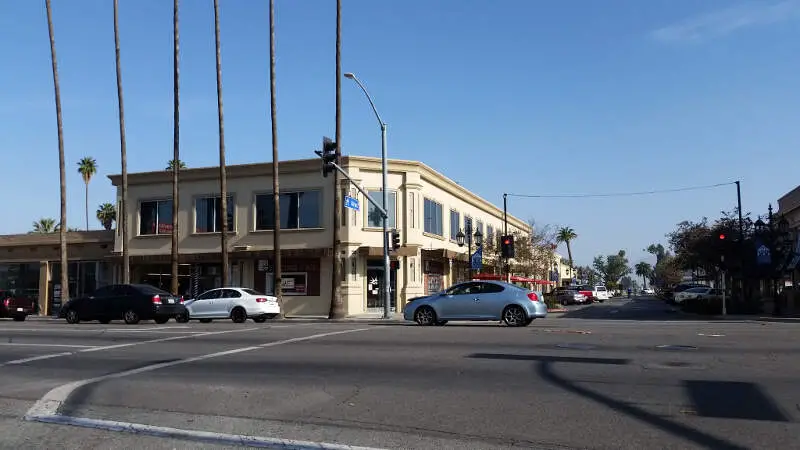
Hemet, CA Photos
1 Reviews & Comments About Hemet

I have lived in Hemet for 35 years. It is a pretty good size city. Size wise. Everything from A to Z. Orange groves. Big Lake. Farms. Horses. Nice schools. Lots of nice shopping nearby.
Very affordable. Now the bad part. Water rates and taxes are high. Drugs. Unemployment.|
Rankings & Articles For Hemet


Locations Around Hemet
Map Of Hemet, CA
Best Places Around Hemet
Temecula, CA
Population 111,167
Murrieta, CA
Population 112,064
French Valley, CA
Population 45,269
Cherry Valley, CA
Population 6,668
Canyon Lake, CA
Population 11,119
Nuevo, CA
Population 6,803
East Hemet, CA
Population 20,257
Moreno Valley, CA
Population 211,666
Beaumont, CA
Population 56,266
Mead Valley, CA
Population 19,286
Hemet Demographics And Statistics
Population over time in Hemet
The current population in Hemet is 91,326. The population has increased 19.5% from 2010.
| Year | Population | % Change |
|---|---|---|
| 2024 | 91,326 | 0.8% |
| 2023 | 90,646 | 1.1% |
| 2022 | 89,651 | 0.8% |
| 2021 | 88,903 | 5.0% |
| 2020 | 84,686 | 0.2% |
| 2019 | 84,542 | 0.6% |
| 2018 | 84,069 | 0.6% |
| 2017 | 83,604 | 1.0% |
| 2016 | 82,748 | 0.8% |
| 2015 | 82,118 | 1.1% |
| 2014 | 81,203 | 1.5% |
| 2013 | 79,986 | 1.5% |
| 2012 | 78,833 | 1.4% |
| 2011 | 77,752 | 1.8% |
| 2010 | 76,403 | - |
Race / Ethnicity in Hemet
See the full breakdown
Hemet is:
32.7% White with 29,901 White residents.
9.8% African American with 8,992 African American residents.
0.8% American Indian with 707 American Indian residents.
3.4% Asian with 3,114 Asian residents.
0.1% Hawaiian with 115 Hawaiian residents.
0.5% Other with 437 Other residents.
4.5% Two Or More with 4,068 Two Or More residents.
48.2% Hispanic with 43,992 Hispanic residents.
| Race | Hemet | CA | USA |
|---|---|---|---|
| White | 32.7% | 33.8% | 57.4% |
| African American | 9.8% | 5.2% | 11.9% |
| American Indian | 0.8% | 0.3% | 0.5% |
| Asian | 3.4% | 15.3% | 5.9% |
| Hawaiian | 0.1% | 0.3% | 0.2% |
| Other | 0.5% | 0.6% | 0.6% |
| Two Or More | 4.5% | 4.4% | 4.3% |
| Hispanic | 48.2% | 40.2% | 19.3% |
Gender in Hemet
See the full breakdown
Hemet is 51.4% female with 46,952 female residents.
Hemet is 48.6% male with 44,374 male residents.
| Gender | Hemet | CA | USA |
|---|---|---|---|
| Female | 51.4% | 50.1% | 50.5% |
| Male | 48.6% | 49.9% | 49.5% |
Highest level of educational attainment in Hemet for adults over 25
See the full breakdown
7.0% of adults in Hemet completed < 9th grade.
11.0% of adults in Hemet completed 9-12th grade.
32.0% of adults in Hemet completed high school / ged.
26.0% of adults in Hemet completed some college.
8.0% of adults in Hemet completed associate's degree.
11.0% of adults in Hemet completed bachelor's degree.
4.0% of adults in Hemet completed master's degree.
1.0% of adults in Hemet completed professional degree.
0.0% of adults in Hemet completed doctorate degree.
| Education | Hemet | CA | USA |
|---|---|---|---|
| < 9th Grade | 7.0% | 8.0% | 4.0% |
| 9-12th Grade | 11.0% | 7.0% | 6.0% |
| High School / GED | 32.0% | 20.0% | 26.0% |
| Some College | 26.0% | 19.0% | 19.0% |
| Associate's Degree | 8.0% | 8.0% | 9.0% |
| Bachelor's Degree | 11.0% | 23.0% | 22.0% |
| Master's Degree | 4.0% | 10.0% | 10.0% |
| Professional Degree | 1.0% | 3.0% | 2.0% |
| Doctorate Degree | 0.0% | 2.0% | 2.0% |
Household Income For Hemet, California
See the full breakdown
6.7% of households in Hemet earn Less than $10,000.
3.8% of households in Hemet earn $10,000 to $14,999.
9.4% of households in Hemet earn $15,000 to $24,999.
9.4% of households in Hemet earn $25,000 to $34,999.
13.9% of households in Hemet earn $35,000 to $49,999.
17.8% of households in Hemet earn $50,000 to $74,999.
12.5% of households in Hemet earn $75,000 to $99,999.
13.7% of households in Hemet earn $100,000 to $149,999.
6.3% of households in Hemet earn $150,000 to $199,999.
6.5% of households in Hemet earn $200,000 or more.
| Income | Hemet | CA | USA |
|---|---|---|---|
| Less than $10,000 | 6.7% | 4.5% | 5.0% |
| $10,000 to $14,999 | 3.8% | 2.9% | 3.4% |
| $15,000 to $24,999 | 9.4% | 5.0% | 6.3% |
| $25,000 to $34,999 | 9.4% | 5.3% | 6.6% |
| $35,000 to $49,999 | 13.9% | 8.1% | 10.1% |
| $50,000 to $74,999 | 17.8% | 13.0% | 15.5% |
| $75,000 to $99,999 | 12.5% | 11.6% | 12.6% |
| $100,000 to $149,999 | 13.7% | 17.8% | 17.5% |
| $150,000 to $199,999 | 6.3% | 11.3% | 9.6% |
| $200,000 or more | 6.5% | 20.5% | 13.4% |
Source: U.S. Census ACS 5-year estimates (2024)


