Lake Elsinore SnackAbility
Overall SnackAbility
Crime in Lake Elsinore summary. We use data from the FBI to determine the crime rates in Lake Elsinore. Key points include:
There were 1,497 total crimes in Lake Elsinore in the last reporting year.
The overall crime rate per 100,000 people in Lake Elsinore is 2,026.5 / 100k people.
The violent crime rate per 100,000 people in Lake Elsinore is 173.3 / 100k people.
The property crime rate per 100,000 people in Lake Elsinore is 1,853.2 / 100k people.
Overall, crime in Lake Elsinore is -4.38% below the national average.
Total Crimes
Below National Average
Crime In Lake Elsinore Comparison Table
| Statistic | Count Raw |
Lake Elsinore / 100k People |
California / 100k People |
National / 100k People |
|---|---|---|---|---|
| Total Crimes Per 100K | 1,497 | 2,026.5 | 2,564.5 | 2,119.2 |
| Violent Crime | 128 | 173.3 | 486.0 | 359.0 |
| Murder | 2 | 2.7 | 4.5 | 5.0 |
| Robbery | 49 | 66.3 | 119.1 | 61.0 |
| Aggravated Assault | 68 | 92.1 | 325.8 | 256.0 |
| Property Crime | 1,369 | 1,853.2 | 2,078.4 | 1,760.0 |
| Burglary | 146 | 197.6 | 305.8 | 229.0 |
| Larceny | 1,067 | 1,444.4 | 1,345.2 | 1,272.0 |
| Car Theft | 156 | 211.2 | 427.5 | 259.0 |
Source: FBI Uniform Crime Reporting (2024)
Cost of living in Lake Elsinore summary. We use data on the cost of living to determine how expensive it is to live in Lake Elsinore. Real estate prices drive most of the variance in cost of living around California. Key points include:
The cost of living in Lake Elsinore is 139 with 100 being average.
The cost of living in Lake Elsinore is 1.4x higher than the national average.
The median home value in Lake Elsinore is $586,598.
The median income in Lake Elsinore is $101,888.
Lake Elsinore's Overall Cost Of Living
Higher Than The National Average
Cost Of Living In Lake Elsinore Comparison Table
| Living Expense | Lake Elsinore | California | National Average |
|---|---|---|---|
| Overall | 139 | 142 | 100 |
| Services | 110 | 110 | 100 |
| Groceries | 116 | 118 | 100 |
| Health | 193 | 197 | 100 |
| Housing | 118 | 120 | 100 |
| Transportation | 120 | 121 | 100 |
| Utilities | 118 | 121 | 100 |
Source: Cost of living index, normalized to US average = 100
Lake Elsinore, CA Weather
The average high in Lake Elsinore is 81.2° and the average low is 52.0°.
There are 18.0 days of precipitation each year.
Expect an average of 10.0 inches of precipitation each year with 1.7 inches of snow.
| Stat | Lake Elsinore |
|---|---|
| Average Annual High | 81.2 |
| Average Annual Low | 52.0 |
| Annual Precipitation Days | 18.0 |
| Average Annual Precipitation | 10.0 |
| Average Annual Snowfall | 1.7 |
Average High
Days of Rain
Source: NOAA climate normals (30-year)
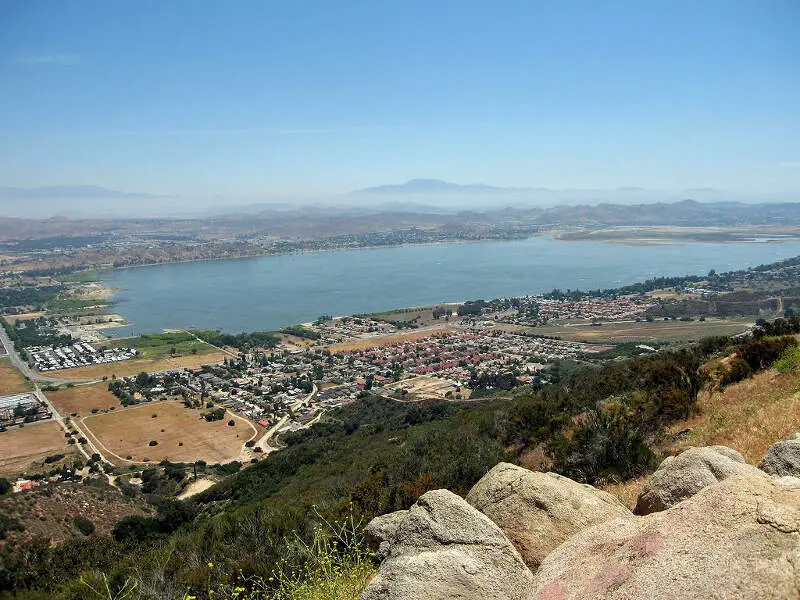
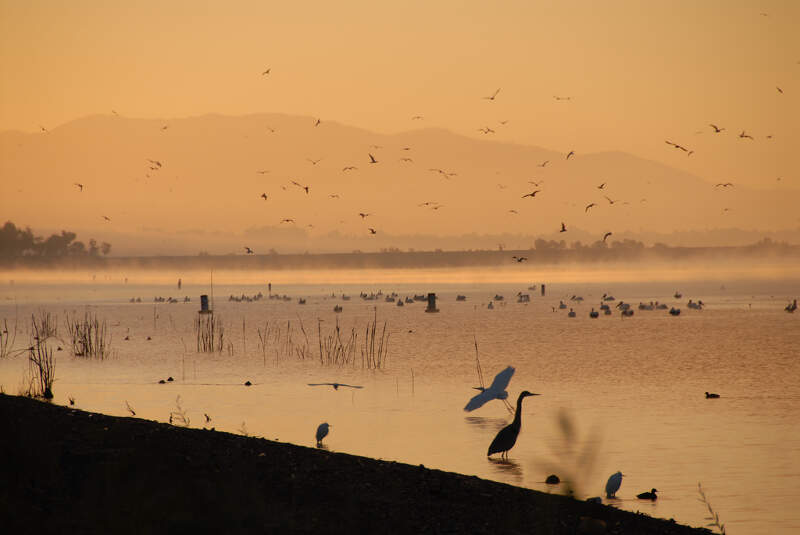
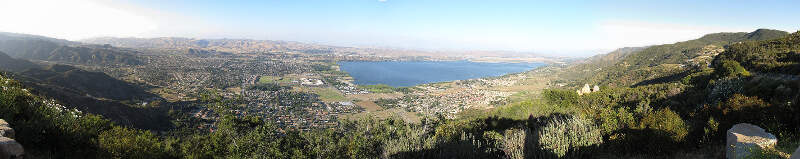
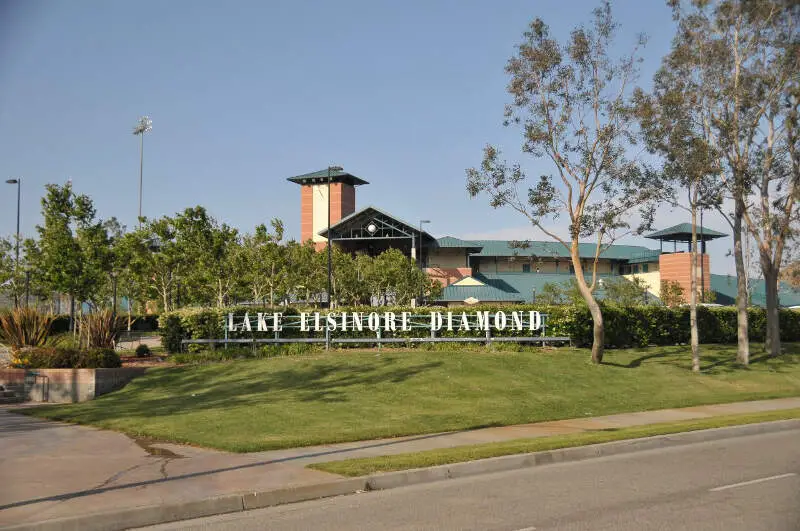
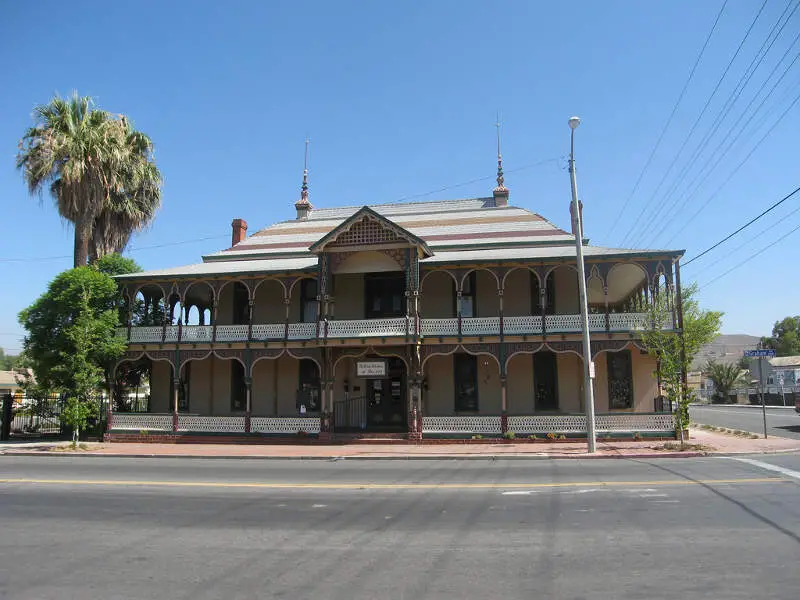
Lake Elsinore, CA Photos
Rankings & Articles For Lake Elsinore


Locations Around Lake Elsinore
Map Of Lake Elsinore, CA
Best Places Around Lake Elsinore
Mission Viejo, CA
Population 92,151
Rancho Santa Margarita, CA
Population 46,990
Lake Forest, CA
Population 86,281
Ladera Ranch, CA
Population 23,793
Coto de Caza, CA
Population 15,190
Temecula, CA
Population 111,167
Corona, CA
Population 159,670
El Cerrito, CA
Population 25,994
Home Gardens, CA
Population 10,506
Murrieta, CA
Population 112,064
Lake Elsinore Demographics And Statistics
Population over time in Lake Elsinore
The current population in Lake Elsinore is 72,461. The population has increased 49.0% from 2010.
| Year | Population | % Change |
|---|---|---|
| 2024 | 72,461 | 1.3% |
| 2023 | 71,516 | 2.2% |
| 2022 | 69,993 | 1.7% |
| 2021 | 68,822 | 7.2% |
| 2020 | 64,201 | -2.5% |
| 2019 | 65,817 | 2.8% |
| 2018 | 64,037 | 2.9% |
| 2017 | 62,229 | 3.3% |
| 2016 | 60,230 | 3.8% |
| 2015 | 58,003 | 3.1% |
| 2014 | 56,243 | 3.7% |
| 2013 | 54,260 | 3.9% |
| 2012 | 52,219 | 3.6% |
| 2011 | 50,405 | 3.6% |
| 2010 | 48,644 | - |
Race / Ethnicity in Lake Elsinore
See the full breakdown
Lake Elsinore is:
30.0% White with 21,749 White residents.
6.2% African American with 4,527 African American residents.
0.1% American Indian with 70 American Indian residents.
7.4% Asian with 5,365 Asian residents.
0.1% Hawaiian with 45 Hawaiian residents.
1.3% Other with 957 Other residents.
3.3% Two Or More with 2,368 Two Or More residents.
51.6% Hispanic with 37,380 Hispanic residents.
| Race | Lake Elsinore | CA | USA |
|---|---|---|---|
| White | 30.0% | 33.8% | 57.4% |
| African American | 6.2% | 5.2% | 11.9% |
| American Indian | 0.1% | 0.3% | 0.5% |
| Asian | 7.4% | 15.3% | 5.9% |
| Hawaiian | 0.1% | 0.3% | 0.2% |
| Other | 1.3% | 0.6% | 0.6% |
| Two Or More | 3.3% | 4.4% | 4.3% |
| Hispanic | 51.6% | 40.2% | 19.3% |
Gender in Lake Elsinore
See the full breakdown
Lake Elsinore is 49.6% female with 35,974 female residents.
Lake Elsinore is 50.4% male with 36,486 male residents.
| Gender | Lake Elsinore | CA | USA |
|---|---|---|---|
| Female | 49.6% | 50.1% | 50.5% |
| Male | 50.4% | 49.9% | 49.5% |
Highest level of educational attainment in Lake Elsinore for adults over 25
See the full breakdown
9.0% of adults in Lake Elsinore completed < 9th grade.
8.0% of adults in Lake Elsinore completed 9-12th grade.
25.0% of adults in Lake Elsinore completed high school / ged.
23.0% of adults in Lake Elsinore completed some college.
11.0% of adults in Lake Elsinore completed associate's degree.
16.0% of adults in Lake Elsinore completed bachelor's degree.
6.0% of adults in Lake Elsinore completed master's degree.
1.0% of adults in Lake Elsinore completed professional degree.
1.0% of adults in Lake Elsinore completed doctorate degree.
| Education | Lake Elsinore | CA | USA |
|---|---|---|---|
| < 9th Grade | 9.0% | 8.0% | 4.0% |
| 9-12th Grade | 8.0% | 7.0% | 6.0% |
| High School / GED | 25.0% | 20.0% | 26.0% |
| Some College | 23.0% | 19.0% | 19.0% |
| Associate's Degree | 11.0% | 8.0% | 9.0% |
| Bachelor's Degree | 16.0% | 23.0% | 22.0% |
| Master's Degree | 6.0% | 10.0% | 10.0% |
| Professional Degree | 1.0% | 3.0% | 2.0% |
| Doctorate Degree | 1.0% | 2.0% | 2.0% |
Household Income For Lake Elsinore, California
See the full breakdown
2.7% of households in Lake Elsinore earn Less than $10,000.
1.5% of households in Lake Elsinore earn $10,000 to $14,999.
4.5% of households in Lake Elsinore earn $15,000 to $24,999.
5.0% of households in Lake Elsinore earn $25,000 to $34,999.
8.5% of households in Lake Elsinore earn $35,000 to $49,999.
14.0% of households in Lake Elsinore earn $50,000 to $74,999.
12.6% of households in Lake Elsinore earn $75,000 to $99,999.
19.5% of households in Lake Elsinore earn $100,000 to $149,999.
14.7% of households in Lake Elsinore earn $150,000 to $199,999.
17.0% of households in Lake Elsinore earn $200,000 or more.
| Income | Lake Elsinore | CA | USA |
|---|---|---|---|
| Less than $10,000 | 2.7% | 4.5% | 5.0% |
| $10,000 to $14,999 | 1.5% | 2.9% | 3.4% |
| $15,000 to $24,999 | 4.5% | 5.0% | 6.3% |
| $25,000 to $34,999 | 5.0% | 5.3% | 6.6% |
| $35,000 to $49,999 | 8.5% | 8.1% | 10.1% |
| $50,000 to $74,999 | 14.0% | 13.0% | 15.5% |
| $75,000 to $99,999 | 12.6% | 11.6% | 12.6% |
| $100,000 to $149,999 | 19.5% | 17.8% | 17.5% |
| $150,000 to $199,999 | 14.7% | 11.3% | 9.6% |
| $200,000 or more | 17.0% | 20.5% | 13.4% |
Source: U.S. Census ACS 5-year estimates (2024)


