Ontario SnackAbility
Overall SnackAbility
Crime in Ontario summary. We use data from the FBI to determine the crime rates in Ontario. Key points include:
There were 3,861 total crimes in Ontario in the last reporting year.
The overall crime rate per 100,000 people in Ontario is 2,089.7 / 100k people.
The violent crime rate per 100,000 people in Ontario is 272.2 / 100k people.
The property crime rate per 100,000 people in Ontario is 1,817.5 / 100k people.
Overall, crime in Ontario is -1.39% below the national average.
Total Crimes
Below National Average
Crime In Ontario Comparison Table
| Statistic | Count Raw |
Ontario / 100k People |
California / 100k People |
National / 100k People |
|---|---|---|---|---|
| Total Crimes Per 100K | 3,861 | 2,089.7 | 2,564.5 | 2,119.2 |
| Violent Crime | 503 | 272.2 | 486.0 | 359.0 |
| Murder | 4 | 2.2 | 4.5 | 5.0 |
| Robbery | 143 | 77.4 | 119.1 | 61.0 |
| Aggravated Assault | 275 | 148.8 | 325.8 | 256.0 |
| Property Crime | 3,358 | 1,817.5 | 2,078.4 | 1,760.0 |
| Burglary | 441 | 238.7 | 305.8 | 229.0 |
| Larceny | 2,057 | 1,113.3 | 1,345.2 | 1,272.0 |
| Car Theft | 860 | 465.5 | 427.5 | 259.0 |
Source: FBI Uniform Crime Reporting (2024)
Cost of living in Ontario summary. We use data on the cost of living to determine how expensive it is to live in Ontario. Real estate prices drive most of the variance in cost of living around California. Key points include:
The cost of living in Ontario is 141 with 100 being average.
The cost of living in Ontario is 1.4x higher than the national average.
The median home value in Ontario is $672,742.
The median income in Ontario is $88,941.
Ontario's Overall Cost Of Living
Higher Than The National Average
Cost Of Living In Ontario Comparison Table
| Living Expense | Ontario | California | National Average |
|---|---|---|---|
| Overall | 141 | 142 | 100 |
| Services | 110 | 110 | 100 |
| Groceries | 118 | 118 | 100 |
| Health | 208 | 197 | 100 |
| Housing | 118 | 120 | 100 |
| Transportation | 122 | 121 | 100 |
| Utilities | 119 | 121 | 100 |
Source: Cost of living index, normalized to US average = 100
Ontario, CA Weather
The average high in Ontario is 76.0° and the average low is 48.8°.
There are 22.0 days of precipitation each year.
Expect an average of 14.2 inches of precipitation each year with 9.0 inches of snow.
| Stat | Ontario |
|---|---|
| Average Annual High | 76.0 |
| Average Annual Low | 48.8 |
| Annual Precipitation Days | 22.0 |
| Average Annual Precipitation | 14.2 |
| Average Annual Snowfall | 9.0 |
Average High
Days of Rain
Source: NOAA climate normals (30-year)
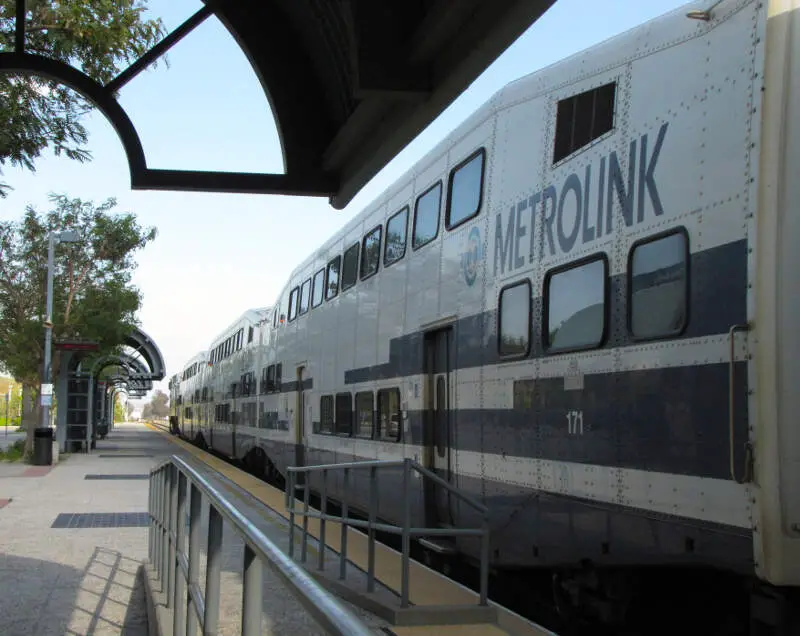
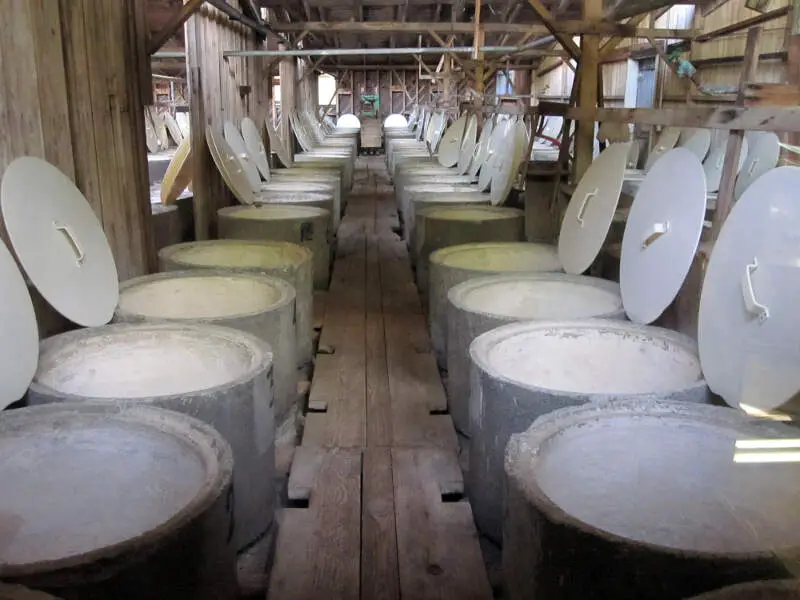
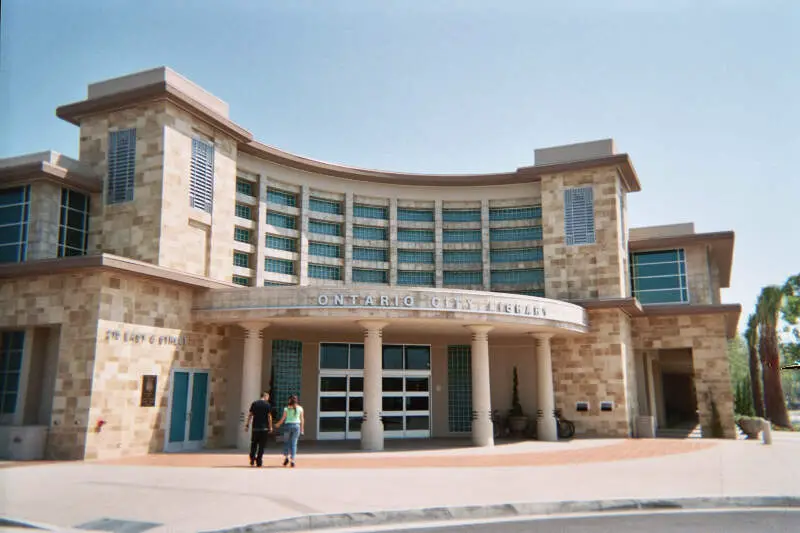
Ontario, CA Photos


Rankings & Articles For Ontario


Locations Around Ontario
Map Of Ontario, CA
Best Places Around Ontario
Vincent, CA
Population 15,340
Villa Park, CA
Population 5,748
Citrus, CA
Population 10,904
La Verne, CA
Population 30,600
Yorba Linda, CA
Population 67,170
Placentia, CA
Population 52,826
Walnut, CA
Population 27,611
Diamond Bar, CA
Population 53,355
Valinda, CA
Population 20,962
Claremont, CA
Population 36,595
Ontario Demographics And Statistics
Population over time in Ontario
The current population in Ontario is 180,547. The population has increased 9.3% from 2010.
| Year | Population | % Change |
|---|---|---|
| 2024 | 180,547 | 1.2% |
| 2023 | 178,347 | 1.1% |
| 2022 | 176,326 | 0.6% |
| 2021 | 175,223 | -1.7% |
| 2020 | 178,194 | 0.8% |
| 2019 | 176,760 | 1.8% |
| 2018 | 173,580 | 1.5% |
| 2017 | 171,041 | 1.0% |
| 2016 | 169,389 | 0.7% |
| 2015 | 168,218 | 0.8% |
| 2014 | 166,892 | 0.7% |
| 2013 | 165,702 | 0.3% |
| 2012 | 165,260 | 0.1% |
| 2011 | 165,120 | -0.1% |
| 2010 | 165,215 | - |
Race / Ethnicity in Ontario
See the full breakdown
Ontario is:
12.3% White with 22,296 White residents.
5.8% African American with 10,450 African American residents.
0.2% American Indian with 362 American Indian residents.
9.6% Asian with 17,309 Asian residents.
0.2% Hawaiian with 413 Hawaiian residents.
0.4% Other with 759 Other residents.
2.9% Two Or More with 5,158 Two Or More residents.
68.6% Hispanic with 123,800 Hispanic residents.
| Race | Ontario | CA | USA |
|---|---|---|---|
| White | 12.3% | 33.8% | 57.4% |
| African American | 5.8% | 5.2% | 11.9% |
| American Indian | 0.2% | 0.3% | 0.5% |
| Asian | 9.6% | 15.3% | 5.9% |
| Hawaiian | 0.2% | 0.3% | 0.2% |
| Other | 0.4% | 0.6% | 0.6% |
| Two Or More | 2.9% | 4.4% | 4.3% |
| Hispanic | 68.6% | 40.2% | 19.3% |
Gender in Ontario
See the full breakdown
Ontario is 51.2% female with 92,366 female residents.
Ontario is 48.8% male with 88,181 male residents.
| Gender | Ontario | CA | USA |
|---|---|---|---|
| Female | 51.2% | 50.1% | 50.5% |
| Male | 48.8% | 49.9% | 49.5% |
Highest level of educational attainment in Ontario for adults over 25
See the full breakdown
13.0% of adults in Ontario completed < 9th grade.
9.0% of adults in Ontario completed 9-12th grade.
27.0% of adults in Ontario completed high school / ged.
20.0% of adults in Ontario completed some college.
8.0% of adults in Ontario completed associate's degree.
16.0% of adults in Ontario completed bachelor's degree.
5.0% of adults in Ontario completed master's degree.
1.0% of adults in Ontario completed professional degree.
1.0% of adults in Ontario completed doctorate degree.
| Education | Ontario | CA | USA |
|---|---|---|---|
| < 9th Grade | 13.0% | 8.0% | 4.0% |
| 9-12th Grade | 9.0% | 7.0% | 6.0% |
| High School / GED | 27.0% | 20.0% | 26.0% |
| Some College | 20.0% | 19.0% | 19.0% |
| Associate's Degree | 8.0% | 8.0% | 9.0% |
| Bachelor's Degree | 16.0% | 23.0% | 22.0% |
| Master's Degree | 5.0% | 10.0% | 10.0% |
| Professional Degree | 1.0% | 3.0% | 2.0% |
| Doctorate Degree | 1.0% | 2.0% | 2.0% |
Household Income For Ontario, California
See the full breakdown
4.4% of households in Ontario earn Less than $10,000.
1.9% of households in Ontario earn $10,000 to $14,999.
5.5% of households in Ontario earn $15,000 to $24,999.
5.4% of households in Ontario earn $25,000 to $34,999.
8.9% of households in Ontario earn $35,000 to $49,999.
16.0% of households in Ontario earn $50,000 to $74,999.
13.3% of households in Ontario earn $75,000 to $99,999.
21.6% of households in Ontario earn $100,000 to $149,999.
12.1% of households in Ontario earn $150,000 to $199,999.
10.9% of households in Ontario earn $200,000 or more.
| Income | Ontario | CA | USA |
|---|---|---|---|
| Less than $10,000 | 4.4% | 4.5% | 5.0% |
| $10,000 to $14,999 | 1.9% | 2.9% | 3.4% |
| $15,000 to $24,999 | 5.5% | 5.0% | 6.3% |
| $25,000 to $34,999 | 5.4% | 5.3% | 6.6% |
| $35,000 to $49,999 | 8.9% | 8.1% | 10.1% |
| $50,000 to $74,999 | 16.0% | 13.0% | 15.5% |
| $75,000 to $99,999 | 13.3% | 11.6% | 12.6% |
| $100,000 to $149,999 | 21.6% | 17.8% | 17.5% |
| $150,000 to $199,999 | 12.1% | 11.3% | 9.6% |
| $200,000 or more | 10.9% | 20.5% | 13.4% |
Source: U.S. Census ACS 5-year estimates (2024)


