Pasadena SnackAbility
Overall SnackAbility
Crime in Pasadena summary. We use data from the FBI to determine the crime rates in Pasadena. Key points include:
There were 4,193 total crimes in Pasadena in the last reporting year.
The overall crime rate per 100,000 people in Pasadena is 3,177.3 / 100k people.
The violent crime rate per 100,000 people in Pasadena is 480.4 / 100k people.
The property crime rate per 100,000 people in Pasadena is 2,696.9 / 100k people.
Overall, crime in Pasadena is 49.93% above the national average.
Total Crimes
Above National Average
Crime In Pasadena Comparison Table
| Statistic | Count Raw |
Pasadena / 100k People |
California / 100k People |
National / 100k People |
|---|---|---|---|---|
| Total Crimes Per 100K | 4,193 | 3,177.3 | 2,564.5 | 2,119.2 |
| Violent Crime | 634 | 480.4 | 486.0 | 359.0 |
| Murder | 1 | 0.8 | 4.5 | 5.0 |
| Robbery | 158 | 119.7 | 119.1 | 61.0 |
| Aggravated Assault | 431 | 326.6 | 325.8 | 256.0 |
| Property Crime | 3,559 | 2,696.9 | 2,078.4 | 1,760.0 |
| Burglary | 735 | 557.0 | 305.8 | 229.0 |
| Larceny | 2,461 | 1,864.9 | 1,345.2 | 1,272.0 |
| Car Theft | 363 | 275.1 | 427.5 | 259.0 |
Source: FBI Uniform Crime Reporting (2024)
Cost of living in Pasadena summary. We use data on the cost of living to determine how expensive it is to live in Pasadena. Real estate prices drive most of the variance in cost of living around California. Key points include:
The cost of living in Pasadena is 198 with 100 being average.
The cost of living in Pasadena is 2.0x higher than the national average.
The median home value in Pasadena is $1,209,228.
The median income in Pasadena is $105,192.
Pasadena's Overall Cost Of Living
Higher Than The National Average
Cost Of Living In Pasadena Comparison Table
| Living Expense | Pasadena | California | National Average |
|---|---|---|---|
| Overall | 198 | 142 | 100 |
| Services | 113 | 110 | 100 |
| Groceries | 118 | 118 | 100 |
| Health | 379 | 197 | 100 |
| Housing | 119 | 120 | 100 |
| Transportation | 125 | 121 | 100 |
| Utilities | 121 | 121 | 100 |
Source: Cost of living index, normalized to US average = 100
Pasadena, CA Weather
The average high in Pasadena is 75.3° and the average low is 54.1°.
There are 22.7 days of precipitation each year.
Expect an average of 16.2 inches of precipitation each year with 0.2 inches of snow.
| Stat | Pasadena |
|---|---|
| Average Annual High | 75.3 |
| Average Annual Low | 54.1 |
| Annual Precipitation Days | 22.7 |
| Average Annual Precipitation | 16.2 |
| Average Annual Snowfall | 0.2 |
Average High
Days of Rain
Source: NOAA climate normals (30-year)
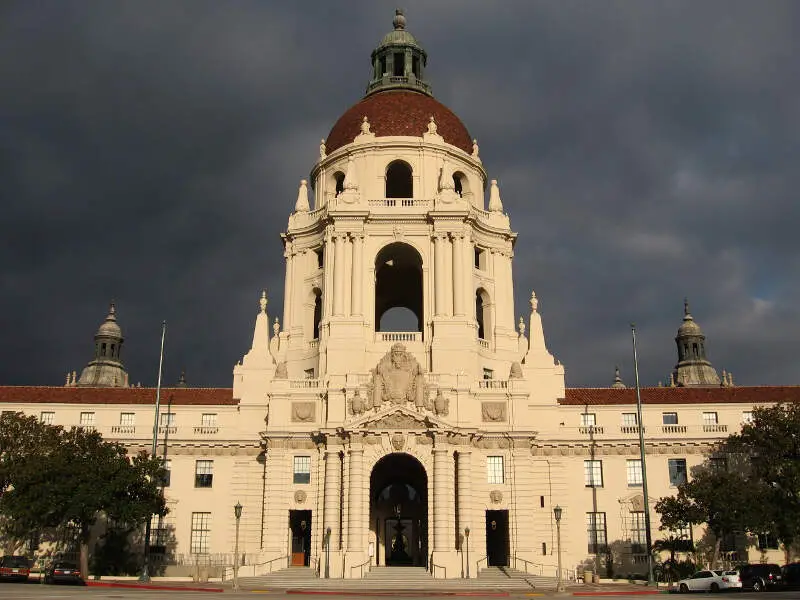
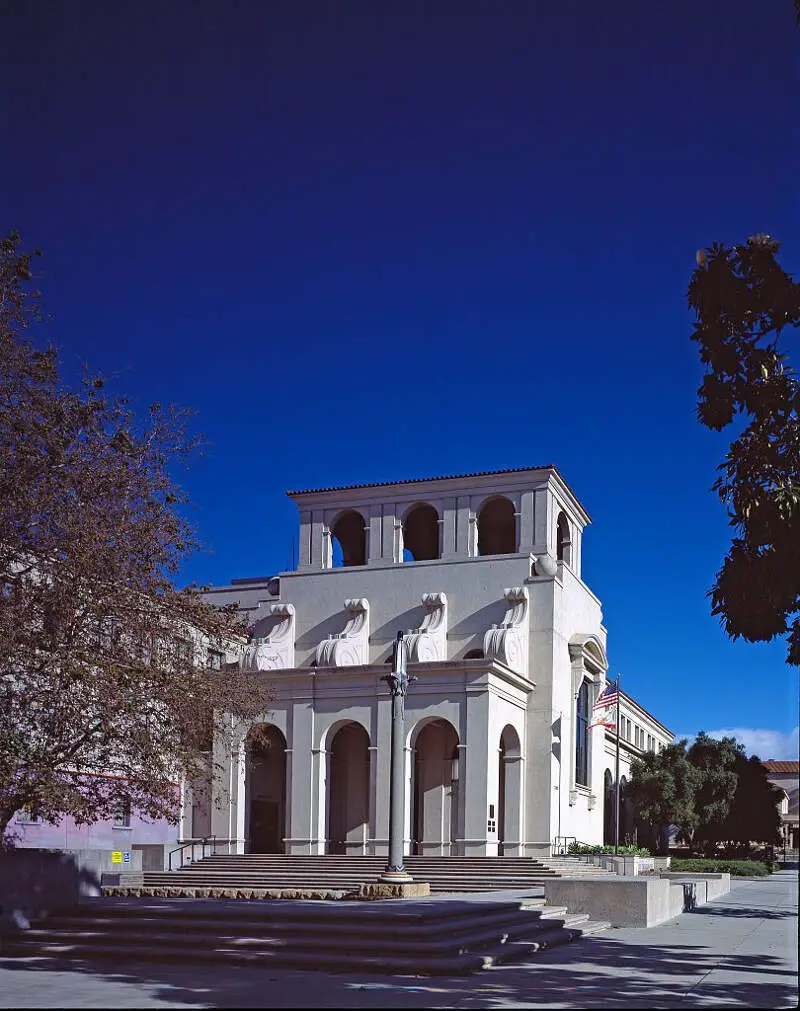
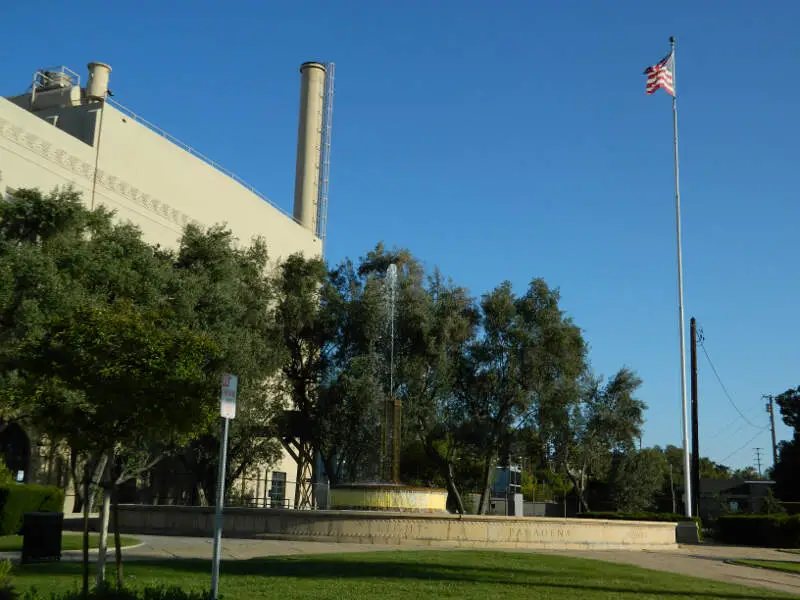
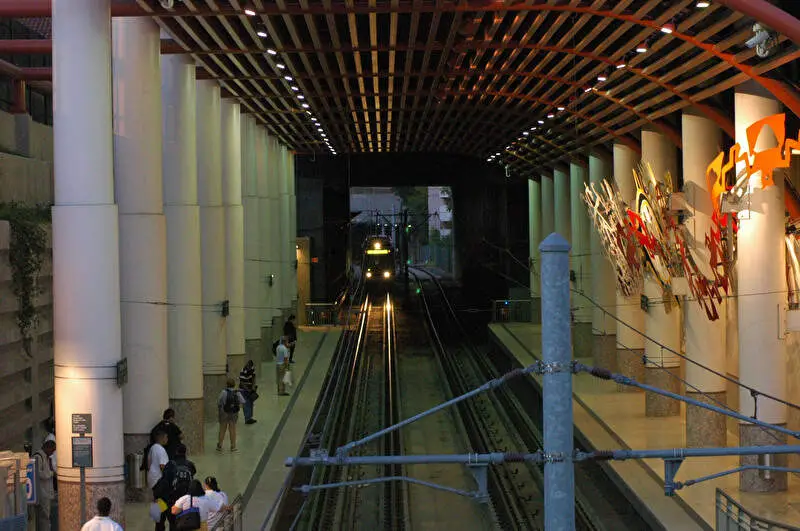
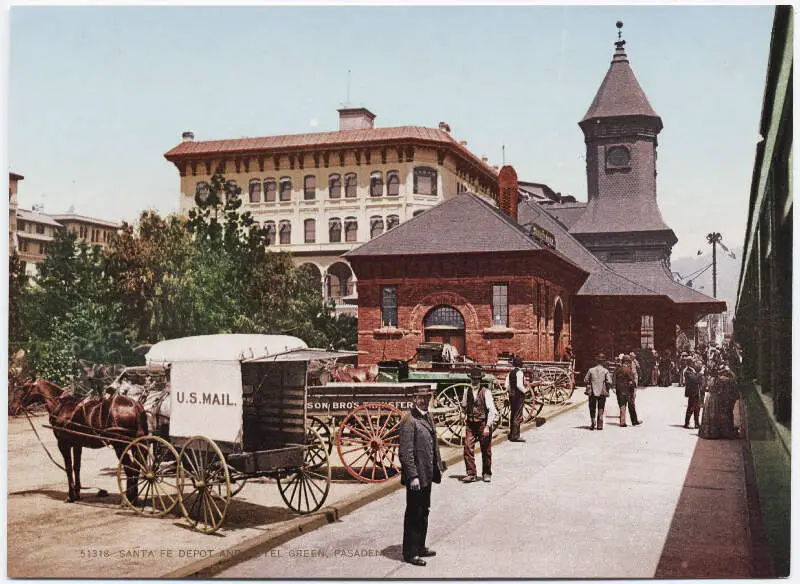
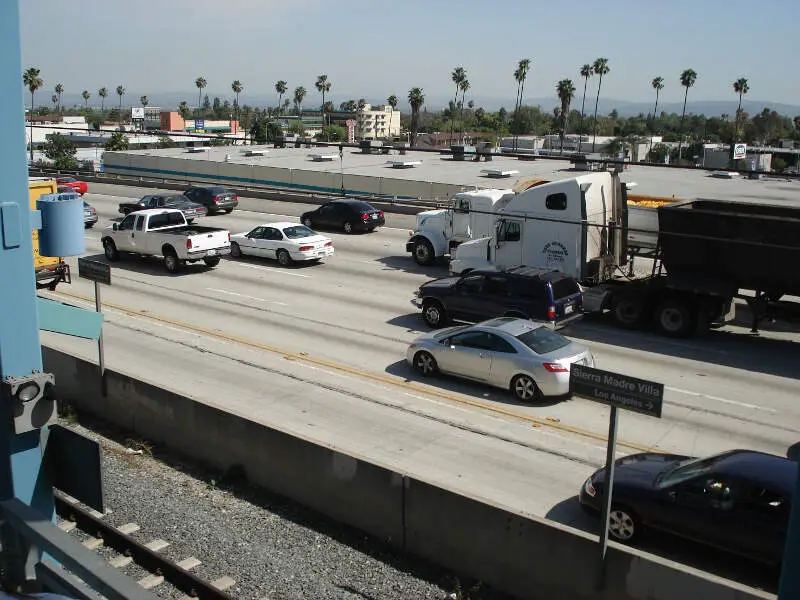
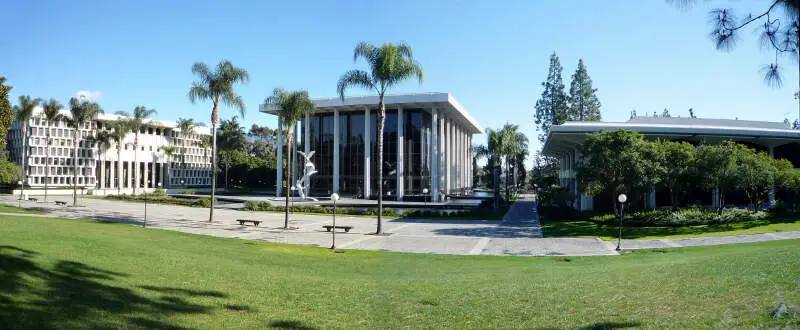
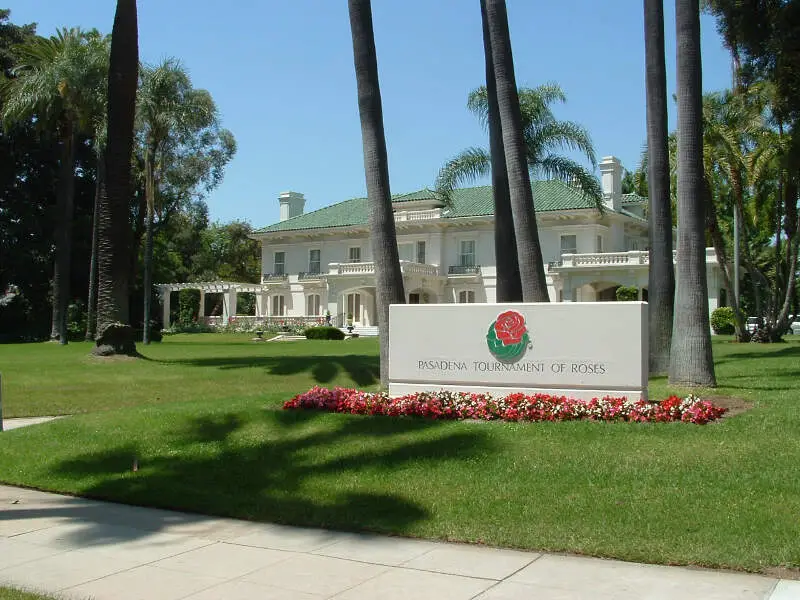
Pasadena, CA Photos

Rankings & Articles For Pasadena


Locations Around Pasadena
Map Of Pasadena, CA
Best Places Around Pasadena
La Mirada, CA
Population 47,180
Vincent, CA
Population 15,340
West Puente Valley, CA
Population 22,495
Citrus, CA
Population 10,904
South Monrovia Island, CA
Population 6,830
Walnut, CA
Population 27,611
Avocado Heights, CA
Population 12,593
Valinda, CA
Population 20,962
San Fernando, CA
Population 23,632
La Crescenta-Montrose, CA
Population 19,660
Pasadena Demographics And Statistics
Population over time in Pasadena
The current population in Pasadena is 136,969. The population has increased 0.4% from 2010.
| Year | Population | % Change |
|---|---|---|
| 2024 | 136,969 | 0.4% |
| 2023 | 136,462 | -0.8% |
| 2022 | 137,554 | -0.9% |
| 2021 | 138,771 | -2.3% |
| 2020 | 142,017 | 0.5% |
| 2019 | 141,258 | 0.0% |
| 2018 | 141,246 | 0.0% |
| 2017 | 141,231 | 0.7% |
| 2016 | 140,268 | 0.3% |
| 2015 | 139,899 | 0.6% |
| 2014 | 139,065 | 0.8% |
| 2013 | 138,004 | 0.5% |
| 2012 | 137,316 | 0.4% |
| 2011 | 136,807 | 0.3% |
| 2010 | 136,449 | - |
Race / Ethnicity in Pasadena
See the full breakdown
Pasadena is:
34.9% White with 47,759 White residents.
8.0% African American with 10,912 African American residents.
0.1% American Indian with 155 American Indian residents.
17.0% Asian with 23,270 Asian residents.
0.2% Hawaiian with 317 Hawaiian residents.
0.5% Other with 648 Other residents.
5.4% Two Or More with 7,385 Two Or More residents.
34.0% Hispanic with 46,523 Hispanic residents.
| Race | Pasadena | CA | USA |
|---|---|---|---|
| White | 34.9% | 33.8% | 57.4% |
| African American | 8.0% | 5.2% | 11.9% |
| American Indian | 0.1% | 0.3% | 0.5% |
| Asian | 17.0% | 15.3% | 5.9% |
| Hawaiian | 0.2% | 0.3% | 0.2% |
| Other | 0.5% | 0.6% | 0.6% |
| Two Or More | 5.4% | 4.4% | 4.3% |
| Hispanic | 34.0% | 40.2% | 19.3% |
Gender in Pasadena
See the full breakdown
Pasadena is 50.7% female with 69,411 female residents.
Pasadena is 49.3% male with 67,558 male residents.
| Gender | Pasadena | CA | USA |
|---|---|---|---|
| Female | 50.7% | 50.1% | 50.5% |
| Male | 49.3% | 49.9% | 49.5% |
Highest level of educational attainment in Pasadena for adults over 25
See the full breakdown
6.0% of adults in Pasadena completed < 9th grade.
4.0% of adults in Pasadena completed 9-12th grade.
13.0% of adults in Pasadena completed high school / ged.
15.0% of adults in Pasadena completed some college.
6.0% of adults in Pasadena completed associate's degree.
29.0% of adults in Pasadena completed bachelor's degree.
17.0% of adults in Pasadena completed master's degree.
6.0% of adults in Pasadena completed professional degree.
4.0% of adults in Pasadena completed doctorate degree.
| Education | Pasadena | CA | USA |
|---|---|---|---|
| < 9th Grade | 6.0% | 8.0% | 4.0% |
| 9-12th Grade | 4.0% | 7.0% | 6.0% |
| High School / GED | 13.0% | 20.0% | 26.0% |
| Some College | 15.0% | 19.0% | 19.0% |
| Associate's Degree | 6.0% | 8.0% | 9.0% |
| Bachelor's Degree | 29.0% | 23.0% | 22.0% |
| Master's Degree | 17.0% | 10.0% | 10.0% |
| Professional Degree | 6.0% | 3.0% | 2.0% |
| Doctorate Degree | 4.0% | 2.0% | 2.0% |
Household Income For Pasadena, California
See the full breakdown
5.8% of households in Pasadena earn Less than $10,000.
3.7% of households in Pasadena earn $10,000 to $14,999.
4.5% of households in Pasadena earn $15,000 to $24,999.
4.4% of households in Pasadena earn $25,000 to $34,999.
7.0% of households in Pasadena earn $35,000 to $49,999.
10.7% of households in Pasadena earn $50,000 to $74,999.
11.9% of households in Pasadena earn $75,000 to $99,999.
16.6% of households in Pasadena earn $100,000 to $149,999.
12.0% of households in Pasadena earn $150,000 to $199,999.
23.5% of households in Pasadena earn $200,000 or more.
| Income | Pasadena | CA | USA |
|---|---|---|---|
| Less than $10,000 | 5.8% | 4.5% | 5.0% |
| $10,000 to $14,999 | 3.7% | 2.9% | 3.4% |
| $15,000 to $24,999 | 4.5% | 5.0% | 6.3% |
| $25,000 to $34,999 | 4.4% | 5.3% | 6.6% |
| $35,000 to $49,999 | 7.0% | 8.1% | 10.1% |
| $50,000 to $74,999 | 10.7% | 13.0% | 15.5% |
| $75,000 to $99,999 | 11.9% | 11.6% | 12.6% |
| $100,000 to $149,999 | 16.6% | 17.8% | 17.5% |
| $150,000 to $199,999 | 12.0% | 11.3% | 9.6% |
| $200,000 or more | 23.5% | 20.5% | 13.4% |
Source: U.S. Census ACS 5-year estimates (2024)


