Placerville SnackAbility
Overall SnackAbility
Crime in Placerville summary. We use data from the FBI to determine the crime rates in Placerville. Key points include:
There were 224 total crimes in Placerville in the last reporting year.
The overall crime rate per 100,000 people in Placerville is 2,106.8 / 100k people.
The violent crime rate per 100,000 people in Placerville is 583.1 / 100k people.
The property crime rate per 100,000 people in Placerville is 1,523.7 / 100k people.
Overall, crime in Placerville is -0.58% below the national average.
Total Crimes
Below National Average
Crime In Placerville Comparison Table
| Statistic | Count Raw |
Placerville / 100k People |
California / 100k People |
National / 100k People |
|---|---|---|---|---|
| Total Crimes Per 100K | 224 | 2,106.8 | 2,564.5 | 2,119.2 |
| Violent Crime | 62 | 583.1 | 486.0 | 359.0 |
| Murder | 0 | 0.0 | 4.5 | 5.0 |
| Robbery | 6 | 56.4 | 119.1 | 61.0 |
| Aggravated Assault | 49 | 460.9 | 325.8 | 256.0 |
| Property Crime | 162 | 1,523.7 | 2,078.4 | 1,760.0 |
| Burglary | 34 | 319.8 | 305.8 | 229.0 |
| Larceny | 117 | 1,100.5 | 1,345.2 | 1,272.0 |
| Car Theft | 11 | 103.5 | 427.5 | 259.0 |
Source: FBI Uniform Crime Reporting (2024)
Cost of living in Placerville summary. We use data on the cost of living to determine how expensive it is to live in Placerville. Real estate prices drive most of the variance in cost of living around California. Key points include:
The cost of living in Placerville is 135 with 100 being average.
The cost of living in Placerville is 1.4x higher than the national average.
The median home value in Placerville is $531,048.
The median income in Placerville is $67,274.
Placerville's Overall Cost Of Living
Higher Than The National Average
Cost Of Living In Placerville Comparison Table
| Living Expense | Placerville | California | National Average |
|---|---|---|---|
| Overall | 135 | 142 | 100 |
| Services | 110 | 110 | 100 |
| Groceries | 113 | 118 | 100 |
| Health | 182 | 197 | 100 |
| Housing | 116 | 120 | 100 |
| Transportation | 118 | 121 | 100 |
| Utilities | 116 | 121 | 100 |
Source: Cost of living index, normalized to US average = 100
Placerville, CA Weather
The average high in Placerville is 68.0° and the average low is 42.9°.
There are 51.2 days of precipitation each year.
Expect an average of 39.2 inches of precipitation each year with 87.4 inches of snow.
| Stat | Placerville |
|---|---|
| Average Annual High | 68.0 |
| Average Annual Low | 42.9 |
| Annual Precipitation Days | 51.2 |
| Average Annual Precipitation | 39.2 |
| Average Annual Snowfall | 87.4 |
Average High
Days of Rain
Source: NOAA climate normals (30-year)
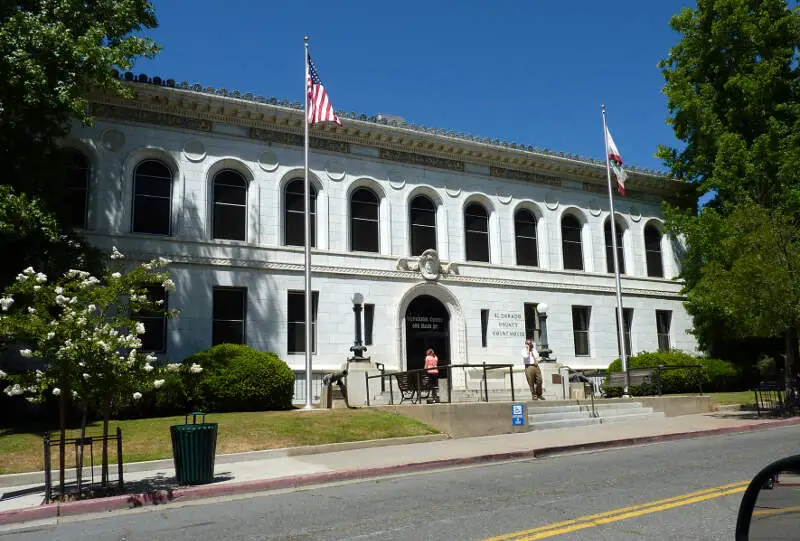
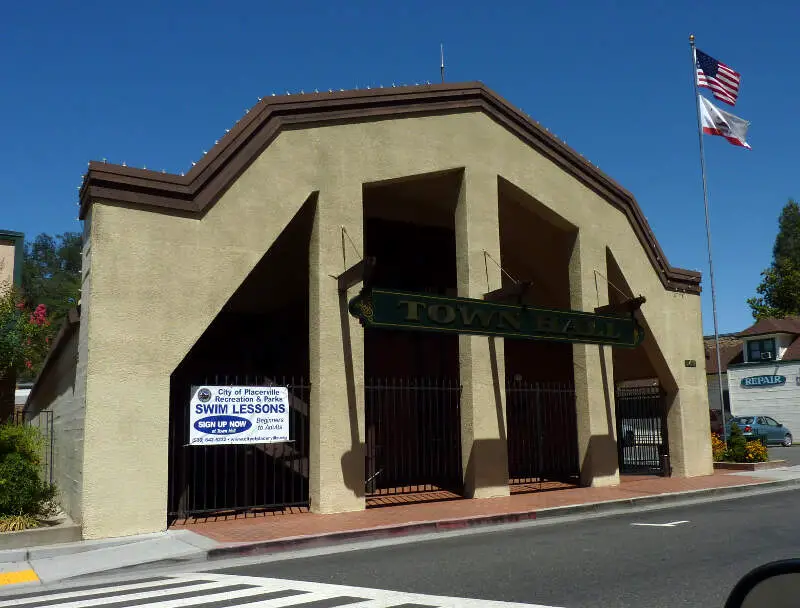
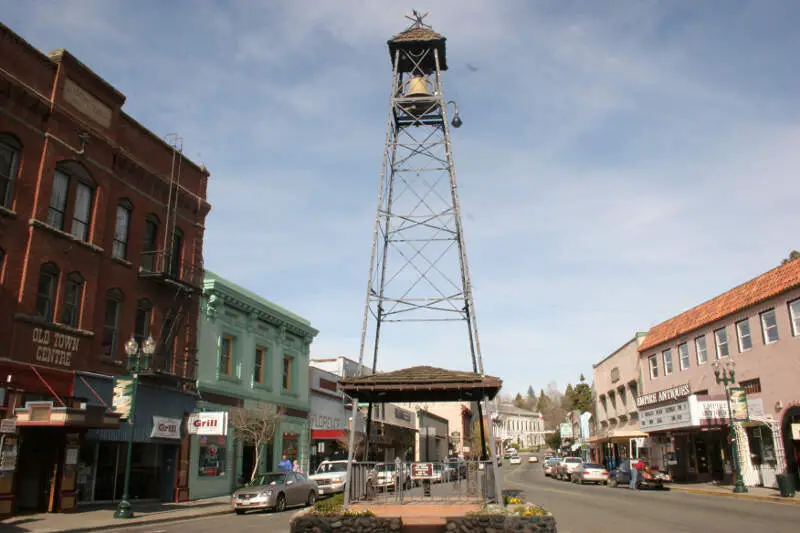
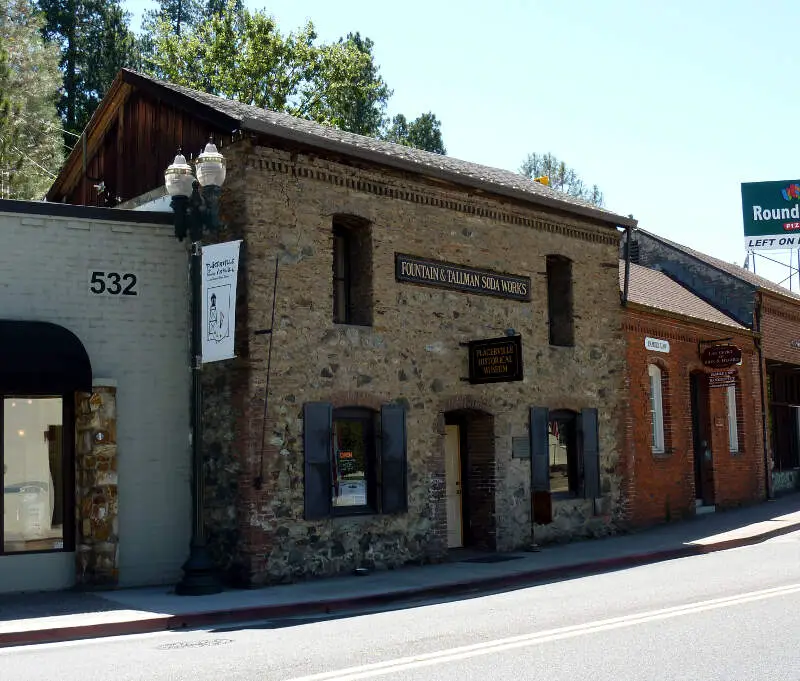
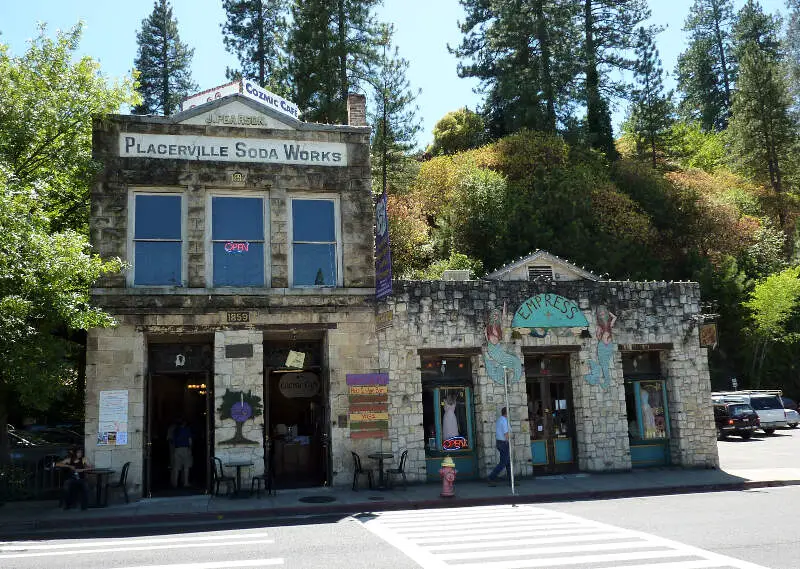
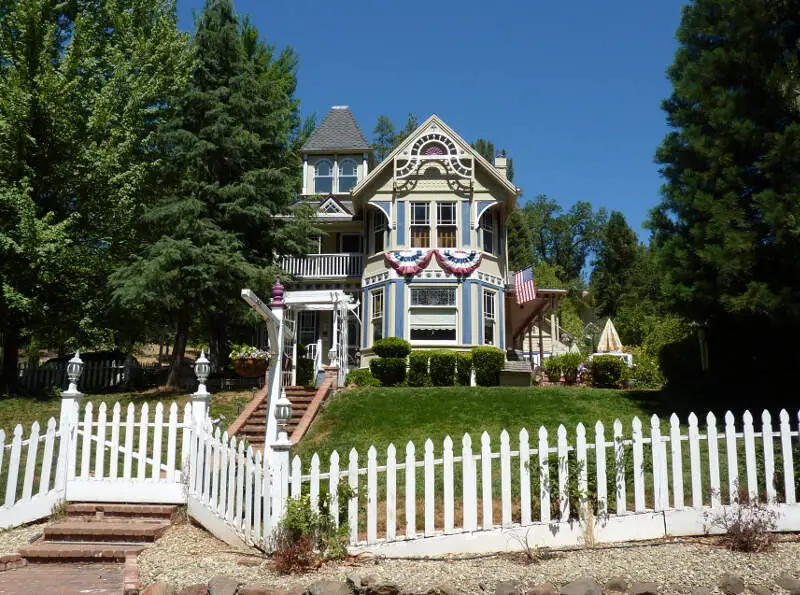
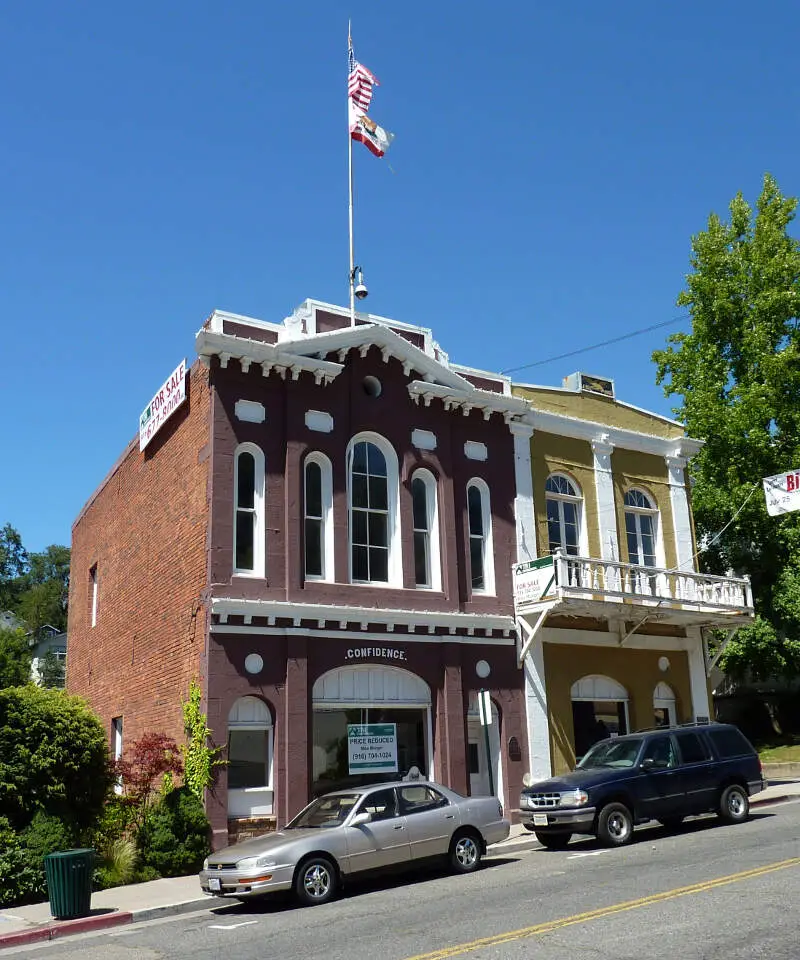
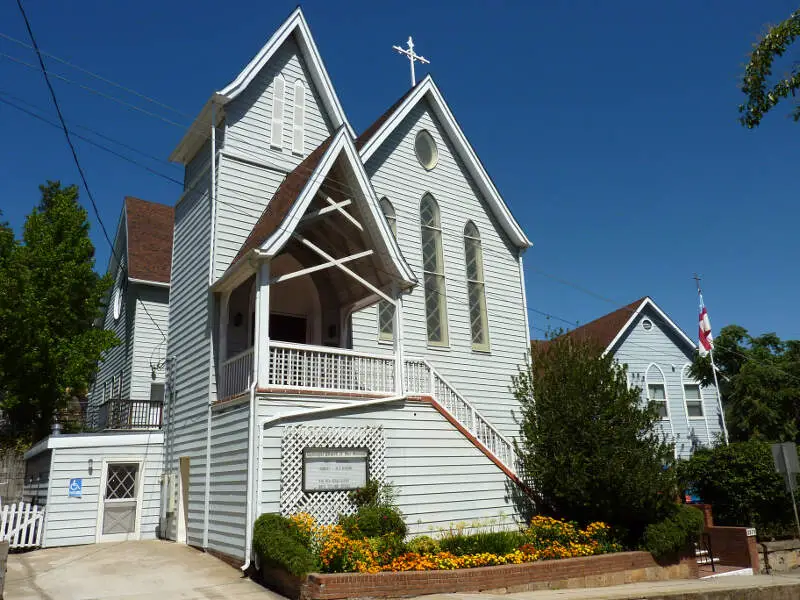
Placerville, CA Photos
Rankings & Articles For Placerville


Locations Around Placerville
Map Of Placerville, CA
Best Places Around Placerville
Folsom, CA
Population 83,916
El Dorado Hills, CA
Population 51,026
Diamond Springs, CA
Population 10,927
Cameron Park, CA
Population 18,315
Pollock Pines, CA
Population 6,212
Auburn, CA
Population 13,768
Cold Springs, NV
Population 11,321
Placerville Demographics And Statistics
Population over time in Placerville
The current population in Placerville is 10,762. The population has increased 3.6% from 2010.
| Year | Population | % Change |
|---|---|---|
| 2024 | 10,762 | 0.3% |
| 2023 | 10,730 | -0.1% |
| 2022 | 10,744 | -0.3% |
| 2021 | 10,777 | -1.6% |
| 2020 | 10,954 | -0.1% |
| 2019 | 10,970 | 1.0% |
| 2018 | 10,860 | 1.7% |
| 2017 | 10,681 | 1.3% |
| 2016 | 10,540 | 0.7% |
| 2015 | 10,471 | 0.5% |
| 2014 | 10,415 | 0.3% |
| 2013 | 10,383 | 0.2% |
| 2012 | 10,359 | -0.3% |
| 2011 | 10,394 | 0.1% |
| 2010 | 10,384 | - |
Race / Ethnicity in Placerville
See the full breakdown
Placerville is:
68.5% White with 7,369 White residents.
1.5% African American with 162 African American residents.
0.2% American Indian with 18 American Indian residents.
1.0% Asian with 112 Asian residents.
0.0% Hawaiian with 0 Hawaiian residents.
0.0% Other with 0 Other residents.
4.8% Two Or More with 519 Two Or More residents.
24.0% Hispanic with 2,582 Hispanic residents.
| Race | Placerville | CA | USA |
|---|---|---|---|
| White | 68.5% | 33.8% | 57.4% |
| African American | 1.5% | 5.2% | 11.9% |
| American Indian | 0.2% | 0.3% | 0.5% |
| Asian | 1.0% | 15.3% | 5.9% |
| Hawaiian | 0.0% | 0.3% | 0.2% |
| Other | 0.0% | 0.6% | 0.6% |
| Two Or More | 4.8% | 4.4% | 4.3% |
| Hispanic | 24.0% | 40.2% | 19.3% |
Gender in Placerville
See the full breakdown
Placerville is 50.7% female with 5,456 female residents.
Placerville is 49.3% male with 5,305 male residents.
| Gender | Placerville | CA | USA |
|---|---|---|---|
| Female | 50.7% | 50.1% | 50.5% |
| Male | 49.3% | 49.9% | 49.5% |
Highest level of educational attainment in Placerville for adults over 25
See the full breakdown
4.0% of adults in Placerville completed < 9th grade.
7.0% of adults in Placerville completed 9-12th grade.
25.0% of adults in Placerville completed high school / ged.
31.0% of adults in Placerville completed some college.
10.0% of adults in Placerville completed associate's degree.
15.0% of adults in Placerville completed bachelor's degree.
6.0% of adults in Placerville completed master's degree.
1.0% of adults in Placerville completed professional degree.
1.0% of adults in Placerville completed doctorate degree.
| Education | Placerville | CA | USA |
|---|---|---|---|
| < 9th Grade | 4.0% | 8.0% | 4.0% |
| 9-12th Grade | 7.0% | 7.0% | 6.0% |
| High School / GED | 25.0% | 20.0% | 26.0% |
| Some College | 31.0% | 19.0% | 19.0% |
| Associate's Degree | 10.0% | 8.0% | 9.0% |
| Bachelor's Degree | 15.0% | 23.0% | 22.0% |
| Master's Degree | 6.0% | 10.0% | 10.0% |
| Professional Degree | 1.0% | 3.0% | 2.0% |
| Doctorate Degree | 1.0% | 2.0% | 2.0% |
Household Income For Placerville, California
See the full breakdown
3.2% of households in Placerville earn Less than $10,000.
2.1% of households in Placerville earn $10,000 to $14,999.
11.8% of households in Placerville earn $15,000 to $24,999.
12.0% of households in Placerville earn $25,000 to $34,999.
10.9% of households in Placerville earn $35,000 to $49,999.
13.4% of households in Placerville earn $50,000 to $74,999.
10.4% of households in Placerville earn $75,000 to $99,999.
18.8% of households in Placerville earn $100,000 to $149,999.
9.3% of households in Placerville earn $150,000 to $199,999.
8.0% of households in Placerville earn $200,000 or more.
| Income | Placerville | CA | USA |
|---|---|---|---|
| Less than $10,000 | 3.2% | 4.5% | 5.0% |
| $10,000 to $14,999 | 2.1% | 2.9% | 3.4% |
| $15,000 to $24,999 | 11.8% | 5.0% | 6.3% |
| $25,000 to $34,999 | 12.0% | 5.3% | 6.6% |
| $35,000 to $49,999 | 10.9% | 8.1% | 10.1% |
| $50,000 to $74,999 | 13.4% | 13.0% | 15.5% |
| $75,000 to $99,999 | 10.4% | 11.6% | 12.6% |
| $100,000 to $149,999 | 18.8% | 17.8% | 17.5% |
| $150,000 to $199,999 | 9.3% | 11.3% | 9.6% |
| $200,000 or more | 8.0% | 20.5% | 13.4% |
Source: U.S. Census ACS 5-year estimates (2024)


