Redwood City, CA
Demographics And Statistics
Living In Redwood City, California Summary
Life in Redwood City research summary. HomeSnacks has been using Saturday Night Science to research the quality of life in Redwood City over the past nine years using Census, FBI, Zillow, and other primary data sources. Based on the most recently available data, we found the following about life in Redwood City:
The population in Redwood City is 82,423.
The median home value in Redwood City is $1,794,203.
The median income in Redwood City is $150,840.
The cost of living in Redwood City is 268 which is 2.7x higher than the national average.
The median rent in Redwood City is $2,959.
The unemployment rate in Redwood City is 3.7%.
The poverty rate in Redwood City is 6.6%.
The average high in Redwood City is 66.7° and the average low is 49.1°.
Redwood City SnackAbility
Overall SnackAbility
Redwood City, CA Crime Report
Crime in Redwood City summary. We use data from the FBI to determine the crime rates in Redwood City. Key points include:
There were 1,675 total crimes in Redwood City in the last reporting year.
The overall crime rate per 100,000 people in Redwood City is 2,092.2 / 100k people.
The violent crime rate per 100,000 people in Redwood City is 472.1 / 100k people.
The property crime rate per 100,000 people in Redwood City is 1,620.0 / 100k people.
Overall, crime in Redwood City is -1.28% below the national average.
Total Crimes
Below National Average
Crime In Redwood City Comparison Table
| Statistic | Count Raw |
Redwood City / 100k People |
California / 100k People |
National / 100k People |
|---|---|---|---|---|
| Total Crimes Per 100K | 1,675 | 2,092.2 | 2,564.5 | 2,119.2 |
| Violent Crime | 378 | 472.1 | 486.0 | 359.0 |
| Murder | 2 | 2.5 | 4.5 | 5.0 |
| Robbery | 110 | 137.4 | 119.1 | 61.0 |
| Aggravated Assault | 223 | 278.5 | 325.8 | 256.0 |
| Property Crime | 1,297 | 1,620.0 | 2,078.4 | 1,760.0 |
| Burglary | 95 | 118.7 | 305.8 | 229.0 |
| Larceny | 998 | 1,246.6 | 1,345.2 | 1,272.0 |
| Car Theft | 204 | 254.8 | 427.5 | 259.0 |
Redwood City, CA Cost Of Living
Cost of living in Redwood City summary. We use data on the cost of living to determine how expensive it is to live in Redwood City. Real estate prices drive most of the variance in cost of living around California. Key points include:
The cost of living in Redwood City is 268 with 100 being average.
The cost of living in Redwood City is 2.7x higher than the national average.
The median home value in Redwood City is $1,794,203.
The median income in Redwood City is $150,840.
Redwood City's Overall Cost Of Living
Higher Than The National Average
Cost Of Living In Redwood City Comparison Table
| Living Expense | Redwood City | California | National Average | |
|---|---|---|---|---|
| Overall | 268 | 141 | 100 | |
| Services | 109 | 110 | 100 | |
| Groceries | 113 | 112 | 100 | |
| Health | 124 | 110 | 100 | |
| Housing | 617 | 195 | 100 | |
| Transportation | 129 | 125 | 100 | |
| Utilities | 131 | 128 | 100 | |
Redwood City, CA Weather
The average high in Redwood City is 66.7° and the average low is 49.1°.
There are 42.7 days of precipitation each year.
Expect an average of 24.5 inches of precipitation each year with 0.0 inches of snow.
| Stat | Redwood City |
|---|---|
| Average Annual High | 66.7 |
| Average Annual Low | 49.1 |
| Annual Precipitation Days | 42.7 |
| Average Annual Precipitation | 24.5 |
| Average Annual Snowfall | 0.0 |
Average High
Days of Rain
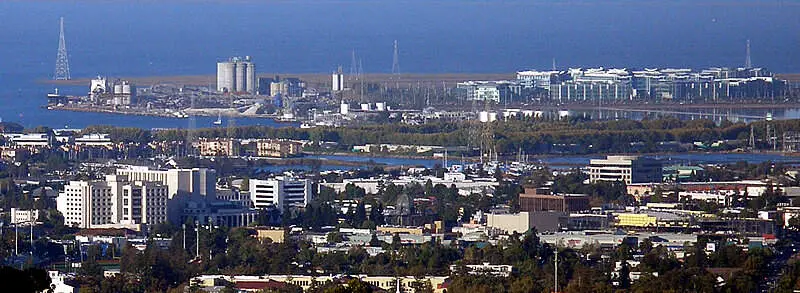
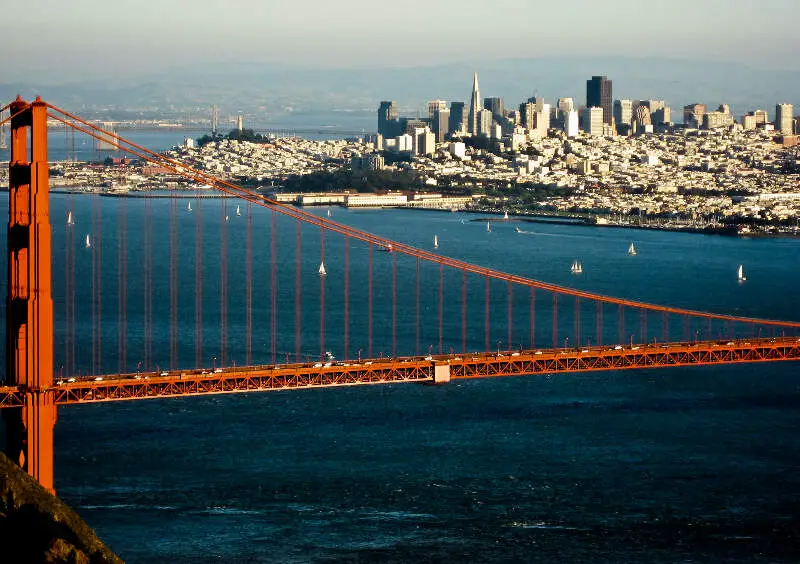
Redwood City, CA Photos
1 Reviews & Comments About Redwood City
/5

HomeSnacks User - 2018-08-03 13:29:56
Redwood City is a very quite town but yet, surrounded by some of the most beautiful trees. It's away from the bustling cities. It has it's own community but yet not that many outsiders dare to venture in and integrate as it doesn't offer much growth. The whole place however is very scenic and quiet. A perfect place to relax.
Favorite places would definitely be the Redwood Trees themselves. Amazing tall majestic trees that surrounds the coast and forests.
Rankings for Redwood City in California


Locations Around Redwood City
Map Of Redwood City, CA
Best Places Around Redwood City
Redwood City Demographics And Statistics
Population over time in Redwood City
The current population in Redwood City is 82,423. The population has increased 9.6% from 2010.
| Year | Population | % Change |
|---|---|---|
| 2023 | 82,423 | -0.8% |
| 2022 | 83,077 | -1.0% |
| 2021 | 83,905 | -0.7% |
| 2020 | 84,518 | -1.5% |
| 2019 | 85,784 | 0.7% |
| 2018 | 85,217 | 1.0% |
| 2017 | 84,368 | 2.1% |
| 2016 | 82,595 | 1.5% |
| 2015 | 81,342 | 2.0% |
| 2014 | 79,736 | 1.9% |
| 2013 | 78,241 | 1.6% |
| 2012 | 77,036 | 1.3% |
| 2011 | 76,031 | 1.1% |
| 2010 | 75,193 | - |
Race / Ethnicity in Redwood City
Redwood City is:
38.2% White with 31,484 White residents.
2.2% African American with 1,826 African American residents.
0.1% American Indian with 104 American Indian residents.
17.8% Asian with 14,667 Asian residents.
0.9% Hawaiian with 775 Hawaiian residents.
0.7% Other with 563 Other residents.
4.8% Two Or More with 3,968 Two Or More residents.
35.2% Hispanic with 29,036 Hispanic residents.
| Race | Redwood City | CA | USA |
|---|---|---|---|
| White | 38.2% | 34.6% | 58.2% |
| African American | 2.2% | 5.3% | 12.0% |
| American Indian | 0.1% | 0.3% | 0.5% |
| Asian | 17.8% | 15.1% | 5.7% |
| Hawaiian | 0.9% | 0.3% | 0.2% |
| Other | 0.7% | 0.5% | 0.5% |
| Two Or More | 4.8% | 4.1% | 3.9% |
| Hispanic | 35.2% | 39.8% | 19.0% |
Gender in Redwood City
Redwood City is 49.7% female with 40,935 female residents.
Redwood City is 50.3% male with 41,488 male residents.
| Gender | Redwood City | CA | USA |
|---|---|---|---|
| Female | 49.7% | 50.0% | 50.5% |
| Male | 50.3% | 50.0% | 49.5% |
Highest level of educational attainment in Redwood City for adults over 25
7.0% of adults in Redwood City completed < 9th grade.
5.0% of adults in Redwood City completed 9-12th grade.
15.0% of adults in Redwood City completed high school / ged.
13.0% of adults in Redwood City completed some college.
5.0% of adults in Redwood City completed associate's degree.
28.0% of adults in Redwood City completed bachelor's degree.
17.0% of adults in Redwood City completed master's degree.
4.0% of adults in Redwood City completed professional degree.
6.0% of adults in Redwood City completed doctorate degree.
| Education | Redwood City | CA | USA |
|---|---|---|---|
| < 9th Grade | 7.0% | 8.0% | 5.0% |
| 9-12th Grade | 5.0% | 7.0% | 6.0% |
| High School / GED | 15.0% | 20.0% | 26.0% |
| Some College | 13.0% | 20.0% | 19.0% |
| Associate's Degree | 5.0% | 8.0% | 9.0% |
| Bachelor's Degree | 28.0% | 22.0% | 21.0% |
| Master's Degree | 17.0% | 10.0% | 10.0% |
| Professional Degree | 4.0% | 3.0% | 2.0% |
| Doctorate Degree | 6.0% | 2.0% | 2.0% |
Household Income For Redwood City, California
2.1% of households in Redwood City earn Less than $10,000.
1.8% of households in Redwood City earn $10,000 to $14,999.
2.6% of households in Redwood City earn $15,000 to $24,999.
2.7% of households in Redwood City earn $25,000 to $34,999.
6.1% of households in Redwood City earn $35,000 to $49,999.
10.7% of households in Redwood City earn $50,000 to $74,999.
9.0% of households in Redwood City earn $75,000 to $99,999.
14.8% of households in Redwood City earn $100,000 to $149,999.
11.5% of households in Redwood City earn $150,000 to $199,999.
38.7% of households in Redwood City earn $200,000 or more.
| Income | Redwood City | CA | USA |
|---|---|---|---|
| Less than $10,000 | 2.1% | 4.4% | 4.9% |
| $10,000 to $14,999 | 1.8% | 3.0% | 3.6% |
| $15,000 to $24,999 | 2.6% | 5.2% | 6.6% |
| $25,000 to $34,999 | 2.7% | 5.5% | 6.8% |
| $35,000 to $49,999 | 6.1% | 8.4% | 10.4% |
| $50,000 to $74,999 | 10.7% | 13.3% | 15.7% |
| $75,000 to $99,999 | 9.0% | 11.8% | 12.7% |
| $100,000 to $149,999 | 14.8% | 17.9% | 17.4% |
| $150,000 to $199,999 | 11.5% | 11.1% | 9.3% |
| $200,000 or more | 38.7% | 19.4% | 12.6% |


