Ridgecrest SnackAbility
Overall SnackAbility
Crime in Ridgecrest summary. We use data from the FBI to determine the crime rates in Ridgecrest. Key points include:
There were 492 total crimes in Ridgecrest in the last reporting year.
The overall crime rate per 100,000 people in Ridgecrest is 1,750.3 / 100k people.
The violent crime rate per 100,000 people in Ridgecrest is 675.9 / 100k people.
The property crime rate per 100,000 people in Ridgecrest is 1,074.4 / 100k people.
Overall, crime in Ridgecrest is -17.41% below the national average.
Total Crimes
Below National Average
Crime In Ridgecrest Comparison Table
| Statistic | Count Raw |
Ridgecrest / 100k People |
California / 100k People |
National / 100k People |
|---|---|---|---|---|
| Total Crimes Per 100K | 492 | 1,750.3 | 2,564.5 | 2,119.2 |
| Violent Crime | 190 | 675.9 | 486.0 | 359.0 |
| Murder | 1 | 3.6 | 4.5 | 5.0 |
| Robbery | 18 | 64.0 | 119.1 | 61.0 |
| Aggravated Assault | 153 | 544.3 | 325.8 | 256.0 |
| Property Crime | 302 | 1,074.4 | 2,078.4 | 1,760.0 |
| Burglary | 45 | 160.1 | 305.8 | 229.0 |
| Larceny | 205 | 729.3 | 1,345.2 | 1,272.0 |
| Car Theft | 52 | 185.0 | 427.5 | 259.0 |
Source: FBI Uniform Crime Reporting (2024)
Cost of living in Ridgecrest summary. We use data on the cost of living to determine how expensive it is to live in Ridgecrest. Real estate prices drive most of the variance in cost of living around California. Key points include:
The cost of living in Ridgecrest is 112 with 100 being average.
The cost of living in Ridgecrest is 1.1x higher than the national average.
The median home value in Ridgecrest is $269,057.
The median income in Ridgecrest is $89,250.
Ridgecrest's Overall Cost Of Living
Higher Than The National Average
Cost Of Living In Ridgecrest Comparison Table
| Living Expense | Ridgecrest | California | National Average |
|---|---|---|---|
| Overall | 112 | 142 | 100 |
| Services | 107 | 110 | 100 |
| Groceries | 119 | 118 | 100 |
| Health | 99 | 197 | 100 |
| Housing | 118 | 120 | 100 |
| Transportation | 115 | 121 | 100 |
| Utilities | 119 | 121 | 100 |
Source: Cost of living index, normalized to US average = 100
Ridgecrest, CA Weather
The average high in Ridgecrest is 75.7° and the average low is 48.6°.
There are 22.3 days of precipitation each year.
Expect an average of 8.4 inches of precipitation each year with 1.7 inches of snow.
| Stat | Ridgecrest |
|---|---|
| Average Annual High | 75.7 |
| Average Annual Low | 48.6 |
| Annual Precipitation Days | 22.3 |
| Average Annual Precipitation | 8.4 |
| Average Annual Snowfall | 1.7 |
Average High
Days of Rain
Source: NOAA climate normals (30-year)
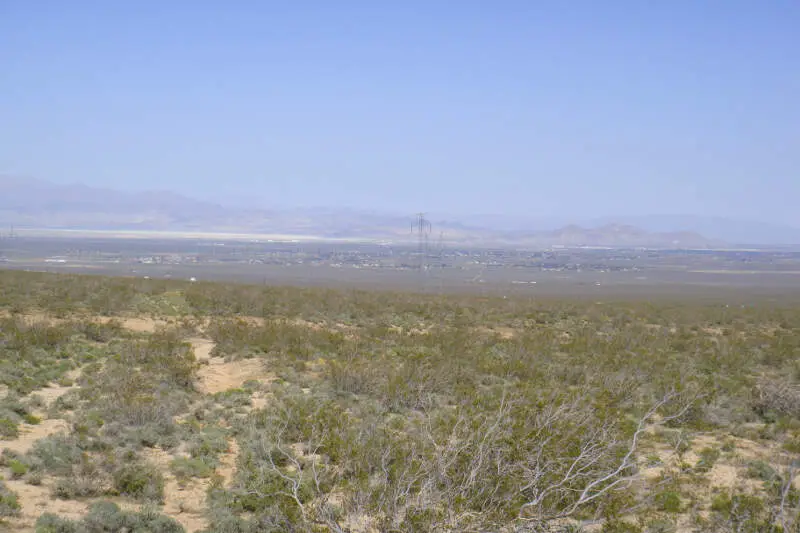
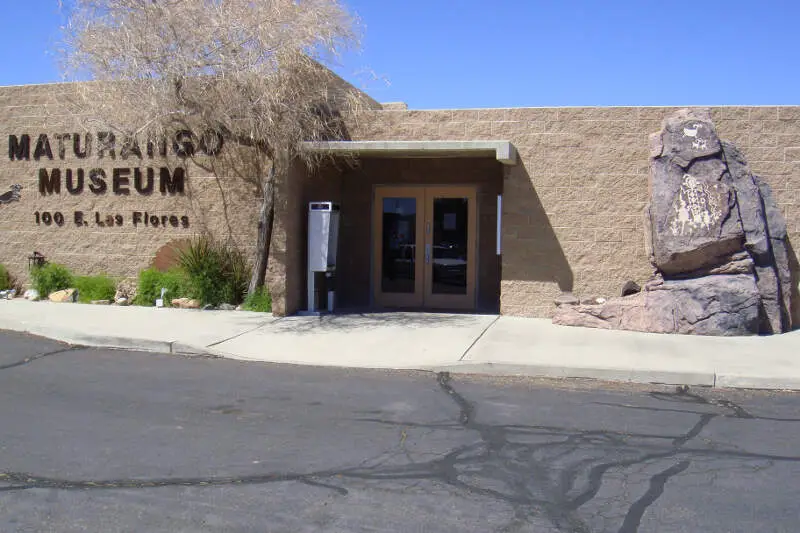
Ridgecrest, CA Photos
1 Reviews & Comments About Ridgecrest

Alright so I live in Ridgecrest and I'm gonna say most of my friends are loners or nerds! However the biggest problem with the area is the lack of care for anything besides the military base and is the reason why the area has such a high number of college graduates.
The city has been under corruption investigation and still are to this day to funneling funds into other areas that were meant to be used for education and reworking of the roads.
The schools there have so much potential however the teaching staff is often under staffed and in my senior year of high school some of my courses averaged to about 36 students a class.
Even when things try to happen such as a Casino being built creating jobs and bringing in visitors, the city council will try to stop it at all cost due to thinking it will cause higher rates of crime. Crime is however fairly bad considering the population side.
The town is also a hot bed of drugs in use and production. I knew a guy who sadly over dosed and died and he was younger than me and worked as a security guard on the base.
The police here don't care about the poor or lower middle class citizens.
I wish somebody would actually care, I stopped years ago when I tried to get more activities for children going so we can promote a heathy, fun and safe lifestyle and keep them out of trouble but the city cut the funding and instead used it for 3 new police cars and a armored tactical vehicle.
Rankings & Articles For Ridgecrest


Locations Around Ridgecrest
Map Of Ridgecrest, CA
Best Places Around Ridgecrest
Ridgecrest Demographics And Statistics
Population over time in Ridgecrest
The current population in Ridgecrest is 28,225. The population has increased 3.1% from 2010.
| Year | Population | % Change |
|---|---|---|
| 2024 | 28,225 | 0.3% |
| 2023 | 28,138 | 0.1% |
| 2022 | 28,118 | 0.5% |
| 2021 | 27,989 | -3.2% |
| 2020 | 28,905 | 0.5% |
| 2019 | 28,755 | 0.1% |
| 2018 | 28,736 | 0.0% |
| 2017 | 28,728 | 0.4% |
| 2016 | 28,604 | 0.4% |
| 2015 | 28,489 | 0.7% |
| 2014 | 28,282 | 1.0% |
| 2013 | 27,993 | 0.8% |
| 2012 | 27,776 | 0.7% |
| 2011 | 27,587 | 0.7% |
| 2010 | 27,386 | - |
Race / Ethnicity in Ridgecrest
See the full breakdown
Ridgecrest is:
60.9% White with 17,180 White residents.
3.8% African American with 1,086 African American residents.
0.3% American Indian with 79 American Indian residents.
4.2% Asian with 1,186 Asian residents.
0.3% Hawaiian with 91 Hawaiian residents.
0.6% Other with 159 Other residents.
6.3% Two Or More with 1,770 Two Or More residents.
23.6% Hispanic with 6,674 Hispanic residents.
| Race | Ridgecrest | CA | USA |
|---|---|---|---|
| White | 60.9% | 33.8% | 57.4% |
| African American | 3.8% | 5.2% | 11.9% |
| American Indian | 0.3% | 0.3% | 0.5% |
| Asian | 4.2% | 15.3% | 5.9% |
| Hawaiian | 0.3% | 0.3% | 0.2% |
| Other | 0.6% | 0.6% | 0.6% |
| Two Or More | 6.3% | 4.4% | 4.3% |
| Hispanic | 23.6% | 40.2% | 19.3% |
Gender in Ridgecrest
See the full breakdown
Ridgecrest is 47.4% female with 13,371 female residents.
Ridgecrest is 52.6% male with 14,854 male residents.
| Gender | Ridgecrest | CA | USA |
|---|---|---|---|
| Female | 47.4% | 50.1% | 50.5% |
| Male | 52.6% | 49.9% | 49.5% |
Highest level of educational attainment in Ridgecrest for adults over 25
See the full breakdown
3.0% of adults in Ridgecrest completed < 9th grade.
5.0% of adults in Ridgecrest completed 9-12th grade.
20.0% of adults in Ridgecrest completed high school / ged.
27.0% of adults in Ridgecrest completed some college.
14.0% of adults in Ridgecrest completed associate's degree.
22.0% of adults in Ridgecrest completed bachelor's degree.
8.0% of adults in Ridgecrest completed master's degree.
0.0% of adults in Ridgecrest completed professional degree.
1.0% of adults in Ridgecrest completed doctorate degree.
| Education | Ridgecrest | CA | USA |
|---|---|---|---|
| < 9th Grade | 3.0% | 8.0% | 4.0% |
| 9-12th Grade | 5.0% | 7.0% | 6.0% |
| High School / GED | 20.0% | 20.0% | 26.0% |
| Some College | 27.0% | 19.0% | 19.0% |
| Associate's Degree | 14.0% | 8.0% | 9.0% |
| Bachelor's Degree | 22.0% | 23.0% | 22.0% |
| Master's Degree | 8.0% | 10.0% | 10.0% |
| Professional Degree | 0.0% | 3.0% | 2.0% |
| Doctorate Degree | 1.0% | 2.0% | 2.0% |
Household Income For Ridgecrest, California
See the full breakdown
7.6% of households in Ridgecrest earn Less than $10,000.
2.6% of households in Ridgecrest earn $10,000 to $14,999.
6.4% of households in Ridgecrest earn $15,000 to $24,999.
4.2% of households in Ridgecrest earn $25,000 to $34,999.
7.7% of households in Ridgecrest earn $35,000 to $49,999.
15.4% of households in Ridgecrest earn $50,000 to $74,999.
13.4% of households in Ridgecrest earn $75,000 to $99,999.
20.4% of households in Ridgecrest earn $100,000 to $149,999.
10.1% of households in Ridgecrest earn $150,000 to $199,999.
12.2% of households in Ridgecrest earn $200,000 or more.
| Income | Ridgecrest | CA | USA |
|---|---|---|---|
| Less than $10,000 | 7.6% | 4.5% | 5.0% |
| $10,000 to $14,999 | 2.6% | 2.9% | 3.4% |
| $15,000 to $24,999 | 6.4% | 5.0% | 6.3% |
| $25,000 to $34,999 | 4.2% | 5.3% | 6.6% |
| $35,000 to $49,999 | 7.7% | 8.1% | 10.1% |
| $50,000 to $74,999 | 15.4% | 13.0% | 15.5% |
| $75,000 to $99,999 | 13.4% | 11.6% | 12.6% |
| $100,000 to $149,999 | 20.4% | 17.8% | 17.5% |
| $150,000 to $199,999 | 10.1% | 11.3% | 9.6% |
| $200,000 or more | 12.2% | 20.5% | 13.4% |
Source: U.S. Census ACS 5-year estimates (2024)


