San Bruno SnackAbility
Overall SnackAbility
Crime in San Bruno summary. We use data from the FBI to determine the crime rates in San Bruno. Key points include:
There were 901 total crimes in San Bruno in the last reporting year.
The overall crime rate per 100,000 people in San Bruno is 2,221.8 / 100k people.
The violent crime rate per 100,000 people in San Bruno is 256.5 / 100k people.
The property crime rate per 100,000 people in San Bruno is 1,965.3 / 100k people.
Overall, crime in San Bruno is 4.84% above the national average.
Total Crimes
Above National Average
Crime In San Bruno Comparison Table
| Statistic | Count Raw |
San Bruno / 100k People |
California / 100k People |
National / 100k People |
|---|---|---|---|---|
| Total Crimes Per 100K | 901 | 2,221.8 | 2,564.5 | 2,119.2 |
| Violent Crime | 104 | 256.5 | 486.0 | 359.0 |
| Murder | 0 | 0.0 | 4.5 | 5.0 |
| Robbery | 23 | 56.7 | 119.1 | 61.0 |
| Aggravated Assault | 75 | 184.9 | 325.8 | 256.0 |
| Property Crime | 797 | 1,965.3 | 2,078.4 | 1,760.0 |
| Burglary | 23 | 56.7 | 305.8 | 229.0 |
| Larceny | 663 | 1,634.9 | 1,345.2 | 1,272.0 |
| Car Theft | 111 | 273.7 | 427.5 | 259.0 |
Source: FBI Uniform Crime Reporting (2024)
Cost of living in San Bruno summary. We use data on the cost of living to determine how expensive it is to live in San Bruno. Real estate prices drive most of the variance in cost of living around California. Key points include:
The cost of living in San Bruno is 214 with 100 being average.
The cost of living in San Bruno is 2.1x higher than the national average.
The median home value in San Bruno is $1,327,402.
The median income in San Bruno is $141,272.
San Bruno's Overall Cost Of Living
Higher Than The National Average
Cost Of Living In San Bruno Comparison Table
| Living Expense | San Bruno | California | National Average |
|---|---|---|---|
| Overall | 214 | 142 | 100 |
| Services | 110 | 110 | 100 |
| Groceries | 112 | 118 | 100 |
| Health | 451 | 197 | 100 |
| Housing | 114 | 120 | 100 |
| Transportation | 116 | 121 | 100 |
| Utilities | 116 | 121 | 100 |
Source: Cost of living index, normalized to US average = 100
San Bruno, CA Weather
The average high in San Bruno is 66.7° and the average low is 49.1°.
There are 42.7 days of precipitation each year.
Expect an average of 24.5 inches of precipitation each year with 0.0 inches of snow.
| Stat | San Bruno |
|---|---|
| Average Annual High | 66.7 |
| Average Annual Low | 49.1 |
| Annual Precipitation Days | 42.7 |
| Average Annual Precipitation | 24.5 |
| Average Annual Snowfall | 0.0 |
Average High
Days of Rain
Source: NOAA climate normals (30-year)
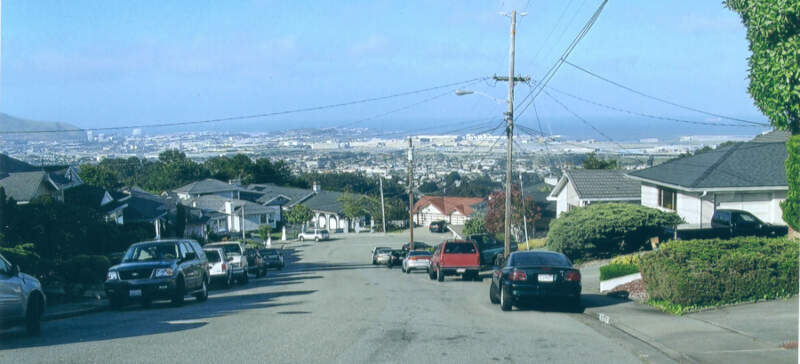
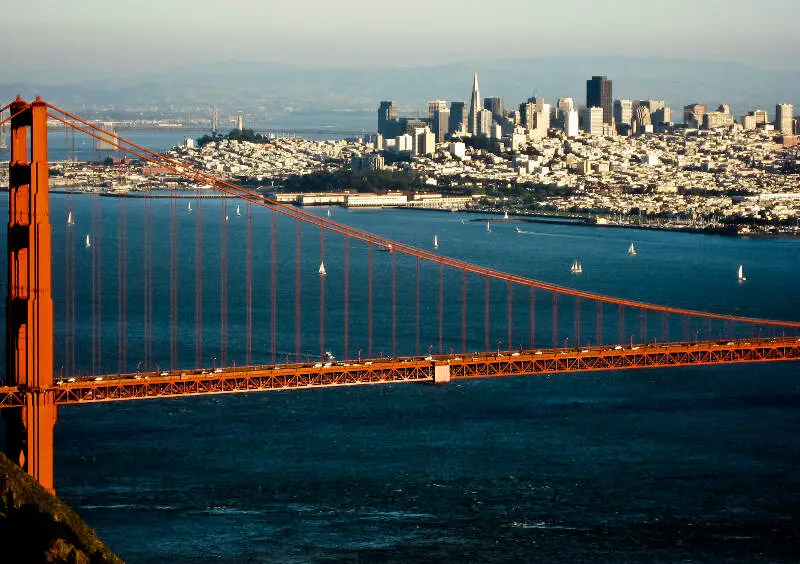
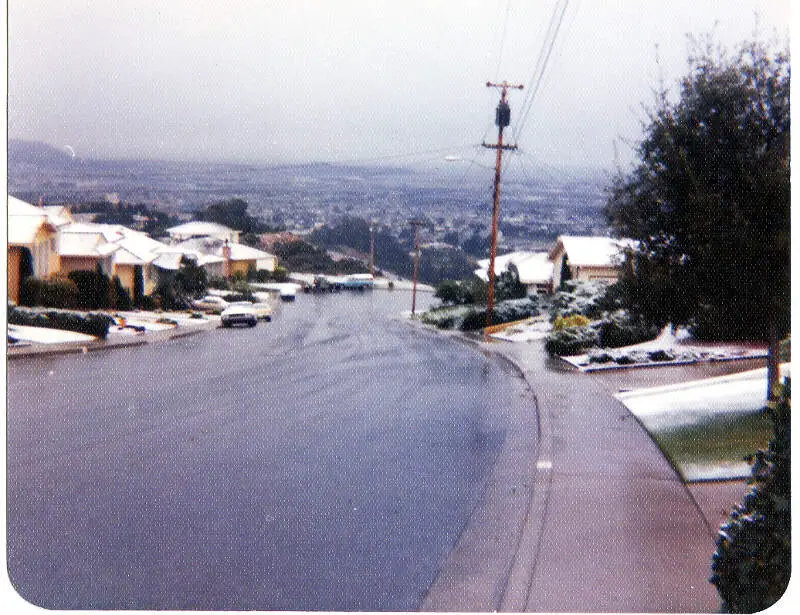
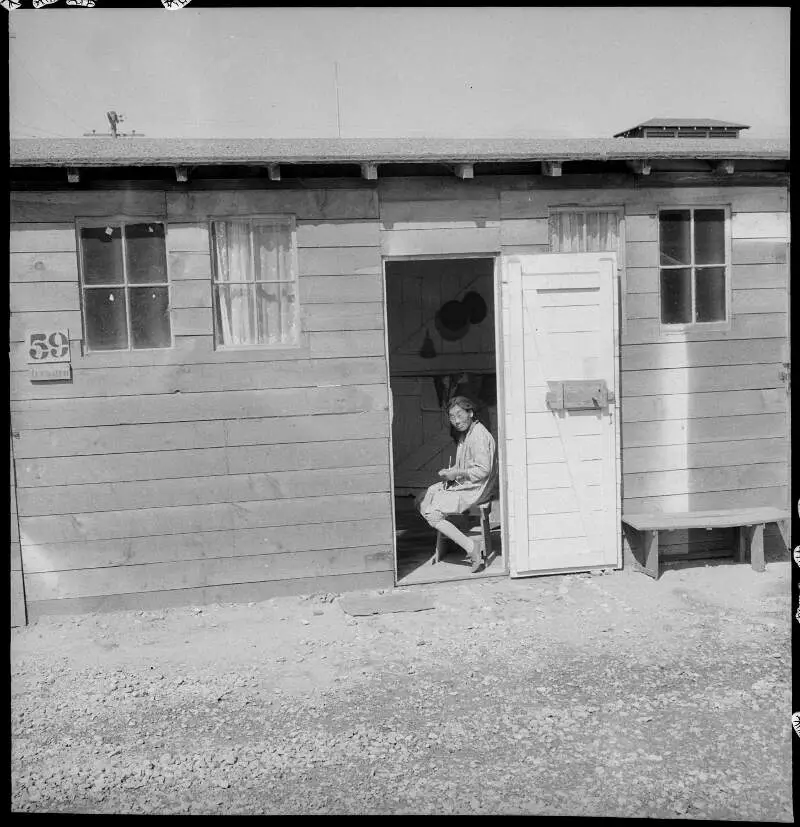
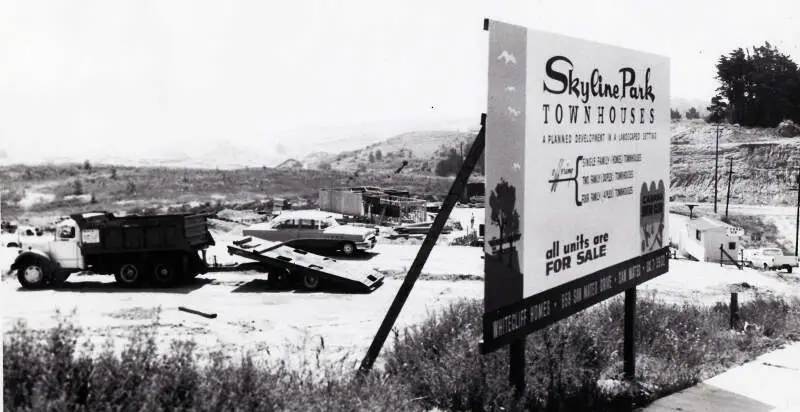
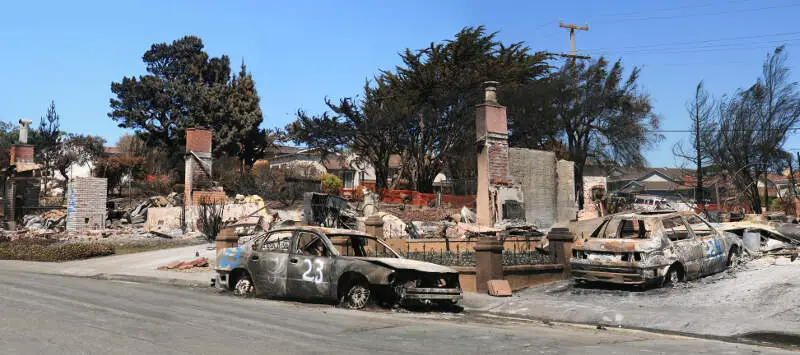
San Bruno, CA Photos

Rankings & Articles For San Bruno


Locations Around San Bruno
Map Of San Bruno, CA
Best Places Around San Bruno
San Carlos, CA
Population 29,614
Piedmont, CA
Population 10,945
San Lorenzo, CA
Population 29,171
San Mateo, CA
Population 103,105
Belmont, CA
Population 27,337
North Fair Oaks, CA
Population 13,100
Millbrae, CA
Population 22,689
Menlo Park, CA
Population 32,727
South San Francisco, CA
Population 64,305
Burlingame, CA
Population 30,525
San Bruno Demographics And Statistics
Population over time in San Bruno
The current population in San Bruno is 42,307. The population has increased 5.2% from 2010.
| Year | Population | % Change |
|---|---|---|
| 2024 | 42,307 | -0.7% |
| 2023 | 42,612 | -1.4% |
| 2022 | 43,218 | -1.3% |
| 2021 | 43,775 | -2.0% |
| 2020 | 44,663 | 3.7% |
| 2019 | 43,083 | -0.1% |
| 2018 | 43,114 | 0.0% |
| 2017 | 43,105 | 0.9% |
| 2016 | 42,736 | 0.5% |
| 2015 | 42,506 | 1.0% |
| 2014 | 42,090 | 1.2% |
| 2013 | 41,581 | 0.9% |
| 2012 | 41,214 | 1.3% |
| 2011 | 40,677 | 1.1% |
| 2010 | 40,231 | - |
Race / Ethnicity in San Bruno
See the full breakdown
San Bruno is:
28.6% White with 12,100 White residents.
2.1% African American with 891 African American residents.
0.1% American Indian with 60 American Indian residents.
31.4% Asian with 13,281 Asian residents.
2.6% Hawaiian with 1,101 Hawaiian residents.
1.0% Other with 407 Other residents.
5.0% Two Or More with 2,113 Two Or More residents.
29.2% Hispanic with 12,354 Hispanic residents.
| Race | San Bruno | CA | USA |
|---|---|---|---|
| White | 28.6% | 33.8% | 57.4% |
| African American | 2.1% | 5.2% | 11.9% |
| American Indian | 0.1% | 0.3% | 0.5% |
| Asian | 31.4% | 15.3% | 5.9% |
| Hawaiian | 2.6% | 0.3% | 0.2% |
| Other | 1.0% | 0.6% | 0.6% |
| Two Or More | 5.0% | 4.4% | 4.3% |
| Hispanic | 29.2% | 40.2% | 19.3% |
Gender in San Bruno
See the full breakdown
San Bruno is 50.3% female with 21,277 female residents.
San Bruno is 49.7% male with 21,030 male residents.
| Gender | San Bruno | CA | USA |
|---|---|---|---|
| Female | 50.3% | 50.1% | 50.5% |
| Male | 49.7% | 49.9% | 49.5% |
Highest level of educational attainment in San Bruno for adults over 25
See the full breakdown
6.0% of adults in San Bruno completed < 9th grade.
4.0% of adults in San Bruno completed 9-12th grade.
21.0% of adults in San Bruno completed high school / ged.
17.0% of adults in San Bruno completed some college.
8.0% of adults in San Bruno completed associate's degree.
30.0% of adults in San Bruno completed bachelor's degree.
9.0% of adults in San Bruno completed master's degree.
3.0% of adults in San Bruno completed professional degree.
2.0% of adults in San Bruno completed doctorate degree.
| Education | San Bruno | CA | USA |
|---|---|---|---|
| < 9th Grade | 6.0% | 8.0% | 4.0% |
| 9-12th Grade | 4.0% | 7.0% | 6.0% |
| High School / GED | 21.0% | 20.0% | 26.0% |
| Some College | 17.0% | 19.0% | 19.0% |
| Associate's Degree | 8.0% | 8.0% | 9.0% |
| Bachelor's Degree | 30.0% | 23.0% | 22.0% |
| Master's Degree | 9.0% | 10.0% | 10.0% |
| Professional Degree | 3.0% | 3.0% | 2.0% |
| Doctorate Degree | 2.0% | 2.0% | 2.0% |
Household Income For San Bruno, California
See the full breakdown
1.9% of households in San Bruno earn Less than $10,000.
2.2% of households in San Bruno earn $10,000 to $14,999.
2.3% of households in San Bruno earn $15,000 to $24,999.
4.1% of households in San Bruno earn $25,000 to $34,999.
4.6% of households in San Bruno earn $35,000 to $49,999.
11.4% of households in San Bruno earn $50,000 to $74,999.
9.9% of households in San Bruno earn $75,000 to $99,999.
16.5% of households in San Bruno earn $100,000 to $149,999.
13.5% of households in San Bruno earn $150,000 to $199,999.
33.7% of households in San Bruno earn $200,000 or more.
| Income | San Bruno | CA | USA |
|---|---|---|---|
| Less than $10,000 | 1.9% | 4.5% | 5.0% |
| $10,000 to $14,999 | 2.2% | 2.9% | 3.4% |
| $15,000 to $24,999 | 2.3% | 5.0% | 6.3% |
| $25,000 to $34,999 | 4.1% | 5.3% | 6.6% |
| $35,000 to $49,999 | 4.6% | 8.1% | 10.1% |
| $50,000 to $74,999 | 11.4% | 13.0% | 15.5% |
| $75,000 to $99,999 | 9.9% | 11.6% | 12.6% |
| $100,000 to $149,999 | 16.5% | 17.8% | 17.5% |
| $150,000 to $199,999 | 13.5% | 11.3% | 9.6% |
| $200,000 or more | 33.7% | 20.5% | 13.4% |
Source: U.S. Census ACS 5-year estimates (2024)


