San Jacinto SnackAbility
Overall SnackAbility
Crime in San Jacinto summary. We use data from the FBI to determine the crime rates in San Jacinto. Key points include:
There were 1,107 total crimes in San Jacinto in the last reporting year.
The overall crime rate per 100,000 people in San Jacinto is 1,981.6 / 100k people.
The violent crime rate per 100,000 people in San Jacinto is 254.2 / 100k people.
The property crime rate per 100,000 people in San Jacinto is 1,727.4 / 100k people.
Overall, crime in San Jacinto is -6.49% below the national average.
Total Crimes
Below National Average
Crime In San Jacinto Comparison Table
| Statistic | Count Raw |
San Jacinto / 100k People |
California / 100k People |
National / 100k People |
|---|---|---|---|---|
| Total Crimes Per 100K | 1,107 | 1,981.6 | 2,564.5 | 2,119.2 |
| Violent Crime | 142 | 254.2 | 486.0 | 359.0 |
| Murder | 2 | 3.6 | 4.5 | 5.0 |
| Robbery | 65 | 116.4 | 119.1 | 61.0 |
| Aggravated Assault | 68 | 121.7 | 325.8 | 256.0 |
| Property Crime | 965 | 1,727.4 | 2,078.4 | 1,760.0 |
| Burglary | 205 | 367.0 | 305.8 | 229.0 |
| Larceny | 614 | 1,099.1 | 1,345.2 | 1,272.0 |
| Car Theft | 146 | 261.4 | 427.5 | 259.0 |
Source: FBI Uniform Crime Reporting (2024)
Cost of living in San Jacinto summary. We use data on the cost of living to determine how expensive it is to live in San Jacinto. Real estate prices drive most of the variance in cost of living around California. Key points include:
The cost of living in San Jacinto is 122 with 100 being average.
The cost of living in San Jacinto is 1.2x higher than the national average.
The median home value in San Jacinto is $482,811.
The median income in San Jacinto is $80,647.
San Jacinto's Overall Cost Of Living
Higher Than The National Average
Cost Of Living In San Jacinto Comparison Table
| Living Expense | San Jacinto | California | National Average |
|---|---|---|---|
| Overall | 122 | 142 | 100 |
| Services | 109 | 110 | 100 |
| Groceries | 110 | 118 | 100 |
| Health | 141 | 197 | 100 |
| Housing | 113 | 120 | 100 |
| Transportation | 116 | 121 | 100 |
| Utilities | 119 | 121 | 100 |
Source: Cost of living index, normalized to US average = 100
San Jacinto, CA Weather
The average high in San Jacinto is 81.2° and the average low is 52.0°.
There are 18.0 days of precipitation each year.
Expect an average of 10.0 inches of precipitation each year with 1.7 inches of snow.
| Stat | San Jacinto |
|---|---|
| Average Annual High | 81.2 |
| Average Annual Low | 52.0 |
| Annual Precipitation Days | 18.0 |
| Average Annual Precipitation | 10.0 |
| Average Annual Snowfall | 1.7 |
Average High
Days of Rain
Source: NOAA climate normals (30-year)
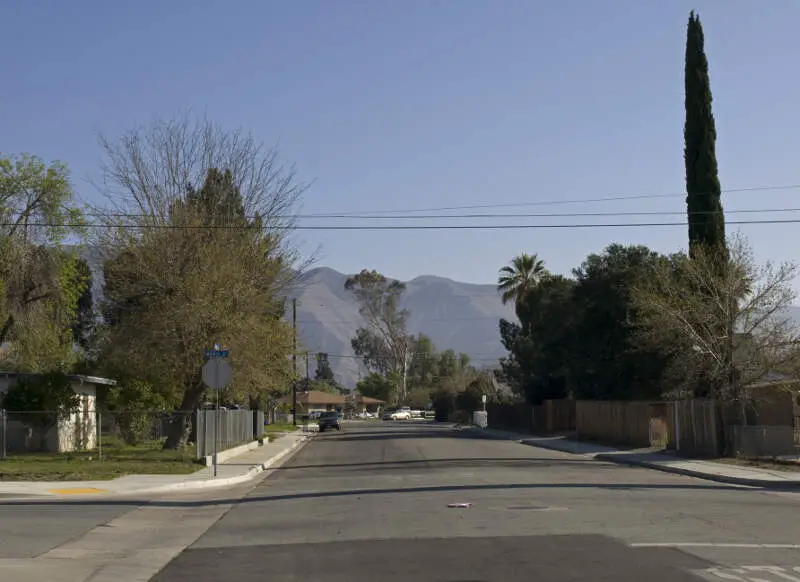
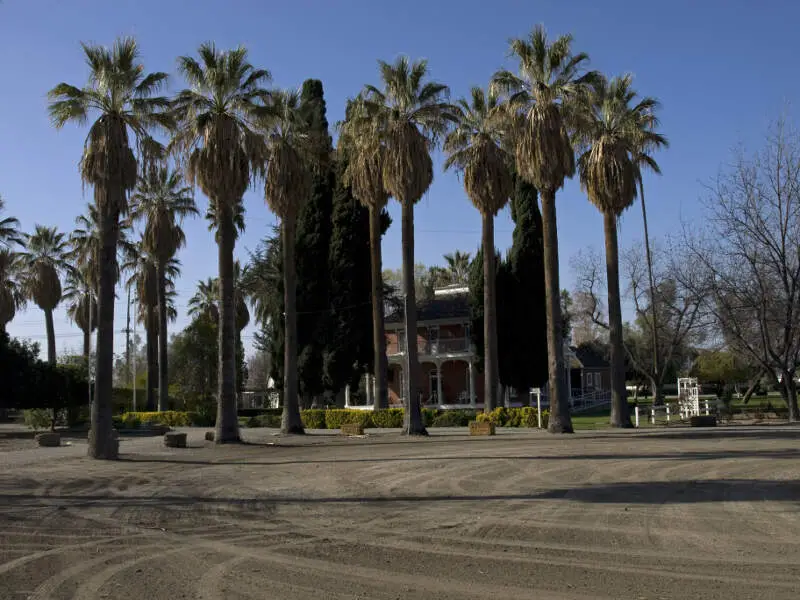
San Jacinto, CA Photos
Rankings & Articles For San Jacinto


Locations Around San Jacinto
Map Of San Jacinto, CA
Best Places Around San Jacinto
Murrieta, CA
Population 112,064
Yucaipa, CA
Population 54,421
French Valley, CA
Population 45,269
Cherry Valley, CA
Population 6,668
Canyon Lake, CA
Population 11,119
Mentone, CA
Population 9,514
Nuevo, CA
Population 6,803
East Hemet, CA
Population 20,257
Moreno Valley, CA
Population 211,666
Beaumont, CA
Population 56,266
San Jacinto Demographics And Statistics
Population over time in San Jacinto
The current population in San Jacinto is 55,180. The population has increased 33.9% from 2010.
| Year | Population | % Change |
|---|---|---|
| 2024 | 55,180 | 0.8% |
| 2023 | 54,756 | 1.3% |
| 2022 | 54,077 | 1.5% |
| 2021 | 53,299 | 9.3% |
| 2020 | 48,786 | 1.7% |
| 2019 | 47,989 | 1.1% |
| 2018 | 47,474 | 1.2% |
| 2017 | 46,932 | 1.2% |
| 2016 | 46,375 | 0.9% |
| 2015 | 45,977 | 1.1% |
| 2014 | 45,497 | 1.8% |
| 2013 | 44,676 | 2.1% |
| 2012 | 43,745 | 2.4% |
| 2011 | 42,722 | 3.7% |
| 2010 | 41,203 | - |
Race / Ethnicity in San Jacinto
See the full breakdown
San Jacinto is:
20.7% White with 11,438 White residents.
5.0% African American with 2,758 African American residents.
0.2% American Indian with 114 American Indian residents.
2.7% Asian with 1,499 Asian residents.
0.5% Hawaiian with 293 Hawaiian residents.
1.3% Other with 743 Other residents.
5.1% Two Or More with 2,812 Two Or More residents.
64.4% Hispanic with 35,523 Hispanic residents.
| Race | San Jacinto | CA | USA |
|---|---|---|---|
| White | 20.7% | 33.8% | 57.4% |
| African American | 5.0% | 5.2% | 11.9% |
| American Indian | 0.2% | 0.3% | 0.5% |
| Asian | 2.7% | 15.3% | 5.9% |
| Hawaiian | 0.5% | 0.3% | 0.2% |
| Other | 1.3% | 0.6% | 0.6% |
| Two Or More | 5.1% | 4.4% | 4.3% |
| Hispanic | 64.4% | 40.2% | 19.3% |
Gender in San Jacinto
See the full breakdown
San Jacinto is 50.2% female with 27,692 female residents.
San Jacinto is 49.8% male with 27,488 male residents.
| Gender | San Jacinto | CA | USA |
|---|---|---|---|
| Female | 50.2% | 50.1% | 50.5% |
| Male | 49.8% | 49.9% | 49.5% |
Highest level of educational attainment in San Jacinto for adults over 25
See the full breakdown
10.0% of adults in San Jacinto completed < 9th grade.
11.0% of adults in San Jacinto completed 9-12th grade.
31.0% of adults in San Jacinto completed high school / ged.
25.0% of adults in San Jacinto completed some college.
9.0% of adults in San Jacinto completed associate's degree.
10.0% of adults in San Jacinto completed bachelor's degree.
3.0% of adults in San Jacinto completed master's degree.
1.0% of adults in San Jacinto completed professional degree.
0.0% of adults in San Jacinto completed doctorate degree.
| Education | San Jacinto | CA | USA |
|---|---|---|---|
| < 9th Grade | 10.0% | 8.0% | 4.0% |
| 9-12th Grade | 11.0% | 7.0% | 6.0% |
| High School / GED | 31.0% | 20.0% | 26.0% |
| Some College | 25.0% | 19.0% | 19.0% |
| Associate's Degree | 9.0% | 8.0% | 9.0% |
| Bachelor's Degree | 10.0% | 23.0% | 22.0% |
| Master's Degree | 3.0% | 10.0% | 10.0% |
| Professional Degree | 1.0% | 3.0% | 2.0% |
| Doctorate Degree | 0.0% | 2.0% | 2.0% |
Household Income For San Jacinto, California
See the full breakdown
3.5% of households in San Jacinto earn Less than $10,000.
2.9% of households in San Jacinto earn $10,000 to $14,999.
5.5% of households in San Jacinto earn $15,000 to $24,999.
6.6% of households in San Jacinto earn $25,000 to $34,999.
10.5% of households in San Jacinto earn $35,000 to $49,999.
16.8% of households in San Jacinto earn $50,000 to $74,999.
14.5% of households in San Jacinto earn $75,000 to $99,999.
19.9% of households in San Jacinto earn $100,000 to $149,999.
11.4% of households in San Jacinto earn $150,000 to $199,999.
8.4% of households in San Jacinto earn $200,000 or more.
| Income | San Jacinto | CA | USA |
|---|---|---|---|
| Less than $10,000 | 3.5% | 4.5% | 5.0% |
| $10,000 to $14,999 | 2.9% | 2.9% | 3.4% |
| $15,000 to $24,999 | 5.5% | 5.0% | 6.3% |
| $25,000 to $34,999 | 6.6% | 5.3% | 6.6% |
| $35,000 to $49,999 | 10.5% | 8.1% | 10.1% |
| $50,000 to $74,999 | 16.8% | 13.0% | 15.5% |
| $75,000 to $99,999 | 14.5% | 11.6% | 12.6% |
| $100,000 to $149,999 | 19.9% | 17.8% | 17.5% |
| $150,000 to $199,999 | 11.4% | 11.3% | 9.6% |
| $200,000 or more | 8.4% | 20.5% | 13.4% |
Source: U.S. Census ACS 5-year estimates (2024)


