Santa Rosa SnackAbility
Overall SnackAbility
Crime in Santa Rosa summary. We use data from the FBI to determine the crime rates in Santa Rosa. Key points include:
There were 2,912 total crimes in Santa Rosa in the last reporting year.
The overall crime rate per 100,000 people in Santa Rosa is 1,662.6 / 100k people.
The violent crime rate per 100,000 people in Santa Rosa is 342.6 / 100k people.
The property crime rate per 100,000 people in Santa Rosa is 1,320.0 / 100k people.
Overall, crime in Santa Rosa is -21.55% below the national average.
Total Crimes
Below National Average
Crime In Santa Rosa Comparison Table
| Statistic | Count Raw |
Santa Rosa / 100k People |
California / 100k People |
National / 100k People |
|---|---|---|---|---|
| Total Crimes Per 100K | 2,912 | 1,662.6 | 2,564.5 | 2,119.2 |
| Violent Crime | 600 | 342.6 | 486.0 | 359.0 |
| Murder | 2 | 1.1 | 4.5 | 5.0 |
| Robbery | 117 | 66.8 | 119.1 | 61.0 |
| Aggravated Assault | 363 | 207.3 | 325.8 | 256.0 |
| Property Crime | 2,312 | 1,320.0 | 2,078.4 | 1,760.0 |
| Burglary | 405 | 231.2 | 305.8 | 229.0 |
| Larceny | 1,610 | 919.2 | 1,345.2 | 1,272.0 |
| Car Theft | 297 | 169.6 | 427.5 | 259.0 |
Source: FBI Uniform Crime Reporting (2024)
Cost of living in Santa Rosa summary. We use data on the cost of living to determine how expensive it is to live in Santa Rosa. Real estate prices drive most of the variance in cost of living around California. Key points include:
The cost of living in Santa Rosa is 164 with 100 being average.
The cost of living in Santa Rosa is 1.6x higher than the national average.
The median home value in Santa Rosa is $718,725.
The median income in Santa Rosa is $99,060.
Santa Rosa's Overall Cost Of Living
Higher Than The National Average
Cost Of Living In Santa Rosa Comparison Table
| Living Expense | Santa Rosa | California | National Average |
|---|---|---|---|
| Overall | 164 | 142 | 100 |
| Services | 111 | 110 | 100 |
| Groceries | 116 | 118 | 100 |
| Health | 270 | 197 | 100 |
| Housing | 120 | 120 | 100 |
| Transportation | 123 | 121 | 100 |
| Utilities | 123 | 121 | 100 |
Source: Cost of living index, normalized to US average = 100
Santa Rosa, CA Weather
The average high in Santa Rosa is 69.7° and the average low is 46.0°.
There are 54.5 days of precipitation each year.
Expect an average of 40.4 inches of precipitation each year with 0.1 inches of snow.
| Stat | Santa Rosa |
|---|---|
| Average Annual High | 69.7 |
| Average Annual Low | 46.0 |
| Annual Precipitation Days | 54.5 |
| Average Annual Precipitation | 40.4 |
| Average Annual Snowfall | 0.1 |
Average High
Days of Rain
Source: NOAA climate normals (30-year)
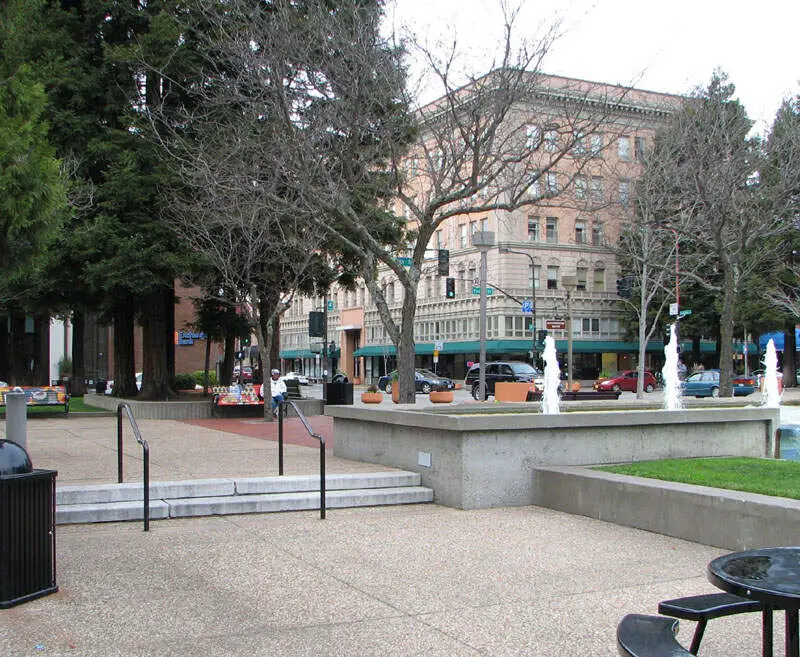
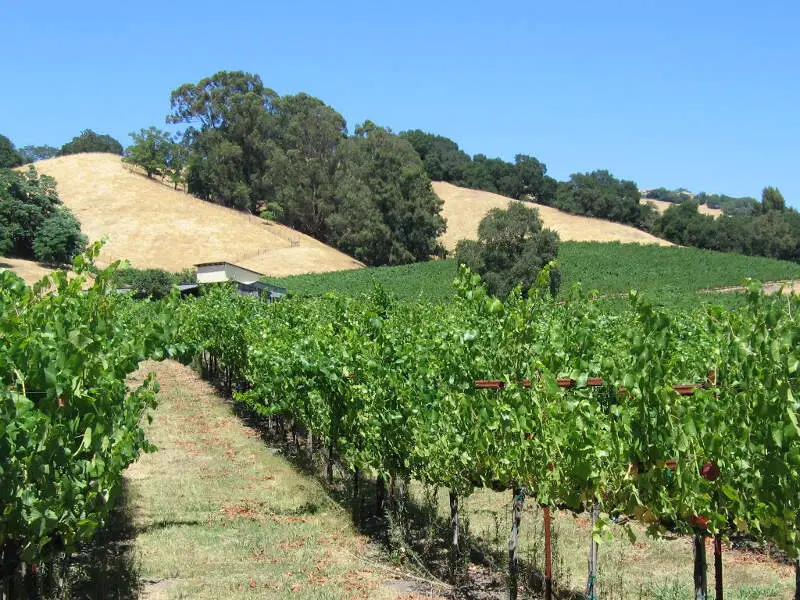
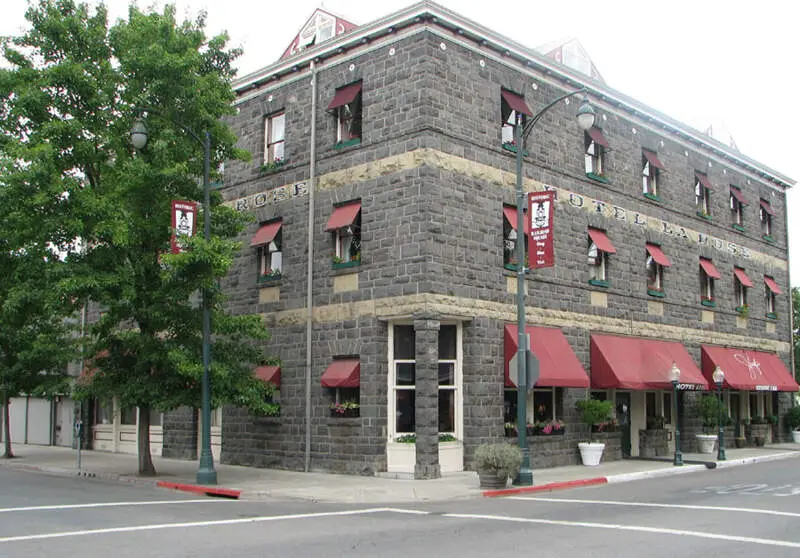
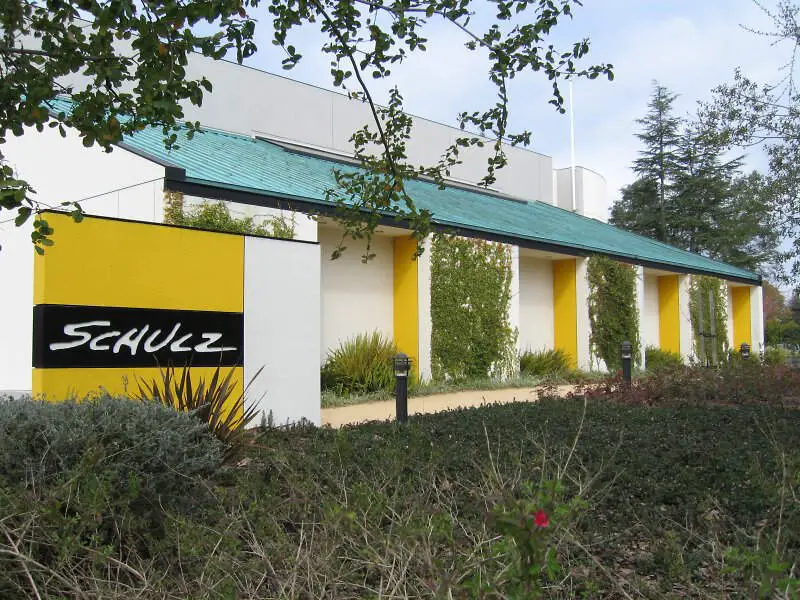
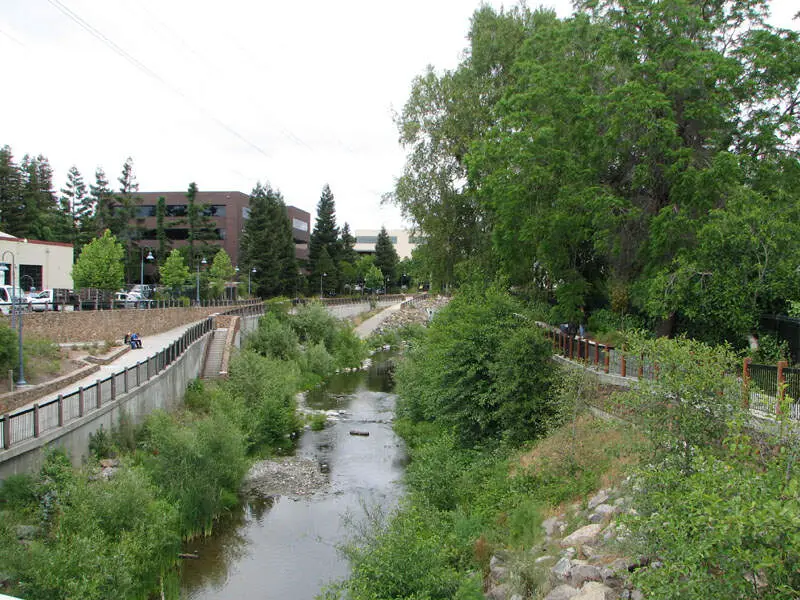
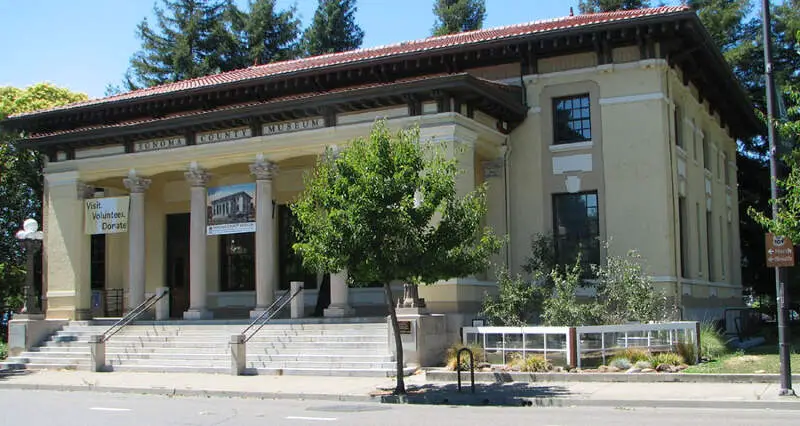
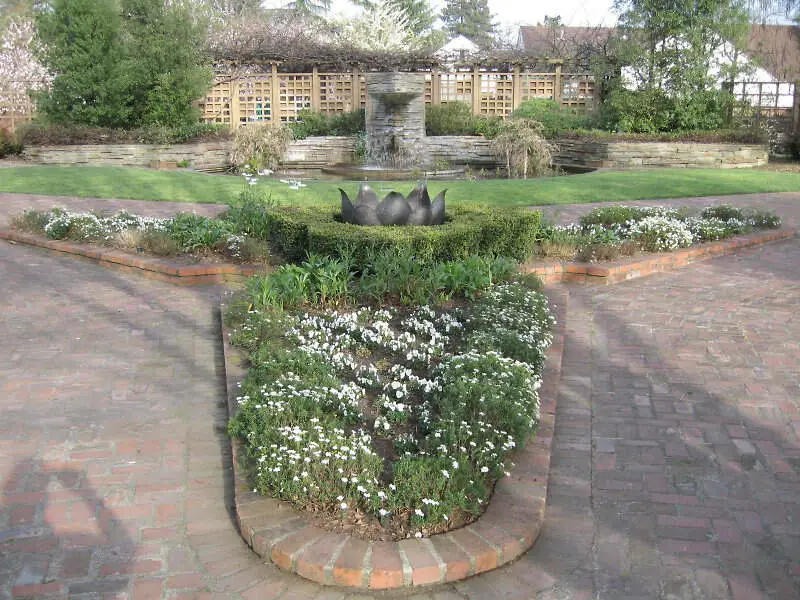
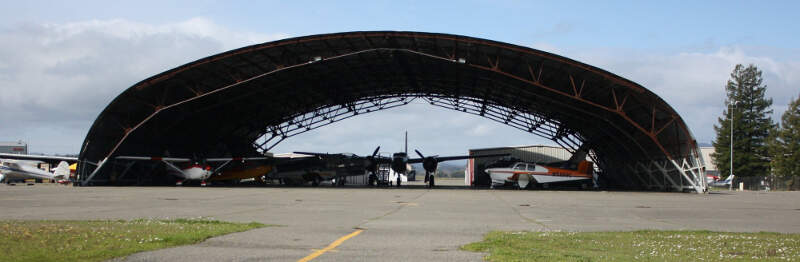
Santa Rosa, CA Photos
Rankings & Articles For Santa Rosa


Locations Around Santa Rosa
Map Of Santa Rosa, CA
Best Places Around Santa Rosa
Windsor, CA
Population 26,081
Cotati, CA
Population 7,489
Petaluma, CA
Population 59,247
Larkfield-Wikiup, CA
Population 8,765
Sebastopol, CA
Population 7,445
Rohnert Park, CA
Population 44,575
Healdsburg, CA
Population 11,243
St. Helena, CA
Population 5,318
Oakville, CT
Population 9,276
Santa Rosa Demographics And Statistics
Population over time in Santa Rosa
The current population in Santa Rosa is 177,090. The population has increased 8.9% from 2010.
| Year | Population | % Change |
|---|---|---|
| 2024 | 177,090 | -0.1% |
| 2023 | 177,216 | -0.6% |
| 2022 | 178,221 | -0.6% |
| 2021 | 179,213 | 0.5% |
| 2020 | 178,391 | -0.7% |
| 2019 | 179,701 | -0.7% |
| 2018 | 181,038 | 3.9% |
| 2017 | 174,244 | 0.6% |
| 2016 | 173,165 | 0.6% |
| 2015 | 172,066 | 0.8% |
| 2014 | 170,782 | 1.1% |
| 2013 | 169,005 | 1.1% |
| 2012 | 167,207 | 1.4% |
| 2011 | 164,976 | 1.4% |
| 2010 | 162,647 | - |
Race / Ethnicity in Santa Rosa
See the full breakdown
Santa Rosa is:
48.7% White with 86,260 White residents.
1.9% African American with 3,312 African American residents.
0.3% American Indian with 524 American Indian residents.
6.3% Asian with 11,103 Asian residents.
0.3% Hawaiian with 590 Hawaiian residents.
0.6% Other with 1,140 Other residents.
4.5% Two Or More with 7,950 Two Or More residents.
37.4% Hispanic with 66,211 Hispanic residents.
| Race | Santa Rosa | CA | USA |
|---|---|---|---|
| White | 48.7% | 33.8% | 57.4% |
| African American | 1.9% | 5.2% | 11.9% |
| American Indian | 0.3% | 0.3% | 0.5% |
| Asian | 6.3% | 15.3% | 5.9% |
| Hawaiian | 0.3% | 0.3% | 0.2% |
| Other | 0.6% | 0.6% | 0.6% |
| Two Or More | 4.5% | 4.4% | 4.3% |
| Hispanic | 37.4% | 40.2% | 19.3% |
Gender in Santa Rosa
See the full breakdown
Santa Rosa is 51.2% female with 90,736 female residents.
Santa Rosa is 48.8% male with 86,353 male residents.
| Gender | Santa Rosa | CA | USA |
|---|---|---|---|
| Female | 51.2% | 50.1% | 50.5% |
| Male | 48.8% | 49.9% | 49.5% |
Highest level of educational attainment in Santa Rosa for adults over 25
See the full breakdown
9.0% of adults in Santa Rosa completed < 9th grade.
6.0% of adults in Santa Rosa completed 9-12th grade.
19.0% of adults in Santa Rosa completed high school / ged.
21.0% of adults in Santa Rosa completed some college.
10.0% of adults in Santa Rosa completed associate's degree.
22.0% of adults in Santa Rosa completed bachelor's degree.
9.0% of adults in Santa Rosa completed master's degree.
3.0% of adults in Santa Rosa completed professional degree.
1.0% of adults in Santa Rosa completed doctorate degree.
| Education | Santa Rosa | CA | USA |
|---|---|---|---|
| < 9th Grade | 9.0% | 8.0% | 4.0% |
| 9-12th Grade | 6.0% | 7.0% | 6.0% |
| High School / GED | 19.0% | 20.0% | 26.0% |
| Some College | 21.0% | 19.0% | 19.0% |
| Associate's Degree | 10.0% | 8.0% | 9.0% |
| Bachelor's Degree | 22.0% | 23.0% | 22.0% |
| Master's Degree | 9.0% | 10.0% | 10.0% |
| Professional Degree | 3.0% | 3.0% | 2.0% |
| Doctorate Degree | 1.0% | 2.0% | 2.0% |
Household Income For Santa Rosa, California
See the full breakdown
4.0% of households in Santa Rosa earn Less than $10,000.
2.7% of households in Santa Rosa earn $10,000 to $14,999.
4.0% of households in Santa Rosa earn $15,000 to $24,999.
4.2% of households in Santa Rosa earn $25,000 to $34,999.
7.6% of households in Santa Rosa earn $35,000 to $49,999.
15.3% of households in Santa Rosa earn $50,000 to $74,999.
12.6% of households in Santa Rosa earn $75,000 to $99,999.
18.8% of households in Santa Rosa earn $100,000 to $149,999.
12.2% of households in Santa Rosa earn $150,000 to $199,999.
18.6% of households in Santa Rosa earn $200,000 or more.
| Income | Santa Rosa | CA | USA |
|---|---|---|---|
| Less than $10,000 | 4.0% | 4.5% | 5.0% |
| $10,000 to $14,999 | 2.7% | 2.9% | 3.4% |
| $15,000 to $24,999 | 4.0% | 5.0% | 6.3% |
| $25,000 to $34,999 | 4.2% | 5.3% | 6.6% |
| $35,000 to $49,999 | 7.6% | 8.1% | 10.1% |
| $50,000 to $74,999 | 15.3% | 13.0% | 15.5% |
| $75,000 to $99,999 | 12.6% | 11.6% | 12.6% |
| $100,000 to $149,999 | 18.8% | 17.8% | 17.5% |
| $150,000 to $199,999 | 12.2% | 11.3% | 9.6% |
| $200,000 or more | 18.6% | 20.5% | 13.4% |
Source: U.S. Census ACS 5-year estimates (2024)


