Walnut Creek SnackAbility
Overall SnackAbility
Crime in Walnut Creek summary. We use data from the FBI to determine the crime rates in Walnut Creek. Key points include:
There were 2,187 total crimes in Walnut Creek in the last reporting year.
The overall crime rate per 100,000 people in Walnut Creek is 3,178.4 / 100k people.
The violent crime rate per 100,000 people in Walnut Creek is 280.5 / 100k people.
The property crime rate per 100,000 people in Walnut Creek is 2,897.9 / 100k people.
Overall, crime in Walnut Creek is 49.98% above the national average.
Total Crimes
Above National Average
Crime In Walnut Creek Comparison Table
| Statistic | Count Raw |
Walnut Creek / 100k People |
California / 100k People |
National / 100k People |
|---|---|---|---|---|
| Total Crimes Per 100K | 2,187 | 3,178.4 | 2,564.5 | 2,119.2 |
| Violent Crime | 193 | 280.5 | 486.0 | 359.0 |
| Murder | 0 | 0.0 | 4.5 | 5.0 |
| Robbery | 59 | 85.7 | 119.1 | 61.0 |
| Aggravated Assault | 117 | 170.0 | 325.8 | 256.0 |
| Property Crime | 1,994 | 2,897.9 | 2,078.4 | 1,760.0 |
| Burglary | 268 | 389.5 | 305.8 | 229.0 |
| Larceny | 1,553 | 2,257.0 | 1,345.2 | 1,272.0 |
| Car Theft | 173 | 251.4 | 427.5 | 259.0 |
Source: FBI Uniform Crime Reporting (2024)
Cost of living in Walnut Creek summary. We use data on the cost of living to determine how expensive it is to live in Walnut Creek. Real estate prices drive most of the variance in cost of living around California. Key points include:
The cost of living in Walnut Creek is 198 with 100 being average.
The cost of living in Walnut Creek is 2.0x higher than the national average.
The median home value in Walnut Creek is $1,045,017.
The median income in Walnut Creek is $130,432.
Walnut Creek's Overall Cost Of Living
Higher Than The National Average
Cost Of Living In Walnut Creek Comparison Table
| Living Expense | Walnut Creek | California | National Average |
|---|---|---|---|
| Overall | 198 | 142 | 100 |
| Services | 112 | 110 | 100 |
| Groceries | 113 | 118 | 100 |
| Health | 381 | 197 | 100 |
| Housing | 122 | 120 | 100 |
| Transportation | 122 | 121 | 100 |
| Utilities | 122 | 121 | 100 |
Source: Cost of living index, normalized to US average = 100
Walnut Creek, CA Weather
The average high in Walnut Creek is 70.4° and the average low is 48.6°.
There are 41.7 days of precipitation each year.
Expect an average of 21.0 inches of precipitation each year with 0.2 inches of snow.
| Stat | Walnut Creek |
|---|---|
| Average Annual High | 70.4 |
| Average Annual Low | 48.6 |
| Annual Precipitation Days | 41.7 |
| Average Annual Precipitation | 21.0 |
| Average Annual Snowfall | 0.2 |
Average High
Days of Rain
Source: NOAA climate normals (30-year)
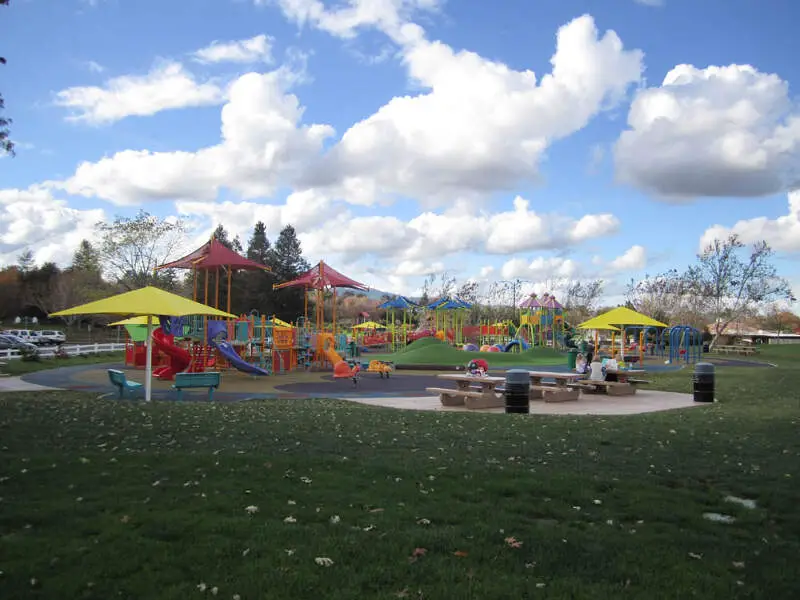
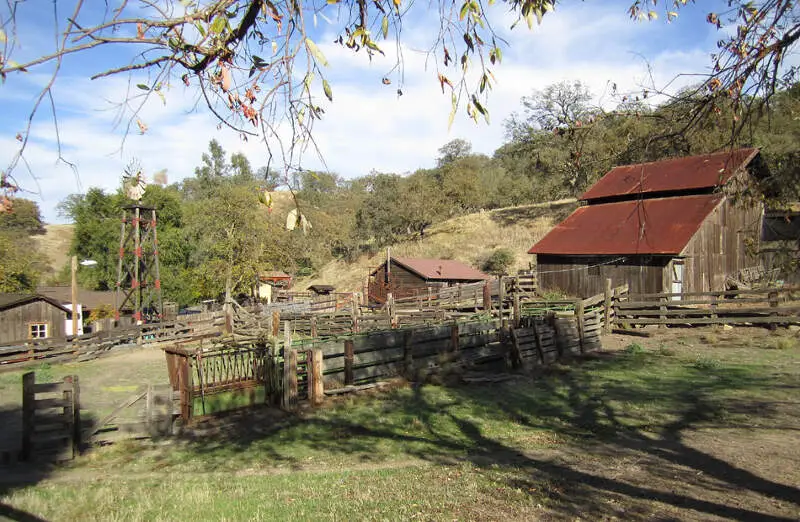
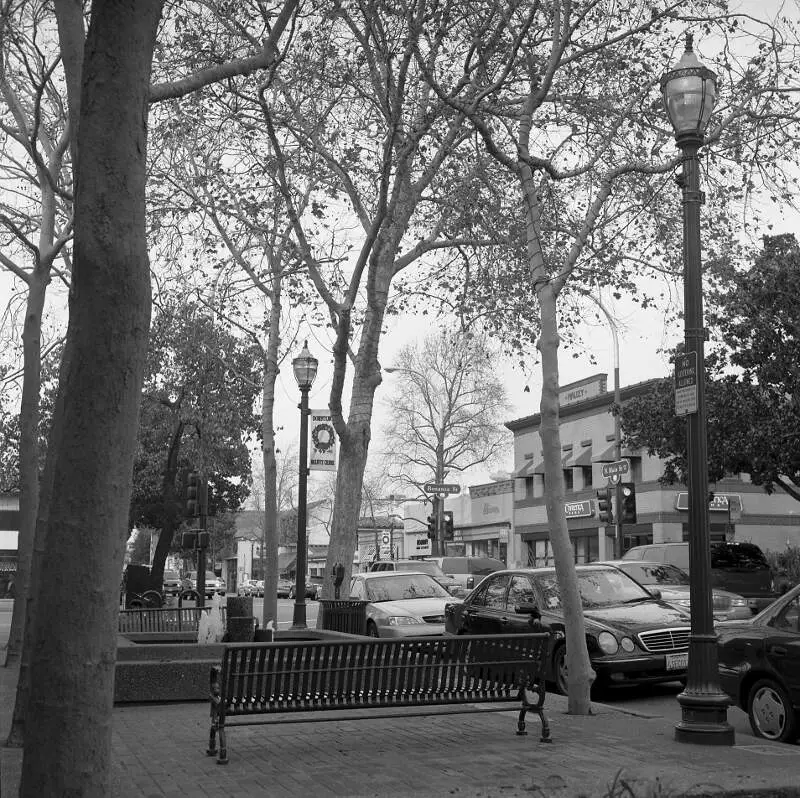
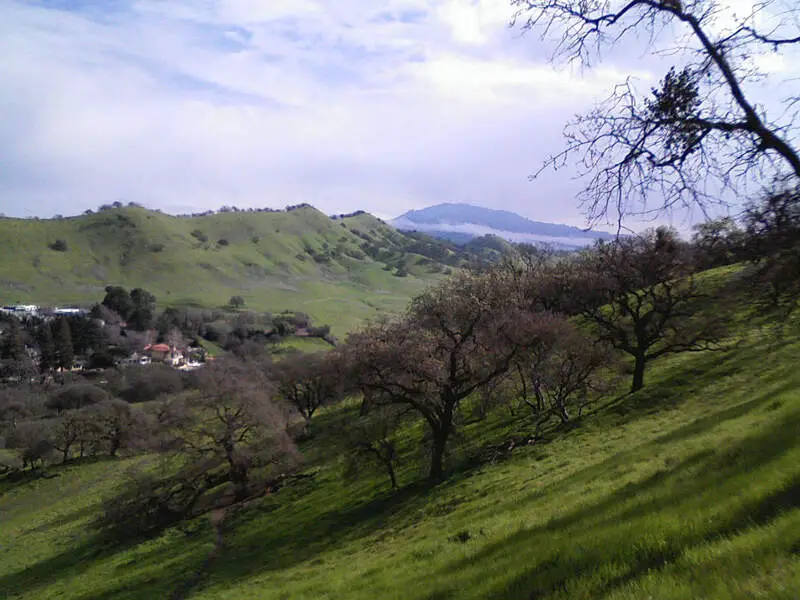
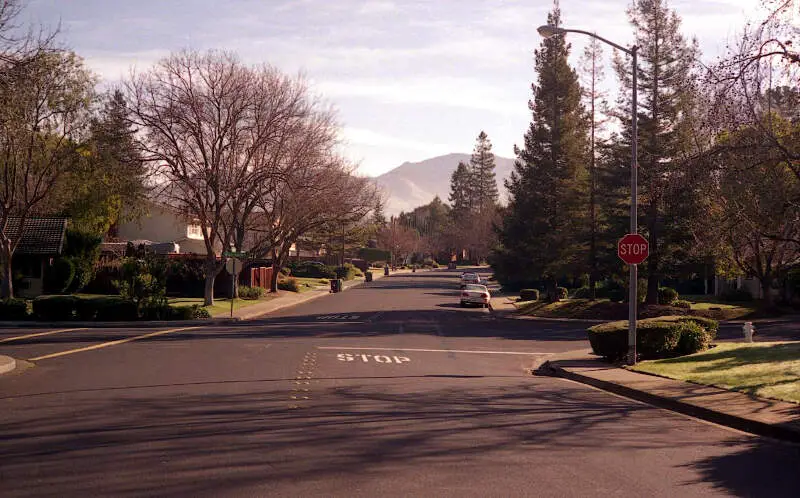
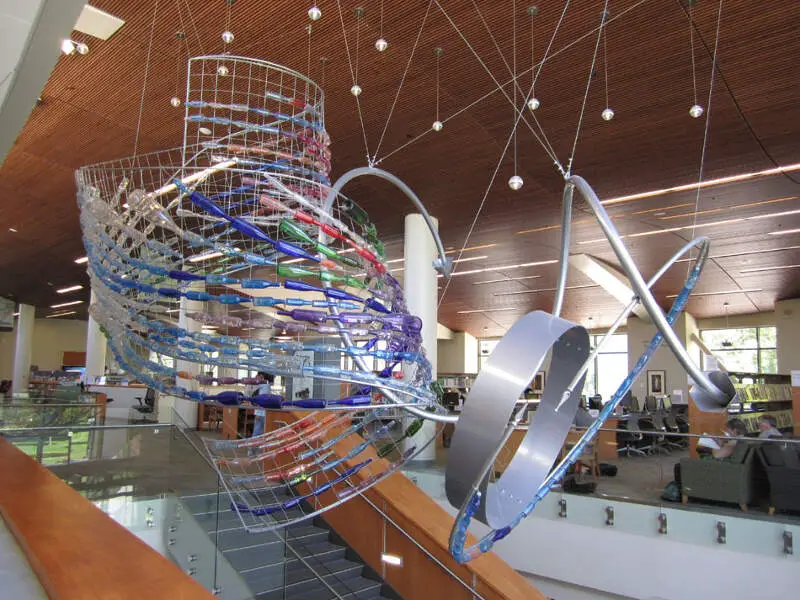
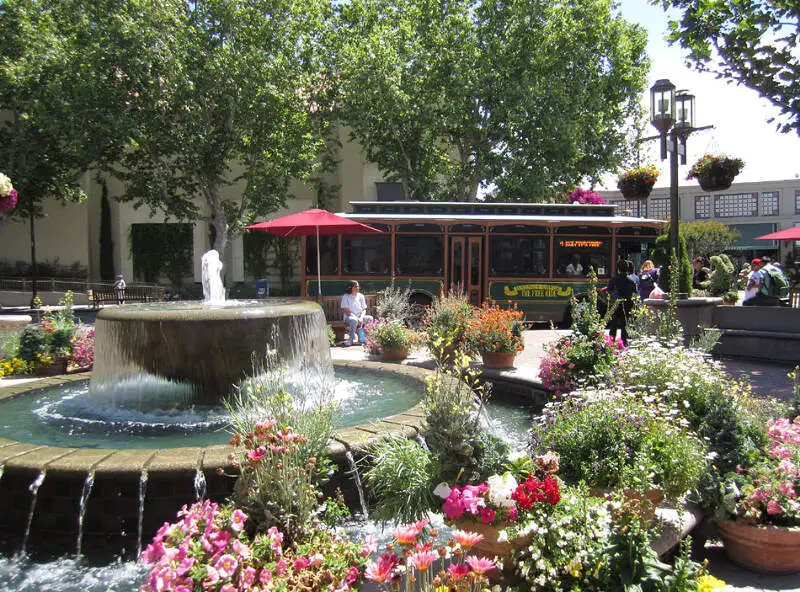
Walnut Creek, CA Photos


Rankings & Articles For Walnut Creek


Locations Around Walnut Creek
Map Of Walnut Creek, CA
Best Places Around Walnut Creek
Piedmont, CA
Population 10,945
San Lorenzo, CA
Population 29,171
San Ramon, CA
Population 85,993
Kensington, CA
Population 5,179
Pleasanton, CA
Population 76,960
Fairview, CA
Population 10,745
Dublin, CA
Population 70,803
Mountain View, CA
Population 83,732
Lafayette, CA
Population 25,285
Danville, CA
Population 43,401
Walnut Creek Demographics And Statistics
Population over time in Walnut Creek
The current population in Walnut Creek is 70,088. The population has increased 9.8% from 2010.
| Year | Population | % Change |
|---|---|---|
| 2024 | 70,088 | 0.4% |
| 2023 | 69,790 | -0.0% |
| 2022 | 69,809 | -0.1% |
| 2021 | 69,876 | 0.1% |
| 2020 | 69,836 | 0.4% |
| 2019 | 69,567 | 0.8% |
| 2018 | 69,007 | 0.7% |
| 2017 | 68,516 | 1.4% |
| 2016 | 67,568 | 1.2% |
| 2015 | 66,799 | 1.3% |
| 2014 | 65,923 | 1.2% |
| 2013 | 65,122 | 0.9% |
| 2012 | 64,515 | 0.5% |
| 2011 | 64,168 | 0.6% |
| 2010 | 63,808 | - |
Race / Ethnicity in Walnut Creek
See the full breakdown
Walnut Creek is:
61.3% White with 42,965 White residents.
1.8% African American with 1,245 African American residents.
0.1% American Indian with 101 American Indian residents.
17.1% Asian with 11,956 Asian residents.
0.1% Hawaiian with 47 Hawaiian residents.
0.8% Other with 526 Other residents.
6.5% Two Or More with 4,556 Two Or More residents.
12.4% Hispanic with 8,692 Hispanic residents.
| Race | Walnut Creek | CA | USA |
|---|---|---|---|
| White | 61.3% | 33.8% | 57.4% |
| African American | 1.8% | 5.2% | 11.9% |
| American Indian | 0.1% | 0.3% | 0.5% |
| Asian | 17.1% | 15.3% | 5.9% |
| Hawaiian | 0.1% | 0.3% | 0.2% |
| Other | 0.8% | 0.6% | 0.6% |
| Two Or More | 6.5% | 4.4% | 4.3% |
| Hispanic | 12.4% | 40.2% | 19.3% |
Gender in Walnut Creek
See the full breakdown
Walnut Creek is 52.3% female with 36,660 female residents.
Walnut Creek is 47.7% male with 33,428 male residents.
| Gender | Walnut Creek | CA | USA |
|---|---|---|---|
| Female | 52.3% | 50.1% | 50.5% |
| Male | 47.7% | 49.9% | 49.5% |
Highest level of educational attainment in Walnut Creek for adults over 25
See the full breakdown
1.0% of adults in Walnut Creek completed < 9th grade.
1.0% of adults in Walnut Creek completed 9-12th grade.
9.0% of adults in Walnut Creek completed high school / ged.
12.0% of adults in Walnut Creek completed some college.
6.0% of adults in Walnut Creek completed associate's degree.
40.0% of adults in Walnut Creek completed bachelor's degree.
20.0% of adults in Walnut Creek completed master's degree.
7.0% of adults in Walnut Creek completed professional degree.
4.0% of adults in Walnut Creek completed doctorate degree.
| Education | Walnut Creek | CA | USA |
|---|---|---|---|
| < 9th Grade | 1.0% | 8.0% | 4.0% |
| 9-12th Grade | 1.0% | 7.0% | 6.0% |
| High School / GED | 9.0% | 20.0% | 26.0% |
| Some College | 12.0% | 19.0% | 19.0% |
| Associate's Degree | 6.0% | 8.0% | 9.0% |
| Bachelor's Degree | 40.0% | 23.0% | 22.0% |
| Master's Degree | 20.0% | 10.0% | 10.0% |
| Professional Degree | 7.0% | 3.0% | 2.0% |
| Doctorate Degree | 4.0% | 2.0% | 2.0% |
Household Income For Walnut Creek, California
See the full breakdown
3.2% of households in Walnut Creek earn Less than $10,000.
1.9% of households in Walnut Creek earn $10,000 to $14,999.
3.1% of households in Walnut Creek earn $15,000 to $24,999.
3.5% of households in Walnut Creek earn $25,000 to $34,999.
7.3% of households in Walnut Creek earn $35,000 to $49,999.
9.4% of households in Walnut Creek earn $50,000 to $74,999.
10.2% of households in Walnut Creek earn $75,000 to $99,999.
16.0% of households in Walnut Creek earn $100,000 to $149,999.
12.8% of households in Walnut Creek earn $150,000 to $199,999.
32.6% of households in Walnut Creek earn $200,000 or more.
| Income | Walnut Creek | CA | USA |
|---|---|---|---|
| Less than $10,000 | 3.2% | 4.5% | 5.0% |
| $10,000 to $14,999 | 1.9% | 2.9% | 3.4% |
| $15,000 to $24,999 | 3.1% | 5.0% | 6.3% |
| $25,000 to $34,999 | 3.5% | 5.3% | 6.6% |
| $35,000 to $49,999 | 7.3% | 8.1% | 10.1% |
| $50,000 to $74,999 | 9.4% | 13.0% | 15.5% |
| $75,000 to $99,999 | 10.2% | 11.6% | 12.6% |
| $100,000 to $149,999 | 16.0% | 17.8% | 17.5% |
| $150,000 to $199,999 | 12.8% | 11.3% | 9.6% |
| $200,000 or more | 32.6% | 20.5% | 13.4% |
Source: U.S. Census ACS 5-year estimates (2024)


