Yreka SnackAbility
Overall SnackAbility
Crime in Yreka summary. We use data from the FBI to determine the crime rates in Yreka. Key points include:
There were 246 total crimes in Yreka in the last reporting year.
The overall crime rate per 100,000 people in Yreka is 3,148.6 / 100k people.
The violent crime rate per 100,000 people in Yreka is 704.0 / 100k people.
The property crime rate per 100,000 people in Yreka is 2,444.6 / 100k people.
Overall, crime in Yreka is 48.57% above the national average.
Total Crimes
Above National Average
Crime In Yreka Comparison Table
| Statistic | Count Raw |
Yreka / 100k People |
California / 100k People |
National / 100k People |
|---|---|---|---|---|
| Total Crimes Per 100K | 246 | 3,148.6 | 2,564.5 | 2,119.2 |
| Violent Crime | 55 | 704.0 | 486.0 | 359.0 |
| Murder | 0 | 0.0 | 4.5 | 5.0 |
| Robbery | 6 | 76.8 | 119.1 | 61.0 |
| Aggravated Assault | 40 | 512.0 | 325.8 | 256.0 |
| Property Crime | 191 | 2,444.6 | 2,078.4 | 1,760.0 |
| Burglary | 10 | 128.0 | 305.8 | 229.0 |
| Larceny | 169 | 2,163.1 | 1,345.2 | 1,272.0 |
| Car Theft | 12 | 153.6 | 427.5 | 259.0 |
Source: FBI Uniform Crime Reporting (2024)
Cost of living in Yreka summary. We use data on the cost of living to determine how expensive it is to live in Yreka. Real estate prices drive most of the variance in cost of living around California. Key points include:
The cost of living in Yreka is 104 with 100 being average.
The cost of living in Yreka is 1.0x higher than the national average.
The median home value in Yreka is $250,942.
The median income in Yreka is $43,982.
Yreka's Overall Cost Of Living
Higher Than The National Average
Cost Of Living In Yreka Comparison Table
| Living Expense | Yreka | California | National Average |
|---|---|---|---|
| Overall | 104 | 142 | 100 |
| Services | 108 | 110 | 100 |
| Groceries | 107 | 118 | 100 |
| Health | 98 | 197 | 100 |
| Housing | 105 | 120 | 100 |
| Transportation | 109 | 121 | 100 |
| Utilities | 108 | 121 | 100 |
Source: Cost of living index, normalized to US average = 100
Yreka, CA Weather
The average high in Yreka is 65.5° and the average low is 37.9°.
There are 55.1 days of precipitation each year.
Expect an average of 29.6 inches of precipitation each year with 26.7 inches of snow.
| Stat | Yreka |
|---|---|
| Average Annual High | 65.5 |
| Average Annual Low | 37.9 |
| Annual Precipitation Days | 55.1 |
| Average Annual Precipitation | 29.6 |
| Average Annual Snowfall | 26.7 |
Average High
Days of Rain
Source: NOAA climate normals (30-year)
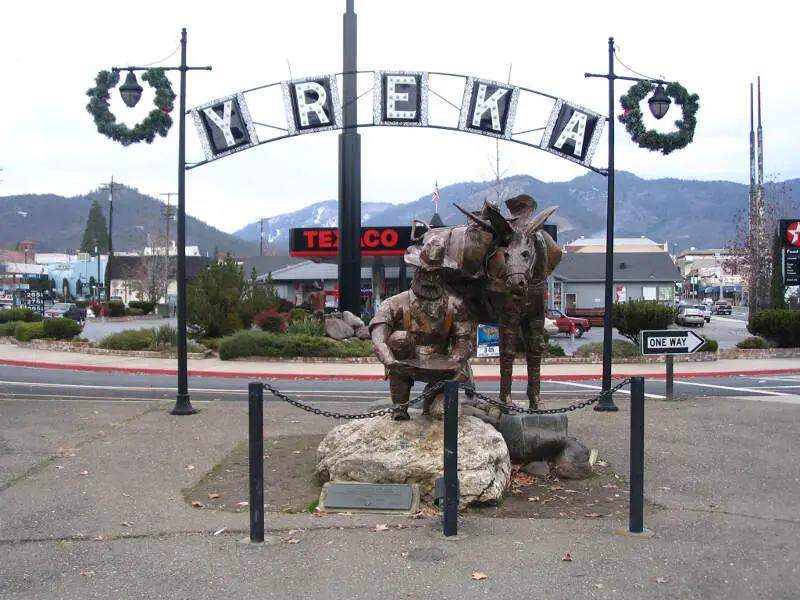
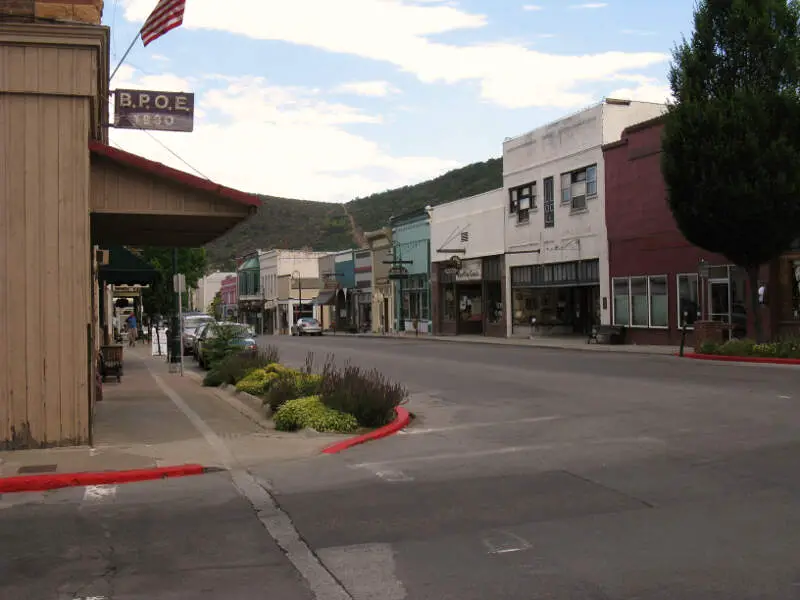
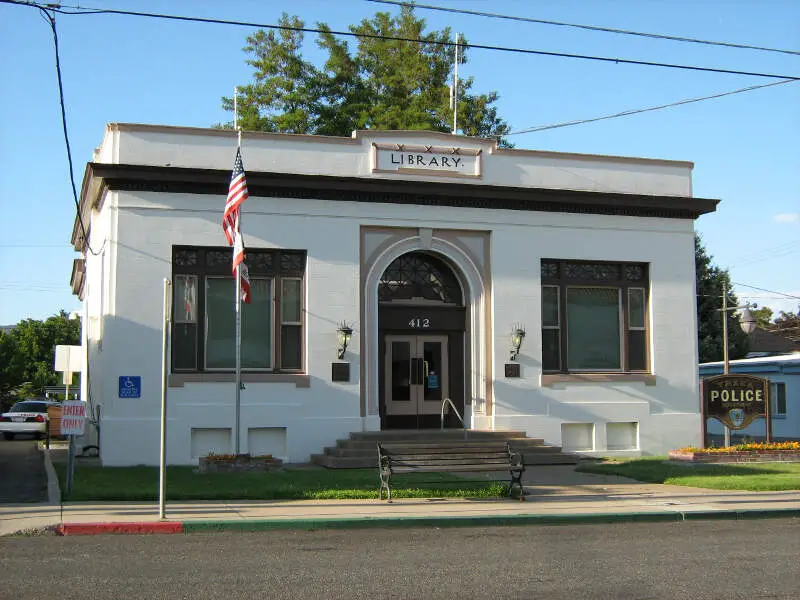
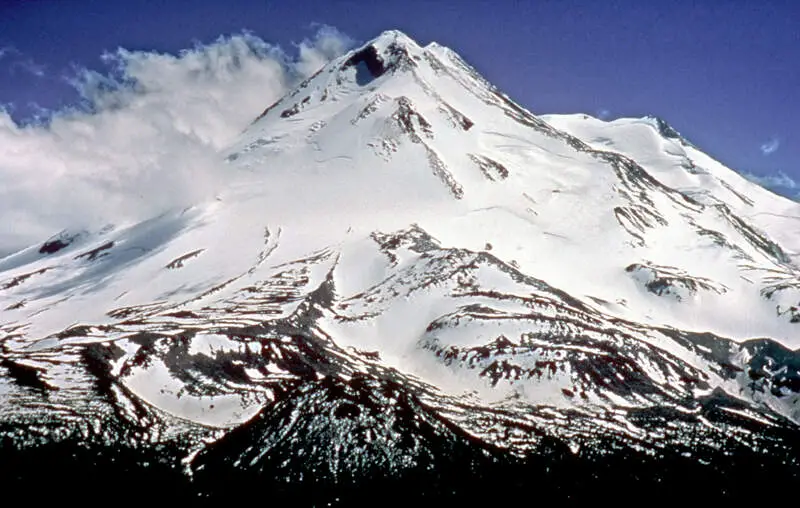
Yreka, CA Photos
1 Reviews & Comments About Yreka

The crime rate in Yreka has increased tremendously since I was a child. Mostly of burglary.
Favorite places would have to be Greenhorn Park and the Fairgrounds.
Rankings & Articles For Yreka


Locations Around Yreka
Map Of Yreka, CA
Best Places Around Yreka
Central Point, OR
Population 19,216
Ashland, OR
Population 21,259
Medford, OR
Population 86,315
Talent, OR
Population 6,254
Yreka Demographics And Statistics
Population over time in Yreka
The current population in Yreka is 7,820. The population has increased 1.9% from 2010.
| Year | Population | % Change |
|---|---|---|
| 2024 | 7,820 | -0.2% |
| 2023 | 7,832 | -0.0% |
| 2022 | 7,833 | 0.3% |
| 2021 | 7,807 | 2.9% |
| 2020 | 7,589 | 0.4% |
| 2019 | 7,562 | 0.1% |
| 2018 | 7,551 | -0.3% |
| 2017 | 7,571 | -0.4% |
| 2016 | 7,598 | -0.5% |
| 2015 | 7,635 | -0.5% |
| 2014 | 7,675 | -0.4% |
| 2013 | 7,702 | -0.4% |
| 2012 | 7,732 | 0.5% |
| 2011 | 7,696 | 0.3% |
| 2010 | 7,676 | - |
Race / Ethnicity in Yreka
See the full breakdown
Yreka is:
73.8% White with 5,769 White residents.
1.8% African American with 137 African American residents.
3.8% American Indian with 300 American Indian residents.
0.3% Asian with 25 Asian residents.
0.0% Hawaiian with 3 Hawaiian residents.
0.2% Other with 15 Other residents.
5.3% Two Or More with 418 Two Or More residents.
14.7% Hispanic with 1,153 Hispanic residents.
| Race | Yreka | CA | USA |
|---|---|---|---|
| White | 73.8% | 33.8% | 57.4% |
| African American | 1.8% | 5.2% | 11.9% |
| American Indian | 3.8% | 0.3% | 0.5% |
| Asian | 0.3% | 15.3% | 5.9% |
| Hawaiian | 0.0% | 0.3% | 0.2% |
| Other | 0.2% | 0.6% | 0.6% |
| Two Or More | 5.3% | 4.4% | 4.3% |
| Hispanic | 14.7% | 40.2% | 19.3% |
Gender in Yreka
See the full breakdown
Yreka is 52.7% female with 4,124 female residents.
Yreka is 47.3% male with 3,695 male residents.
| Gender | Yreka | CA | USA |
|---|---|---|---|
| Female | 52.7% | 50.1% | 50.5% |
| Male | 47.3% | 49.9% | 49.5% |
Highest level of educational attainment in Yreka for adults over 25
See the full breakdown
4.0% of adults in Yreka completed < 9th grade.
7.0% of adults in Yreka completed 9-12th grade.
31.0% of adults in Yreka completed high school / ged.
29.0% of adults in Yreka completed some college.
10.0% of adults in Yreka completed associate's degree.
13.0% of adults in Yreka completed bachelor's degree.
4.0% of adults in Yreka completed master's degree.
2.0% of adults in Yreka completed professional degree.
0.0% of adults in Yreka completed doctorate degree.
| Education | Yreka | CA | USA |
|---|---|---|---|
| < 9th Grade | 4.0% | 8.0% | 4.0% |
| 9-12th Grade | 7.0% | 7.0% | 6.0% |
| High School / GED | 31.0% | 20.0% | 26.0% |
| Some College | 29.0% | 19.0% | 19.0% |
| Associate's Degree | 10.0% | 8.0% | 9.0% |
| Bachelor's Degree | 13.0% | 23.0% | 22.0% |
| Master's Degree | 4.0% | 10.0% | 10.0% |
| Professional Degree | 2.0% | 3.0% | 2.0% |
| Doctorate Degree | 0.0% | 2.0% | 2.0% |
Household Income For Yreka, California
See the full breakdown
6.7% of households in Yreka earn Less than $10,000.
6.7% of households in Yreka earn $10,000 to $14,999.
18.7% of households in Yreka earn $15,000 to $24,999.
7.4% of households in Yreka earn $25,000 to $34,999.
12.8% of households in Yreka earn $35,000 to $49,999.
15.7% of households in Yreka earn $50,000 to $74,999.
6.0% of households in Yreka earn $75,000 to $99,999.
14.2% of households in Yreka earn $100,000 to $149,999.
5.7% of households in Yreka earn $150,000 to $199,999.
6.0% of households in Yreka earn $200,000 or more.
| Income | Yreka | CA | USA |
|---|---|---|---|
| Less than $10,000 | 6.7% | 4.5% | 5.0% |
| $10,000 to $14,999 | 6.7% | 2.9% | 3.4% |
| $15,000 to $24,999 | 18.7% | 5.0% | 6.3% |
| $25,000 to $34,999 | 7.4% | 5.3% | 6.6% |
| $35,000 to $49,999 | 12.8% | 8.1% | 10.1% |
| $50,000 to $74,999 | 15.7% | 13.0% | 15.5% |
| $75,000 to $99,999 | 6.0% | 11.6% | 12.6% |
| $100,000 to $149,999 | 14.2% | 17.8% | 17.5% |
| $150,000 to $199,999 | 5.7% | 11.3% | 9.6% |
| $200,000 or more | 6.0% | 20.5% | 13.4% |
Source: U.S. Census ACS 5-year estimates (2024)


