Golden, CO
Demographics And Statistics
Living In Golden, Colorado Summary
Life in Golden research summary. HomeSnacks has been using Saturday Night Science to research the quality of life in Golden over the past nine years using Census, FBI, Zillow, and other primary data sources. Based on the most recently available data, we found the following about life in Golden:
The population in Golden is 20,467.
The median home value in Golden is $855,735.
The median income in Golden is $95,913.
The cost of living in Golden is 144 which is 1.4x higher than the national average.
The median rent in Golden is $1,854.
The unemployment rate in Golden is 4.5%.
The poverty rate in Golden is 13.0%.
The average high in Golden is 62.8° and the average low is 34.5°.
Golden SnackAbility
Overall SnackAbility
Golden, CO Crime Report
Crime in Golden summary. We use data from the FBI to determine the crime rates in Golden. Key points include:
There were 507 total crimes in Golden in the last reporting year.
The overall crime rate per 100,000 people in Golden is 2,510.8 / 100k people.
The violent crime rate per 100,000 people in Golden is 123.8 / 100k people.
The property crime rate per 100,000 people in Golden is 2,387.0 / 100k people.
Overall, crime in Golden is 18.48% above the national average.
Total Crimes
Above National Average
Crime In Golden Comparison Table
| Statistic | Count Raw |
Golden / 100k People |
Colorado / 100k People |
National / 100k People |
|---|---|---|---|---|
| Total Crimes Per 100K | 507 | 2,510.8 | 3,069.1 | 2,119.2 |
| Violent Crime | 25 | 123.8 | 476.3 | 359.0 |
| Murder | 0 | 0.0 | 4.5 | 5.0 |
| Robbery | 3 | 14.9 | 63.0 | 61.0 |
| Aggravated Assault | 21 | 104.0 | 350.5 | 256.0 |
| Property Crime | 482 | 2,387.0 | 2,592.8 | 1,760.0 |
| Burglary | 51 | 252.6 | 348.0 | 229.0 |
| Larceny | 370 | 1,832.3 | 1,754.2 | 1,272.0 |
| Car Theft | 61 | 302.1 | 490.6 | 259.0 |
Golden, CO Cost Of Living
Cost of living in Golden summary. We use data on the cost of living to determine how expensive it is to live in Golden. Real estate prices drive most of the variance in cost of living around Colorado. Key points include:
The cost of living in Golden is 144 with 100 being average.
The cost of living in Golden is 1.4x higher than the national average.
The median home value in Golden is $855,735.
The median income in Golden is $95,913.
Golden's Overall Cost Of Living
Higher Than The National Average
Cost Of Living In Golden Comparison Table
| Living Expense | Golden | Colorado | National Average | |
|---|---|---|---|---|
| Overall | 144 | 111 | 100 | |
| Services | 103 | 102 | 100 | |
| Groceries | 95 | 103 | 100 | |
| Health | 87 | 101 | 100 | |
| Housing | 253 | 134 | 100 | |
| Transportation | 107 | 107 | 100 | |
| Utilities | 86 | 89 | 100 | |
Golden, CO Weather
The average high in Golden is 62.8° and the average low is 34.5°.
There are 45.7 days of precipitation each year.
Expect an average of 18.1 inches of precipitation each year with 78.6 inches of snow.
| Stat | Golden |
|---|---|
| Average Annual High | 62.8 |
| Average Annual Low | 34.5 |
| Annual Precipitation Days | 45.7 |
| Average Annual Precipitation | 18.1 |
| Average Annual Snowfall | 78.6 |
Average High
Days of Rain
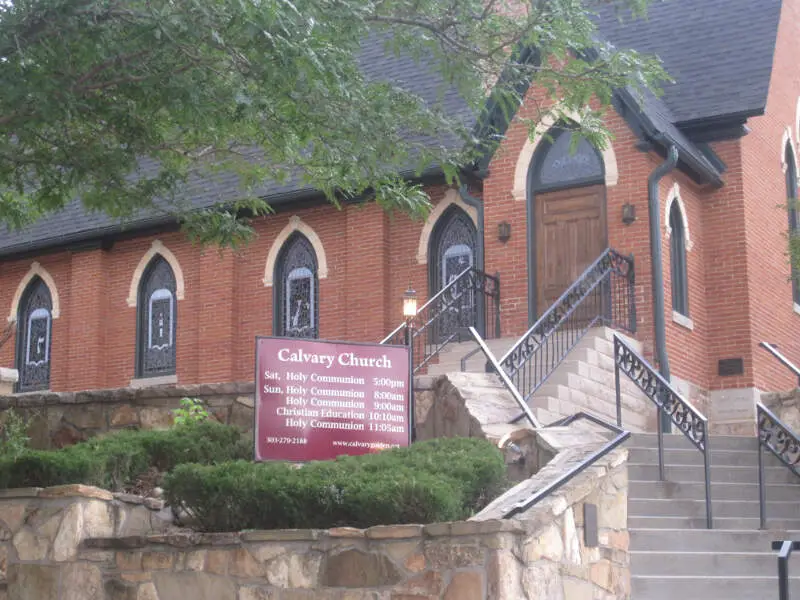
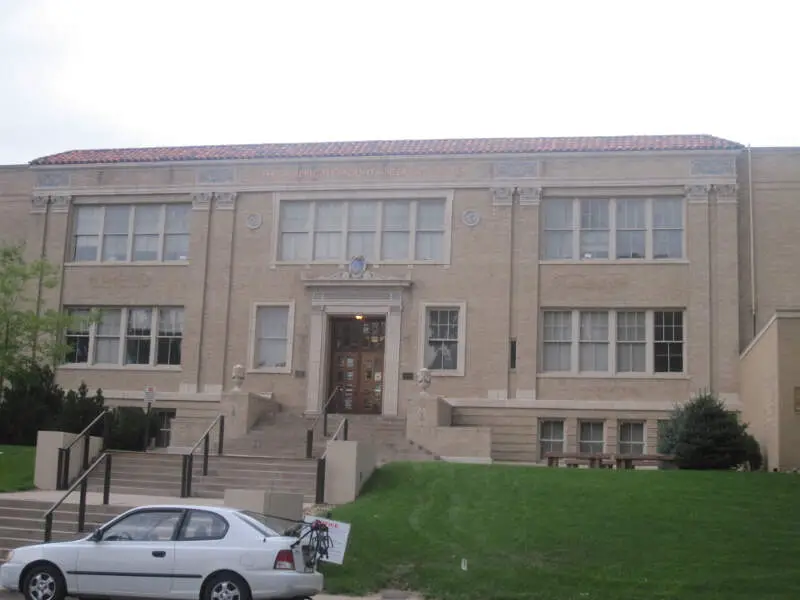
Golden, CO Photos


Rankings for Golden in Colorado


Locations Around Golden
Map Of Golden, CO
Best Places Around Golden
Sheridan, CO
Population 6,031
Federal Heights, CO
Population 14,160
Berkley, CO
Population 10,838
Englewood, CO
Population 33,774
Welby, CO
Population 16,232
Sherrelwood, CO
Population 19,368
Denver, CO
Population 713,734
Wheat Ridge, CO
Population 32,158
Central, LA
Population 29,603
Northglenn, CO
Population 37,953
Golden Demographics And Statistics
Population over time in Golden
The current population in Golden is 20,467. The population has increased 11.1% from 2010.
| Year | Population | % Change |
|---|---|---|
| 2023 | 20,467 | 0.0% |
| 2022 | 20,461 | 2.1% |
| 2021 | 20,041 | -1.7% |
| 2020 | 20,391 | -1.5% |
| 2019 | 20,693 | -0.5% |
| 2018 | 20,798 | 2.1% |
| 2017 | 20,365 | 0.5% |
| 2016 | 20,268 | 2.5% |
| 2015 | 19,780 | 0.1% |
| 2014 | 19,759 | 3.8% |
| 2013 | 19,034 | 1.4% |
| 2012 | 18,775 | 0.8% |
| 2011 | 18,630 | 1.2% |
| 2010 | 18,414 | - |
Race / Ethnicity in Golden
Golden is:
82.4% White with 16,859 White residents.
1.5% African American with 309 African American residents.
0.4% American Indian with 72 American Indian residents.
4.1% Asian with 844 Asian residents.
0.1% Hawaiian with 14 Hawaiian residents.
0.4% Other with 90 Other residents.
3.9% Two Or More with 794 Two Or More residents.
7.3% Hispanic with 1,485 Hispanic residents.
| Race | Golden | CO | USA |
|---|---|---|---|
| White | 82.4% | 65.7% | 58.2% |
| African American | 1.5% | 3.8% | 12.0% |
| American Indian | 0.4% | 0.4% | 0.5% |
| Asian | 4.1% | 3.2% | 5.7% |
| Hawaiian | 0.1% | 0.1% | 0.2% |
| Other | 0.4% | 0.4% | 0.5% |
| Two Or More | 3.9% | 4.2% | 3.9% |
| Hispanic | 7.3% | 22.2% | 19.0% |
Gender in Golden
Golden is 41.0% female with 8,398 female residents.
Golden is 59.0% male with 12,068 male residents.
| Gender | Golden | CO | USA |
|---|---|---|---|
| Female | 41.0% | 49.4% | 50.5% |
| Male | 59.0% | 50.6% | 49.5% |
Highest level of educational attainment in Golden for adults over 25
1.0% of adults in Golden completed < 9th grade.
3.0% of adults in Golden completed 9-12th grade.
17.0% of adults in Golden completed high school / ged.
16.0% of adults in Golden completed some college.
4.0% of adults in Golden completed associate's degree.
28.0% of adults in Golden completed bachelor's degree.
22.0% of adults in Golden completed master's degree.
3.0% of adults in Golden completed professional degree.
6.0% of adults in Golden completed doctorate degree.
| Education | Golden | CO | USA |
|---|---|---|---|
| < 9th Grade | 1.0% | 2.0% | 5.0% |
| 9-12th Grade | 3.0% | 4.0% | 6.0% |
| High School / GED | 17.0% | 20.0% | 26.0% |
| Some College | 16.0% | 20.0% | 19.0% |
| Associate's Degree | 4.0% | 8.0% | 9.0% |
| Bachelor's Degree | 28.0% | 28.0% | 21.0% |
| Master's Degree | 22.0% | 13.0% | 10.0% |
| Professional Degree | 3.0% | 3.0% | 2.0% |
| Doctorate Degree | 6.0% | 2.0% | 2.0% |
Household Income For Golden, Colorado
4.9% of households in Golden earn Less than $10,000.
2.0% of households in Golden earn $10,000 to $14,999.
4.4% of households in Golden earn $15,000 to $24,999.
4.7% of households in Golden earn $25,000 to $34,999.
8.3% of households in Golden earn $35,000 to $49,999.
12.7% of households in Golden earn $50,000 to $74,999.
15.1% of households in Golden earn $75,000 to $99,999.
14.9% of households in Golden earn $100,000 to $149,999.
10.3% of households in Golden earn $150,000 to $199,999.
22.6% of households in Golden earn $200,000 or more.
| Income | Golden | CO | USA |
|---|---|---|---|
| Less than $10,000 | 4.9% | 3.9% | 4.9% |
| $10,000 to $14,999 | 2.0% | 2.6% | 3.6% |
| $15,000 to $24,999 | 4.4% | 5.0% | 6.6% |
| $25,000 to $34,999 | 4.7% | 5.3% | 6.8% |
| $35,000 to $49,999 | 8.3% | 8.9% | 10.4% |
| $50,000 to $74,999 | 12.7% | 15.0% | 15.7% |
| $75,000 to $99,999 | 15.1% | 13.0% | 12.7% |
| $100,000 to $149,999 | 14.9% | 19.3% | 17.4% |
| $150,000 to $199,999 | 10.3% | 11.3% | 9.3% |
| $200,000 or more | 22.6% | 15.8% | 12.6% |


