Bridgeport SnackAbility
Overall SnackAbility
Crime in Bridgeport summary. We use data from the FBI to determine the crime rates in Bridgeport. Key points include:
There were 2,758 total crimes in Bridgeport in the last reporting year.
The overall crime rate per 100,000 people in Bridgeport is 1,861.9 / 100k people.
The violent crime rate per 100,000 people in Bridgeport is 392.9 / 100k people.
The property crime rate per 100,000 people in Bridgeport is 1,469.0 / 100k people.
Overall, crime in Bridgeport is -12.14% below the national average.
Total Crimes
Below National Average
Crime In Bridgeport Comparison Table
| Statistic | Count Raw |
Bridgeport / 100k People |
Connecticut / 100k People |
National / 100k People |
|---|---|---|---|---|
| Total Crimes Per 100K | 2,758 | 1,861.9 | 1,502.1 | 2,119.2 |
| Violent Crime | 582 | 392.9 | 136.0 | 359.0 |
| Murder | 12 | 8.1 | 2.4 | 5.0 |
| Robbery | 227 | 153.2 | 38.1 | 61.0 |
| Aggravated Assault | 281 | 189.7 | 77.5 | 256.0 |
| Property Crime | 2,176 | 1,469.0 | 1,366.1 | 1,760.0 |
| Burglary | 332 | 224.1 | 117.3 | 229.0 |
| Larceny | 1,143 | 771.6 | 1,013.7 | 1,272.0 |
| Car Theft | 701 | 473.2 | 235.0 | 259.0 |
Source: FBI Uniform Crime Reporting (2024)
Cost of living in Bridgeport summary. We use data on the cost of living to determine how expensive it is to live in Bridgeport. Real estate prices drive most of the variance in cost of living around Connecticut. Key points include:
The cost of living in Bridgeport is 111 with 100 being average.
The cost of living in Bridgeport is 1.1x higher than the national average.
The median home value in Bridgeport is $355,126.
The median income in Bridgeport is $58,685.
Bridgeport's Overall Cost Of Living
Higher Than The National Average
Cost Of Living In Bridgeport Comparison Table
| Living Expense | Bridgeport | Connecticut | National Average |
|---|---|---|---|
| Overall | 111 | 116 | 100 |
| Services | 102 | 107 | 100 |
| Groceries | 109 | 111 | 100 |
| Health | 110 | 137 | 100 |
| Housing | 107 | 108 | 100 |
| Transportation | 107 | 110 | 100 |
| Utilities | 115 | 111 | 100 |
Source: Cost of living index, normalized to US average = 100
Bridgeport, CT Weather
The average high in Bridgeport is 60.9° and the average low is 42.3°.
There are 79.7 days of precipitation each year.
Expect an average of 49.1 inches of precipitation each year with 34.7 inches of snow.
| Stat | Bridgeport |
|---|---|
| Average Annual High | 60.9 |
| Average Annual Low | 42.3 |
| Annual Precipitation Days | 79.7 |
| Average Annual Precipitation | 49.1 |
| Average Annual Snowfall | 34.7 |
Average High
Days of Rain
Source: NOAA climate normals (30-year)
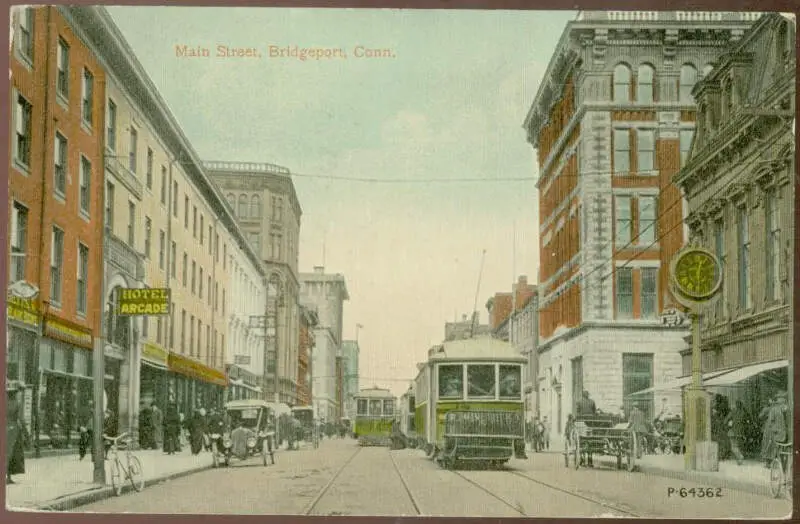
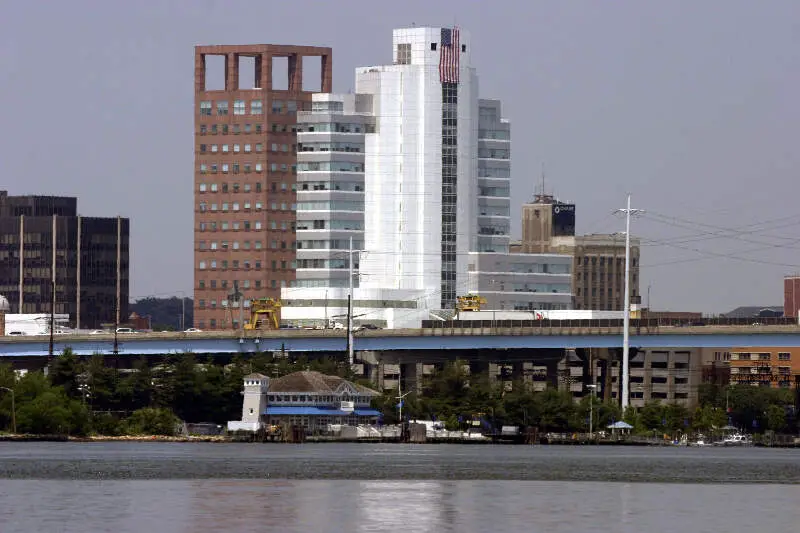
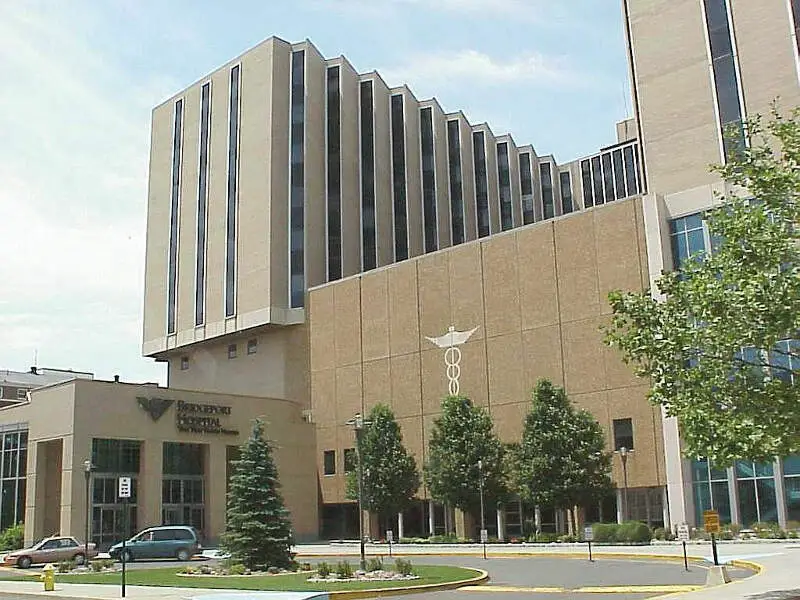
Bridgeport, CT Photos


6 Reviews & Comments About Bridgeport

I'm from Bridgeport and it's s**t city. Nothing but potholes and foreclosed f****d up ugly houses. That's if you're on the East side of the city. The west side is a lot better it's not that s****y, though it needs to be fixed up a bit. I hate Bridgeport and I don't understand why my family still lives there. However, Standford is nice and Fairfield - Blackrock area. Westport is great and Trumbull is okay too. If you know somebody and want to hang out expect house parties. Lot and lots of house parties.
Still doesn't explain why Bridgeport has the highest property taxes in the state. I have a love/hate relationship with my state. I live in a nice area that's filled with crappy, plastic people.
I lived in Bridgeport for so many years and both my parents had good jobs and we lived in a good a*s house and we had the biggest front and backyard on the whole block
High crime, high taxes. Full of a*****le dems and crackheads.
Don't walk the streets after dark.
Bridgeport is a country club compared to New York city! I was afforded the opportunity to buy a home in Lake Forest Bridgeport CT. My children won a lottery and went to Westport Schools because I lived in Bridgeport. Both of my children and I went to Housatonic Community college in But and went to University of Bridgeport. I have many friends who are police officers, teacher, public works employees in Bridgeport.
Lake Forest is a hidden Gem in this City. North end is a very nice area in Bridgeport, all areas of Bridgeport are being revitalized. Bridgeport Hospital, St Vncents Hospital ae wonderful and they are in my City. Seaside a beautiful beach and Park!
This is a city full of culture and arts!We have areas in need of more work than others this is true but we are a far cry from being one the 10 worst places to live in. Where do you live- must be heaven!
I'm from Bridgeport and yes our taxes are high but I wouldn't want to live anywhere else. Bridgeport is improving for the better no matter what you think.
Where else in Connecticut can you enjoy the zoo, the beach, multiple parks, free outdoor music every week in the summer,out door movie nights, arts festivals, vibes, the theater, catch the ferry and so much more!!!! I am tired of everyone talking about Bridgeport, there are worst places to live.
Rankings & Articles For Bridgeport


Locations Around Bridgeport
Map Of Bridgeport, CT
Best Places Around Bridgeport
Stony Brook, NY
Population 12,868
Mount Sinai, NY
Population 11,093
Sound Beach, NY
Population 7,210
Stony Brook University, NY
Population 9,530
Port Jefferson, NY
Population 8,091
Orange, CT
Population 14,315
Port Jefferson Station, NY
Population 7,676
Bethel, CT
Population 11,404
Bridgeport Demographics And Statistics
Population over time in Bridgeport
The current population in Bridgeport is 149,153. The population has increased 4.6% from 2010.
| Year | Population | % Change |
|---|---|---|
| 2024 | 149,153 | 0.8% |
| 2023 | 148,012 | -0.3% |
| 2022 | 148,470 | -0.0% |
| 2021 | 148,529 | 2.4% |
| 2020 | 145,014 | -0.4% |
| 2019 | 145,639 | -0.5% |
| 2018 | 146,417 | -0.8% |
| 2017 | 147,586 | 0.4% |
| 2016 | 147,022 | -0.2% |
| 2015 | 147,340 | 0.4% |
| 2014 | 146,680 | 0.8% |
| 2013 | 145,587 | 0.8% |
| 2012 | 144,446 | 0.7% |
| 2011 | 143,412 | 0.6% |
| 2010 | 142,576 | - |
Race / Ethnicity in Bridgeport
See the full breakdown
Bridgeport is:
24.5% White with 36,604 White residents.
19.7% African American with 29,330 African American residents.
0.1% American Indian with 156 American Indian residents.
4.7% Asian with 7,006 Asian residents.
0.0% Hawaiian with 0 Hawaiian residents.
2.0% Other with 2,995 Other residents.
4.2% Two Or More with 6,259 Two Or More residents.
44.8% Hispanic with 66,803 Hispanic residents.
| Race | Bridgeport | CT | USA |
|---|---|---|---|
| White | 24.5% | 61.9% | 57.4% |
| African American | 19.7% | 9.8% | 11.9% |
| American Indian | 0.1% | 0.1% | 0.5% |
| Asian | 4.7% | 4.7% | 5.9% |
| Hawaiian | 0.0% | 0.0% | 0.2% |
| Other | 2.0% | 0.9% | 0.6% |
| Two Or More | 4.2% | 4.3% | 4.3% |
| Hispanic | 44.8% | 18.3% | 19.3% |
Gender in Bridgeport
See the full breakdown
Bridgeport is 51.2% female with 76,362 female residents.
Bridgeport is 48.8% male with 72,791 male residents.
| Gender | Bridgeport | CT | USA |
|---|---|---|---|
| Female | 51.2% | 50.9% | 50.5% |
| Male | 48.8% | 49.1% | 49.5% |
Highest level of educational attainment in Bridgeport for adults over 25
See the full breakdown
12.0% of adults in Bridgeport completed < 9th grade.
10.0% of adults in Bridgeport completed 9-12th grade.
31.0% of adults in Bridgeport completed high school / ged.
17.0% of adults in Bridgeport completed some college.
6.0% of adults in Bridgeport completed associate's degree.
15.0% of adults in Bridgeport completed bachelor's degree.
7.0% of adults in Bridgeport completed master's degree.
1.0% of adults in Bridgeport completed professional degree.
1.0% of adults in Bridgeport completed doctorate degree.
| Education | Bridgeport | CT | USA |
|---|---|---|---|
| < 9th Grade | 12.0% | 5.0% | 4.0% |
| 9-12th Grade | 10.0% | 4.0% | 6.0% |
| High School / GED | 31.0% | 25.0% | 26.0% |
| Some College | 17.0% | 16.0% | 19.0% |
| Associate's Degree | 6.0% | 8.0% | 9.0% |
| Bachelor's Degree | 15.0% | 23.0% | 22.0% |
| Master's Degree | 7.0% | 14.0% | 10.0% |
| Professional Degree | 1.0% | 3.0% | 2.0% |
| Doctorate Degree | 1.0% | 2.0% | 2.0% |
Household Income For Bridgeport, Connecticut
See the full breakdown
6.8% of households in Bridgeport earn Less than $10,000.
7.5% of households in Bridgeport earn $10,000 to $14,999.
8.8% of households in Bridgeport earn $15,000 to $24,999.
8.1% of households in Bridgeport earn $25,000 to $34,999.
13.0% of households in Bridgeport earn $35,000 to $49,999.
16.5% of households in Bridgeport earn $50,000 to $74,999.
13.4% of households in Bridgeport earn $75,000 to $99,999.
13.8% of households in Bridgeport earn $100,000 to $149,999.
5.8% of households in Bridgeport earn $150,000 to $199,999.
6.3% of households in Bridgeport earn $200,000 or more.
| Income | Bridgeport | CT | USA |
|---|---|---|---|
| Less than $10,000 | 6.8% | 4.5% | 5.0% |
| $10,000 to $14,999 | 7.5% | 3.1% | 3.4% |
| $15,000 to $24,999 | 8.8% | 5.3% | 6.3% |
| $25,000 to $34,999 | 8.1% | 5.3% | 6.6% |
| $35,000 to $49,999 | 13.0% | 8.4% | 10.1% |
| $50,000 to $74,999 | 16.5% | 13.3% | 15.5% |
| $75,000 to $99,999 | 13.4% | 11.9% | 12.6% |
| $100,000 to $149,999 | 13.8% | 17.7% | 17.5% |
| $150,000 to $199,999 | 5.8% | 11.3% | 9.6% |
| $200,000 or more | 6.3% | 19.2% | 13.4% |
Source: U.S. Census ACS 5-year estimates (2024)


