Milford SnackAbility
Overall SnackAbility
Crime in Milford summary. We use data from the FBI to determine the crime rates in Milford. Key points include:
There were 1,174 total crimes in Milford in the last reporting year.
The overall crime rate per 100,000 people in Milford is 2,212.4 / 100k people.
The violent crime rate per 100,000 people in Milford is 116.8 / 100k people.
The property crime rate per 100,000 people in Milford is 2,095.5 / 100k people.
Overall, crime in Milford is 4.40% above the national average.
Total Crimes
Above National Average
Crime In Milford Comparison Table
| Statistic | Count Raw |
Milford / 100k People |
Connecticut / 100k People |
National / 100k People |
|---|---|---|---|---|
| Total Crimes Per 100K | 1,174 | 2,212.4 | 1,502.1 | 2,119.2 |
| Violent Crime | 62 | 116.8 | 136.0 | 359.0 |
| Murder | 1 | 1.9 | 2.4 | 5.0 |
| Robbery | 37 | 69.7 | 38.1 | 61.0 |
| Aggravated Assault | 11 | 20.7 | 77.5 | 256.0 |
| Property Crime | 1,112 | 2,095.5 | 1,366.1 | 1,760.0 |
| Burglary | 46 | 86.7 | 117.3 | 229.0 |
| Larceny | 964 | 1,816.6 | 1,013.7 | 1,272.0 |
| Car Theft | 102 | 192.2 | 235.0 | 259.0 |
Source: FBI Uniform Crime Reporting (2024)
Milford, CT Weather
The average high in Milford is None° and the average low is None°.
There are None days of precipitation each year.
Expect an average of None inches of precipitation each year with None inches of snow.
| Stat | Milford |
|---|---|
| Average Annual High | None |
| Average Annual Low | None |
| Annual Precipitation Days | None |
| Average Annual Precipitation | None |
| Average Annual Snowfall | None |
Average High
Days of Rain
Source: NOAA climate normals (30-year)
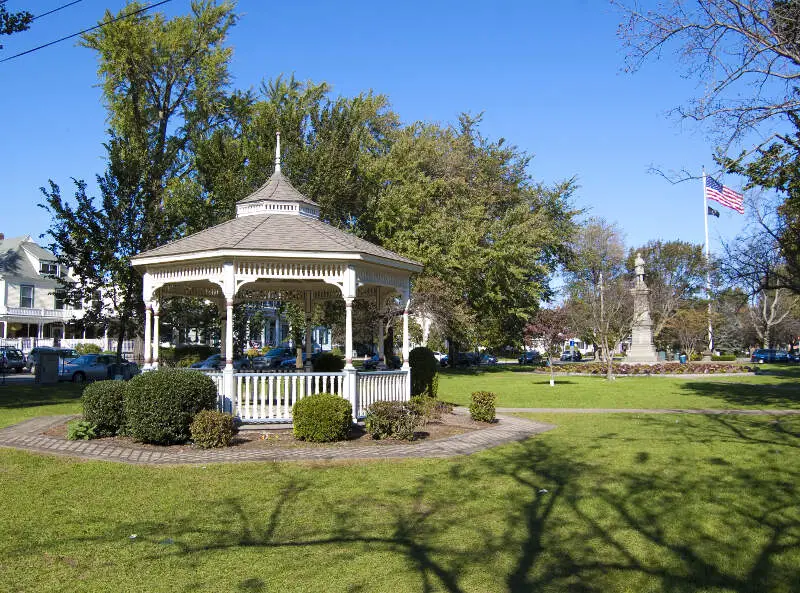
Milford, CT Photos


Rankings & Articles For Milford


Locations Around Milford
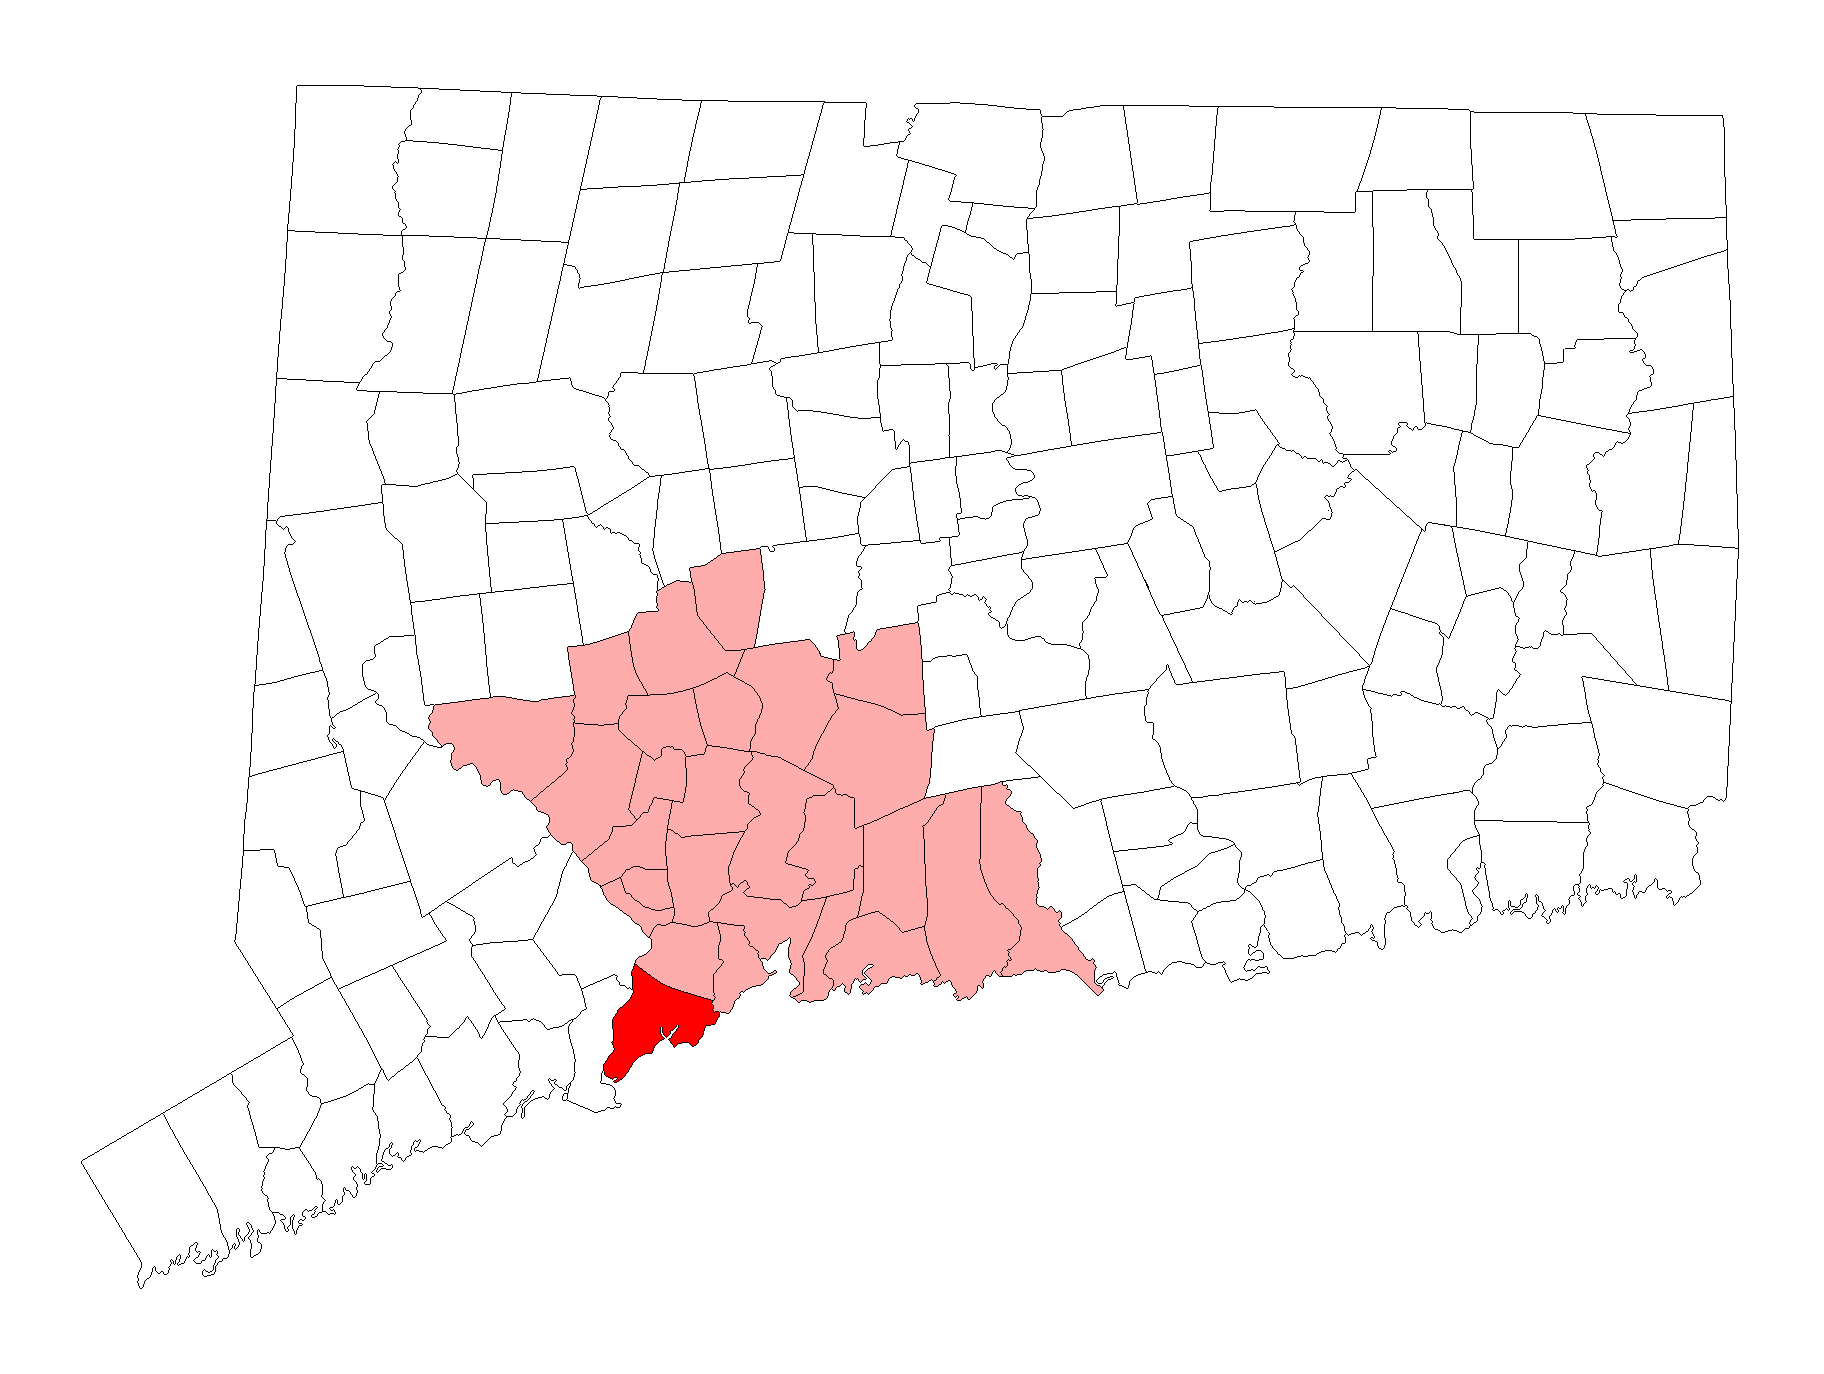
Map Of Milford, CT
Best Places Around Milford
Mount Sinai, NY
Population 11,093
Sound Beach, NY
Population 7,210
Port Jefferson, NY
Population 8,091
Orange, CT
Population 14,315
North Haven, CT
Population 24,336
Shelton, CT
Population 41,889
East Haven, CT
Population 27,806
Ansonia, CT
Population 19,033
Milford Demographics And Statistics
Population over time in Milford
The current population in Milford is 51,023. The population has increased 0.0% from 2010.
| Year | Population | % Change |
|---|---|---|
| 2024 | 51,023 | 0.5% |
| 2023 | 50,749 | 0.2% |
| 2022 | 50,664 | -0.1% |
| 2021 | 50,694 | -4.2% |
| 2020 | 52,902 | 0.3% |
| 2019 | 52,732 | 0.7% |
| 2018 | 52,349 | 0.0% |
| 2017 | 52,331 | 0.6% |
| 2016 | 52,005 | 0.7% |
| 2015 | 51,643 | 0.3% |
| 2014 | 51,509 | 0.1% |
| 2013 | 51,437 | 0.6% |
| 2012 | 51,115 | 0.2% |
| 2011 | 50,992 | -0.1% |
| 2010 | 51,019 | - |
Race / Ethnicity in Milford
See the full breakdown
Milford is:
80.2% White with 40,898 White residents.
3.0% African American with 1,542 African American residents.
0.0% American Indian with 22 American Indian residents.
3.7% Asian with 1,863 Asian residents.
0.0% Hawaiian with 0 Hawaiian residents.
0.7% Other with 345 Other residents.
2.9% Two Or More with 1,499 Two Or More residents.
9.5% Hispanic with 4,854 Hispanic residents.
| Race | Milford | CT | USA |
|---|---|---|---|
| White | 80.2% | 61.9% | 57.4% |
| African American | 3.0% | 9.8% | 11.9% |
| American Indian | 0.0% | 0.1% | 0.5% |
| Asian | 3.7% | 4.7% | 5.9% |
| Hawaiian | 0.0% | 0.0% | 0.2% |
| Other | 0.7% | 0.9% | 0.6% |
| Two Or More | 2.9% | 4.3% | 4.3% |
| Hispanic | 9.5% | 18.3% | 19.3% |
Gender in Milford
See the full breakdown
Milford is 51.7% female with 26,359 female residents.
Milford is 48.3% male with 24,664 male residents.
| Gender | Milford | CT | USA |
|---|---|---|---|
| Female | 51.7% | 50.9% | 50.5% |
| Male | 48.3% | 49.1% | 49.5% |
Highest level of educational attainment in Milford for adults over 25
See the full breakdown
1.0% of adults in Milford completed < 9th grade.
2.0% of adults in Milford completed 9-12th grade.
25.0% of adults in Milford completed high school / ged.
14.0% of adults in Milford completed some college.
7.0% of adults in Milford completed associate's degree.
29.0% of adults in Milford completed bachelor's degree.
16.0% of adults in Milford completed master's degree.
4.0% of adults in Milford completed professional degree.
2.0% of adults in Milford completed doctorate degree.
| Education | Milford | CT | USA |
|---|---|---|---|
| < 9th Grade | 1.0% | 5.0% | 4.0% |
| 9-12th Grade | 2.0% | 4.0% | 6.0% |
| High School / GED | 25.0% | 25.0% | 26.0% |
| Some College | 14.0% | 16.0% | 19.0% |
| Associate's Degree | 7.0% | 8.0% | 9.0% |
| Bachelor's Degree | 29.0% | 23.0% | 22.0% |
| Master's Degree | 16.0% | 14.0% | 10.0% |
| Professional Degree | 4.0% | 3.0% | 2.0% |
| Doctorate Degree | 2.0% | 2.0% | 2.0% |
Household Income For Milford, Connecticut
See the full breakdown
2.8% of households in Milford earn Less than $10,000.
2.5% of households in Milford earn $10,000 to $14,999.
3.0% of households in Milford earn $15,000 to $24,999.
3.9% of households in Milford earn $25,000 to $34,999.
8.3% of households in Milford earn $35,000 to $49,999.
11.4% of households in Milford earn $50,000 to $74,999.
13.6% of households in Milford earn $75,000 to $99,999.
19.0% of households in Milford earn $100,000 to $149,999.
13.4% of households in Milford earn $150,000 to $199,999.
22.1% of households in Milford earn $200,000 or more.
| Income | Milford | CT | USA |
|---|---|---|---|
| Less than $10,000 | 2.8% | 4.5% | 5.0% |
| $10,000 to $14,999 | 2.5% | 3.1% | 3.4% |
| $15,000 to $24,999 | 3.0% | 5.3% | 6.3% |
| $25,000 to $34,999 | 3.9% | 5.3% | 6.6% |
| $35,000 to $49,999 | 8.3% | 8.4% | 10.1% |
| $50,000 to $74,999 | 11.4% | 13.3% | 15.5% |
| $75,000 to $99,999 | 13.6% | 11.9% | 12.6% |
| $100,000 to $149,999 | 19.0% | 17.7% | 17.5% |
| $150,000 to $199,999 | 13.4% | 11.3% | 9.6% |
| $200,000 or more | 22.1% | 19.2% | 13.4% |
Source: U.S. Census ACS 5-year estimates (2024)


