West Hartford SnackAbility
Overall SnackAbility
Crime in West Hartford summary. We use data from the FBI to determine the crime rates in West Hartford. Key points include:
There were 1,792 total crimes in West Hartford in the last reporting year.
The overall crime rate per 100,000 people in West Hartford is 2,795.9 / 100k people.
The violent crime rate per 100,000 people in West Hartford is 64.0 / 100k people.
The property crime rate per 100,000 people in West Hartford is 2,732.0 / 100k people.
Overall, crime in West Hartford is 31.93% above the national average.
Total Crimes
Above National Average
Crime In West Hartford Comparison Table
| Statistic | Count Raw |
West Hartford / 100k People |
Connecticut / 100k People |
National / 100k People |
|---|---|---|---|---|
| Total Crimes Per 100K | 1,792 | 2,795.9 | 1,502.1 | 2,119.2 |
| Violent Crime | 41 | 64.0 | 136.0 | 359.0 |
| Murder | 0 | 0.0 | 2.4 | 5.0 |
| Robbery | 28 | 43.7 | 38.1 | 61.0 |
| Aggravated Assault | 10 | 15.6 | 77.5 | 256.0 |
| Property Crime | 1,751 | 2,732.0 | 1,366.1 | 1,760.0 |
| Burglary | 156 | 243.4 | 117.3 | 229.0 |
| Larceny | 1,441 | 2,248.3 | 1,013.7 | 1,272.0 |
| Car Theft | 154 | 240.3 | 235.0 | 259.0 |
Source: FBI Uniform Crime Reporting (2024)
Cost of living in West Hartford summary. We use data on the cost of living to determine how expensive it is to live in West Hartford. Real estate prices drive most of the variance in cost of living around Connecticut. Key points include:
The cost of living in West Hartford is 127 with 100 being average.
The cost of living in West Hartford is 1.3x higher than the national average.
The median home value in West Hartford is $487,818.
The median income in West Hartford is $129,890.
West Hartford's Overall Cost Of Living
Higher Than The National Average
Cost Of Living In West Hartford Comparison Table
| Living Expense | West Hartford | Connecticut | National Average |
|---|---|---|---|
| Overall | 127 | 116 | 100 |
| Services | 106 | 107 | 100 |
| Groceries | 113 | 111 | 100 |
| Health | 170 | 137 | 100 |
| Housing | 104 | 108 | 100 |
| Transportation | 107 | 110 | 100 |
| Utilities | 111 | 111 | 100 |
Source: Cost of living index, normalized to US average = 100
West Hartford, CT Weather
The average high in West Hartford is 60.1° and the average low is 39.7°.
There are 76.8 days of precipitation each year.
Expect an average of 47.8 inches of precipitation each year with 39.3 inches of snow.
| Stat | West Hartford |
|---|---|
| Average Annual High | 60.1 |
| Average Annual Low | 39.7 |
| Annual Precipitation Days | 76.8 |
| Average Annual Precipitation | 47.8 |
| Average Annual Snowfall | 39.3 |
Average High
Days of Rain
Source: NOAA climate normals (30-year)
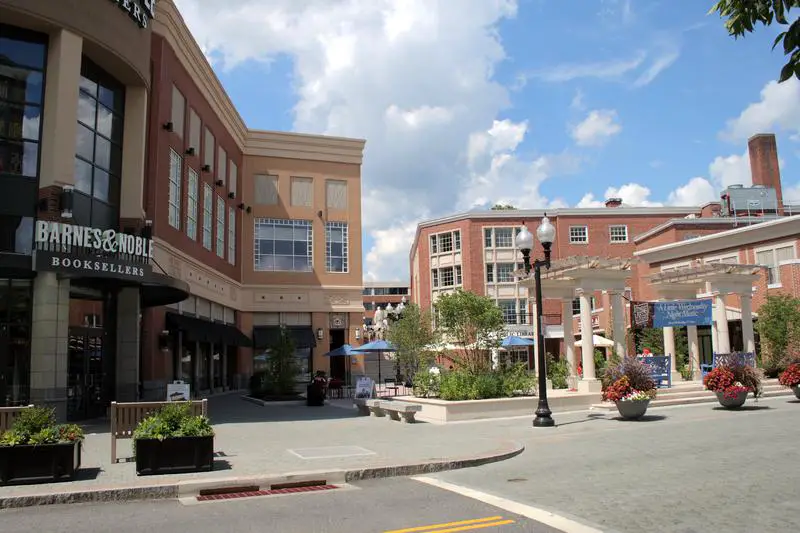
West Hartford, CT Photos
Rankings & Articles For West Hartford


Locations Around West Hartford
Map Of West Hartford, CT
Best Places Around West Hartford
Kensington, CT
Population 9,962
Sherwood Manor, CT
Population 5,706
Wethersfield, CT
Population 27,250
Southwood Acres, CT
Population 8,115
Newington, CT
Population 30,896
Windsor Locks, CT
Population 12,579
Hazardville, CT
Population 6,022
West Hartford Demographics And Statistics
Population over time in West Hartford
The current population in West Hartford is 63,620. The population has increased 1.1% from 2010.
| Year | Population | % Change |
|---|---|---|
| 2024 | 63,620 | -0.3% |
| 2023 | 63,809 | -0.4% |
| 2022 | 64,088 | 0.1% |
| 2021 | 64,034 | 1.6% |
| 2020 | 63,023 | -0.1% |
| 2019 | 63,063 | -0.1% |
| 2018 | 63,127 | -0.4% |
| 2017 | 63,360 | 0.3% |
| 2016 | 63,187 | -0.2% |
| 2015 | 63,288 | -0.2% |
| 2014 | 63,396 | 0.1% |
| 2013 | 63,340 | 0.3% |
| 2012 | 63,157 | 0.1% |
| 2011 | 63,066 | 0.3% |
| 2010 | 62,898 | - |
Race / Ethnicity in West Hartford
See the full breakdown
West Hartford is:
67.0% White with 42,650 White residents.
7.9% African American with 5,057 African American residents.
0.0% American Indian with 14 American Indian residents.
7.7% Asian with 4,916 Asian residents.
0.0% Hawaiian with 0 Hawaiian residents.
0.9% Other with 595 Other residents.
4.7% Two Or More with 2,962 Two Or More residents.
11.7% Hispanic with 7,426 Hispanic residents.
| Race | West Hartford | CT | USA |
|---|---|---|---|
| White | 67.0% | 61.9% | 57.4% |
| African American | 7.9% | 9.8% | 11.9% |
| American Indian | 0.0% | 0.1% | 0.5% |
| Asian | 7.7% | 4.7% | 5.9% |
| Hawaiian | 0.0% | 0.0% | 0.2% |
| Other | 0.9% | 0.9% | 0.6% |
| Two Or More | 4.7% | 4.3% | 4.3% |
| Hispanic | 11.7% | 18.3% | 19.3% |
Gender in West Hartford
See the full breakdown
West Hartford is 52.3% female with 33,293 female residents.
West Hartford is 47.7% male with 30,326 male residents.
| Gender | West Hartford | CT | USA |
|---|---|---|---|
| Female | 52.3% | 50.9% | 50.5% |
| Male | 47.7% | 49.1% | 49.5% |
Highest level of educational attainment in West Hartford for adults over 25
See the full breakdown
2.0% of adults in West Hartford completed < 9th grade.
2.0% of adults in West Hartford completed 9-12th grade.
13.0% of adults in West Hartford completed high school / ged.
10.0% of adults in West Hartford completed some college.
6.0% of adults in West Hartford completed associate's degree.
33.0% of adults in West Hartford completed bachelor's degree.
22.0% of adults in West Hartford completed master's degree.
8.0% of adults in West Hartford completed professional degree.
4.0% of adults in West Hartford completed doctorate degree.
| Education | West Hartford | CT | USA |
|---|---|---|---|
| < 9th Grade | 2.0% | 5.0% | 4.0% |
| 9-12th Grade | 2.0% | 4.0% | 6.0% |
| High School / GED | 13.0% | 25.0% | 26.0% |
| Some College | 10.0% | 16.0% | 19.0% |
| Associate's Degree | 6.0% | 8.0% | 9.0% |
| Bachelor's Degree | 33.0% | 23.0% | 22.0% |
| Master's Degree | 22.0% | 14.0% | 10.0% |
| Professional Degree | 8.0% | 3.0% | 2.0% |
| Doctorate Degree | 4.0% | 2.0% | 2.0% |
Household Income For West Hartford, Connecticut
See the full breakdown
3.6% of households in West Hartford earn Less than $10,000.
2.9% of households in West Hartford earn $10,000 to $14,999.
3.8% of households in West Hartford earn $15,000 to $24,999.
4.0% of households in West Hartford earn $25,000 to $34,999.
5.6% of households in West Hartford earn $35,000 to $49,999.
8.8% of households in West Hartford earn $50,000 to $74,999.
12.1% of households in West Hartford earn $75,000 to $99,999.
15.7% of households in West Hartford earn $100,000 to $149,999.
14.7% of households in West Hartford earn $150,000 to $199,999.
28.8% of households in West Hartford earn $200,000 or more.
| Income | West Hartford | CT | USA |
|---|---|---|---|
| Less than $10,000 | 3.6% | 4.5% | 5.0% |
| $10,000 to $14,999 | 2.9% | 3.1% | 3.4% |
| $15,000 to $24,999 | 3.8% | 5.3% | 6.3% |
| $25,000 to $34,999 | 4.0% | 5.3% | 6.6% |
| $35,000 to $49,999 | 5.6% | 8.4% | 10.1% |
| $50,000 to $74,999 | 8.8% | 13.3% | 15.5% |
| $75,000 to $99,999 | 12.1% | 11.9% | 12.6% |
| $100,000 to $149,999 | 15.7% | 17.7% | 17.5% |
| $150,000 to $199,999 | 14.7% | 11.3% | 9.6% |
| $200,000 or more | 28.8% | 19.2% | 13.4% |
Source: U.S. Census ACS 5-year estimates (2024)


