Willimantic SnackAbility
Overall SnackAbility
Crime in Willimantic summary. We use data from the FBI to determine the crime rates in Willimantic. Key points include:
There were 182 total crimes in Willimantic in the last reporting year.
The overall crime rate per 100,000 people in Willimantic is 989.5 / 100k people.
The violent crime rate per 100,000 people in Willimantic is 174.0 / 100k people.
The property crime rate per 100,000 people in Willimantic is 815.5 / 100k people.
Overall, crime in Willimantic is -53.31% below the national average.
Total Crimes
Below National Average
Crime In Willimantic Comparison Table
| Statistic | Count Raw |
Willimantic / 100k People |
Connecticut / 100k People |
National / 100k People |
|---|---|---|---|---|
| Total Crimes Per 100K | 182 | 989.5 | 1,502.1 | 2,119.2 |
| Violent Crime | 32 | 174.0 | 136.0 | 359.0 |
| Murder | 0 | 0.0 | 2.4 | 5.0 |
| Robbery | 7 | 38.1 | 38.1 | 61.0 |
| Aggravated Assault | 24 | 130.5 | 77.5 | 256.0 |
| Property Crime | 150 | 815.5 | 1,366.1 | 1,760.0 |
| Burglary | 8 | 43.5 | 117.3 | 229.0 |
| Larceny | 110 | 598.1 | 1,013.7 | 1,272.0 |
| Car Theft | 32 | 174.0 | 235.0 | 259.0 |
Source: FBI Uniform Crime Reporting (2024)
Cost of living in Willimantic summary. We use data on the cost of living to determine how expensive it is to live in Willimantic. Real estate prices drive most of the variance in cost of living around Connecticut. Key points include:
The cost of living in Willimantic is 101 with 100 being average.
The cost of living in Willimantic is 1.0x higher than the national average.
The median home value in Willimantic is $266,599.
The median income in Willimantic is $45,962.
Willimantic's Overall Cost Of Living
Higher Than The National Average
Cost Of Living In Willimantic Comparison Table
| Living Expense | Willimantic | Connecticut | National Average |
|---|---|---|---|
| Overall | 101 | 116 | 100 |
| Services | 109 | 107 | 100 |
| Groceries | 108 | 111 | 100 |
| Health | 87 | 137 | 100 |
| Housing | 106 | 108 | 100 |
| Transportation | 106 | 110 | 100 |
| Utilities | 108 | 111 | 100 |
Source: Cost of living index, normalized to US average = 100
Willimantic, CT Weather
The average high in Willimantic is 59.6° and the average low is 38.6°.
There are 82.4 days of precipitation each year.
Expect an average of 48.9 inches of precipitation each year with 38.8 inches of snow.
| Stat | Willimantic |
|---|---|
| Average Annual High | 59.6 |
| Average Annual Low | 38.6 |
| Annual Precipitation Days | 82.4 |
| Average Annual Precipitation | 48.9 |
| Average Annual Snowfall | 38.8 |
Average High
Days of Rain
Source: NOAA climate normals (30-year)
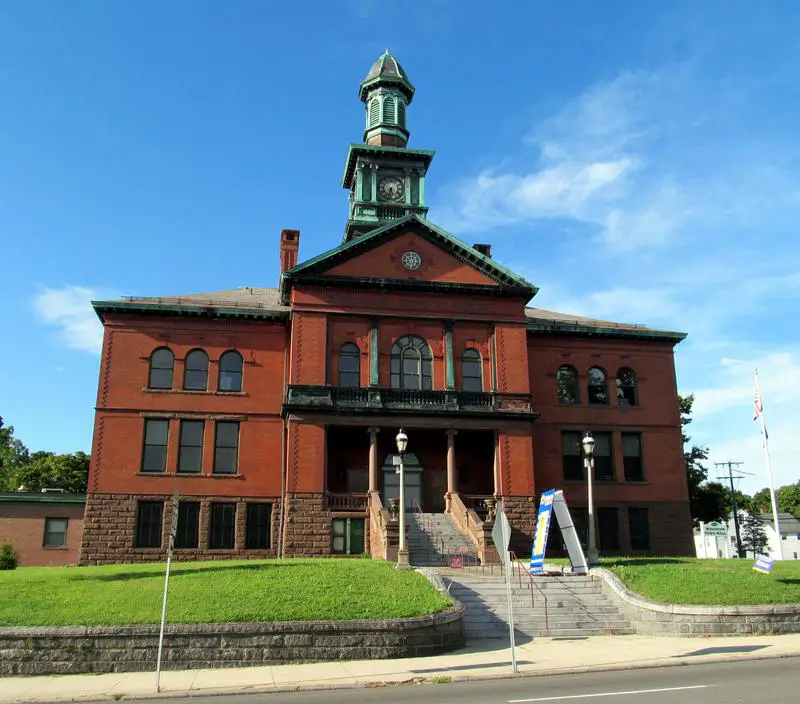
Willimantic, CT Photos
4 Reviews & Comments About Willimantic

Jeeze, Windham AND Willimantic on this list. I would think that the economics of Willimantic are what makes Windham overall come up as poor.
I live in what's considered a 'bad' part of Willimantic, off Milk Street. Most of the time, I am not scared to walk around at night. But I also am proud to know an incredible number of people who are involved in all sorts of great projects such as the Third Thursday street festivals, the farmers market, the Chocolate Festival, the Victorian Days house tours and events, Trick or Treat on Main, the CLiCK food service programs, Grow Windham gardening programs, a giant community garden overseen by Windham Area Interfaith Ministries - which also offers a 'store' full of free clothing, household goods, medical equipment, etc. as well as emergency funds.
And look at all the cool stuff on Main Street - the art galleries, the renovated Cafemantic coffee house, the imposing former post office that's now a top shelf restaurant and mini brewery, the theater, the magnet school for the arts.
And that's just a small sampling.
I am so sick of hearing about Willimantic being some kind of h****n capital. I'd like to see some hard numbers on that. H****n is all over Connecticut these days, sorry to say. And the opioid problem is nationwide.
You talk about willimantic like its a garbage dump. Yes, we have drugs here, yes we have violence, but what were not crazy. We dont just go around doing h****n and killing people. The education isn't bad either. I went to their private schools and currently have an iq of 156. Also can i just say that i love how u stereotype us like were all big scary people with pitbulls and beat up cars. THATS NOT TRUE. We come all different and you can definetly not tell the difference us and someone from another state. Thats because were all human beings. Just because were not SUPER rich or have fancy cars, doesnt mean were scary or less of a person. Also doesnt mean that were stupid, our education system is actually pretty good compared to most of the other towns in ct. I live in Willimantic, and im proud to be a Willirican.
I was born in Willimantic and went through middle school in New Haven. I gotta say I prefer Willitown to the Elm City any day. Sure, I found dirty needles outside the Dairy Queen and was terrified of the deinstitutionalized mental patients and syphilitic whores lurking around the aptly named H****r Hotel, but I never got any racist s**t in Wilimantic. When I was 13 I got punched in the face on no less than three separate occasions by middle aged black men simply for being white and waiting for the bus on Whalley ave. Unless you're some millionaire Yale student, the only good thing about New Haven is the pizza.
Hartford and Bridgeport are basically New Haven with worse Pizza so avoid at all costs.
I'm gonna be honest here... willimantic isn't as bad as it was like 20 years ago. I've lived in the heart of it my whole life and never seen anyone walking around with a gun. The alcohol and pitbulls were spot on tho. Also I'm surprised our really terrible school system wasn't brought up. Our education system is so bad now, they're gonna be closing our high schools. Back when I was i high school it was so bad teachers were quitting and they had students fill in. Most dropped out and got GEDs instead lol.
Rankings & Articles For Willimantic


Locations Around Willimantic
Map Of Willimantic, CT
Best Places Around Willimantic
Manchester, CT
Population 36,759
Manchester, CT
Population 36,759
Glastonbury Center, CT
Population 7,266
Willimantic Demographics And Statistics
Population over time in Willimantic
The current population in Willimantic is 18,096. The population has increased 3.5% from 2010.
| Year | Population | % Change |
|---|---|---|
| 2024 | 18,096 | 1.8% |
| 2023 | 17,774 | 0.1% |
| 2022 | 17,762 | -2.1% |
| 2021 | 18,150 | -2.8% |
| 2020 | 18,669 | 7.6% |
| 2019 | 17,358 | 1.0% |
| 2018 | 17,184 | -2.1% |
| 2017 | 17,550 | 1.2% |
| 2016 | 17,339 | -0.4% |
| 2015 | 17,411 | -2.4% |
| 2014 | 17,845 | 1.3% |
| 2013 | 17,623 | 2.0% |
| 2012 | 17,281 | -1.2% |
| 2011 | 17,495 | 0.1% |
| 2010 | 17,485 | - |
Race / Ethnicity in Willimantic
See the full breakdown
Willimantic is:
41.8% White with 7,566 White residents.
4.9% African American with 882 African American residents.
0.0% American Indian with 0 American Indian residents.
1.6% Asian with 289 Asian residents.
0.1% Hawaiian with 12 Hawaiian residents.
0.1% Other with 18 Other residents.
4.5% Two Or More with 822 Two Or More residents.
47.0% Hispanic with 8,507 Hispanic residents.
| Race | Willimantic | CT | USA |
|---|---|---|---|
| White | 41.8% | 61.9% | 57.4% |
| African American | 4.9% | 9.8% | 11.9% |
| American Indian | 0.0% | 0.1% | 0.5% |
| Asian | 1.6% | 4.7% | 5.9% |
| Hawaiian | 0.1% | 0.0% | 0.2% |
| Other | 0.1% | 0.9% | 0.6% |
| Two Or More | 4.5% | 4.3% | 4.3% |
| Hispanic | 47.0% | 18.3% | 19.3% |
Gender in Willimantic
See the full breakdown
Willimantic is 51.9% female with 9,399 female residents.
Willimantic is 48.1% male with 8,697 male residents.
| Gender | Willimantic | CT | USA |
|---|---|---|---|
| Female | 51.9% | 50.9% | 50.5% |
| Male | 48.1% | 49.1% | 49.5% |
Highest level of educational attainment in Willimantic for adults over 25
See the full breakdown
9.0% of adults in Willimantic completed < 9th grade.
10.0% of adults in Willimantic completed 9-12th grade.
34.0% of adults in Willimantic completed high school / ged.
16.0% of adults in Willimantic completed some college.
7.0% of adults in Willimantic completed associate's degree.
13.0% of adults in Willimantic completed bachelor's degree.
8.0% of adults in Willimantic completed master's degree.
1.0% of adults in Willimantic completed professional degree.
2.0% of adults in Willimantic completed doctorate degree.
| Education | Willimantic | CT | USA |
|---|---|---|---|
| < 9th Grade | 9.0% | 5.0% | 4.0% |
| 9-12th Grade | 10.0% | 4.0% | 6.0% |
| High School / GED | 34.0% | 25.0% | 26.0% |
| Some College | 16.0% | 16.0% | 19.0% |
| Associate's Degree | 7.0% | 8.0% | 9.0% |
| Bachelor's Degree | 13.0% | 23.0% | 22.0% |
| Master's Degree | 8.0% | 14.0% | 10.0% |
| Professional Degree | 1.0% | 3.0% | 2.0% |
| Doctorate Degree | 2.0% | 2.0% | 2.0% |
Household Income For Willimantic, Connecticut
See the full breakdown
7.7% of households in Willimantic earn Less than $10,000.
8.2% of households in Willimantic earn $10,000 to $14,999.
10.1% of households in Willimantic earn $15,000 to $24,999.
14.7% of households in Willimantic earn $25,000 to $34,999.
12.7% of households in Willimantic earn $35,000 to $49,999.
16.5% of households in Willimantic earn $50,000 to $74,999.
9.9% of households in Willimantic earn $75,000 to $99,999.
12.4% of households in Willimantic earn $100,000 to $149,999.
5.1% of households in Willimantic earn $150,000 to $199,999.
2.6% of households in Willimantic earn $200,000 or more.
| Income | Willimantic | CT | USA |
|---|---|---|---|
| Less than $10,000 | 7.7% | 4.5% | 5.0% |
| $10,000 to $14,999 | 8.2% | 3.1% | 3.4% |
| $15,000 to $24,999 | 10.1% | 5.3% | 6.3% |
| $25,000 to $34,999 | 14.7% | 5.3% | 6.6% |
| $35,000 to $49,999 | 12.7% | 8.4% | 10.1% |
| $50,000 to $74,999 | 16.5% | 13.3% | 15.5% |
| $75,000 to $99,999 | 9.9% | 11.9% | 12.6% |
| $100,000 to $149,999 | 12.4% | 17.7% | 17.5% |
| $150,000 to $199,999 | 5.1% | 11.3% | 9.6% |
| $200,000 or more | 2.6% | 19.2% | 13.4% |
Source: U.S. Census ACS 5-year estimates (2024)


