New Castle SnackAbility
Overall SnackAbility
Crime in New Castle summary. We use data from the FBI to determine the crime rates in New Castle. Key points include:
There were 217 total crimes in New Castle in the last reporting year.
The overall crime rate per 100,000 people in New Castle is 3,908.5 / 100k people.
The violent crime rate per 100,000 people in New Castle is 378.2 / 100k people.
The property crime rate per 100,000 people in New Castle is 3,530.3 / 100k people.
Overall, crime in New Castle is 84.43% above the national average.
Total Crimes
Above National Average
Crime In New Castle Comparison Table
| Statistic | Count Raw |
New Castle / 100k People |
Delaware / 100k People |
National / 100k People |
|---|---|---|---|---|
| Total Crimes Per 100K | 217 | 3,908.5 | 2,106.5 | 2,119.2 |
| Violent Crime | 21 | 378.2 | 360.8 | 359.0 |
| Murder | 0 | 0.0 | 5.7 | 5.0 |
| Robbery | 0 | 0.0 | 47.0 | 61.0 |
| Aggravated Assault | 21 | 378.2 | 292.4 | 256.0 |
| Property Crime | 196 | 3,530.3 | 1,745.8 | 1,760.0 |
| Burglary | 13 | 234.1 | 175.1 | 229.0 |
| Larceny | 169 | 3,043.9 | 1,361.9 | 1,272.0 |
| Car Theft | 14 | 252.2 | 208.8 | 259.0 |
Source: FBI Uniform Crime Reporting (2024)
Cost of living in New Castle summary. We use data on the cost of living to determine how expensive it is to live in New Castle. Real estate prices drive most of the variance in cost of living around Delaware. Key points include:
The cost of living in New Castle is 108 with 100 being average.
The cost of living in New Castle is 1.1x higher than the national average.
The median home value in New Castle is $280,916.
The median income in New Castle is $89,205.
New Castle's Overall Cost Of Living
Higher Than The National Average
Cost Of Living In New Castle Comparison Table
| Living Expense | New Castle | Delaware | National Average |
|---|---|---|---|
| Overall | 108 | 105 | 100 |
| Services | 98 | 99 | 100 |
| Groceries | 99 | 102 | 100 |
| Health | 126 | 121 | 100 |
| Housing | 100 | 99 | 100 |
| Transportation | 103 | 102 | 100 |
| Utilities | 105 | 103 | 100 |
Source: Cost of living index, normalized to US average = 100
New Castle, DE Weather
The average high in New Castle is 64.2° and the average low is 45.1°.
There are 75.5 days of precipitation each year.
Expect an average of 44.8 inches of precipitation each year with 12.8 inches of snow.
| Stat | New Castle |
|---|---|
| Average Annual High | 64.2 |
| Average Annual Low | 45.1 |
| Annual Precipitation Days | 75.5 |
| Average Annual Precipitation | 44.8 |
| Average Annual Snowfall | 12.8 |
Average High
Days of Rain
Source: NOAA climate normals (30-year)
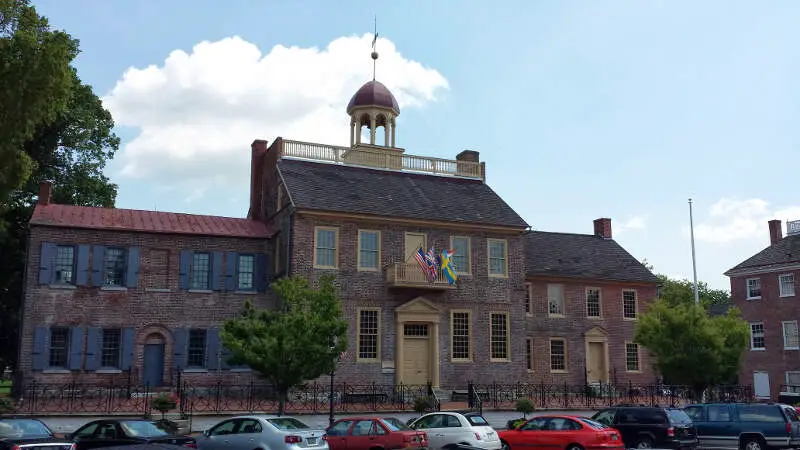
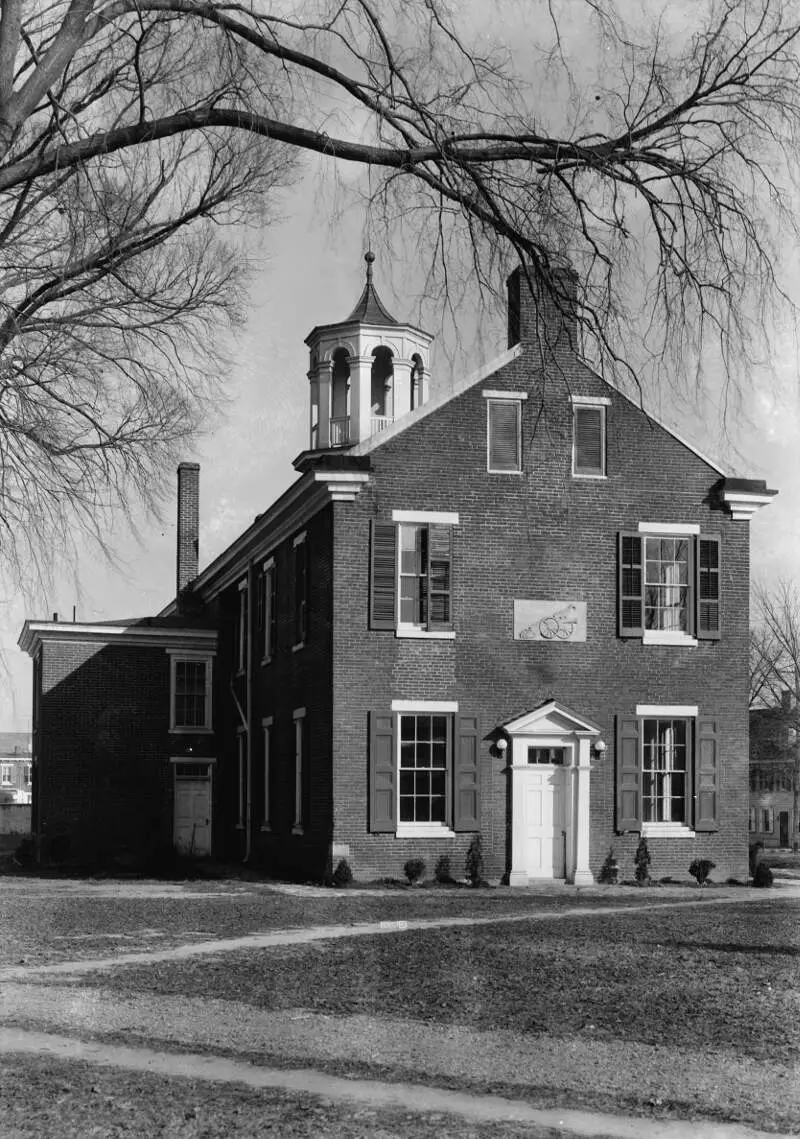
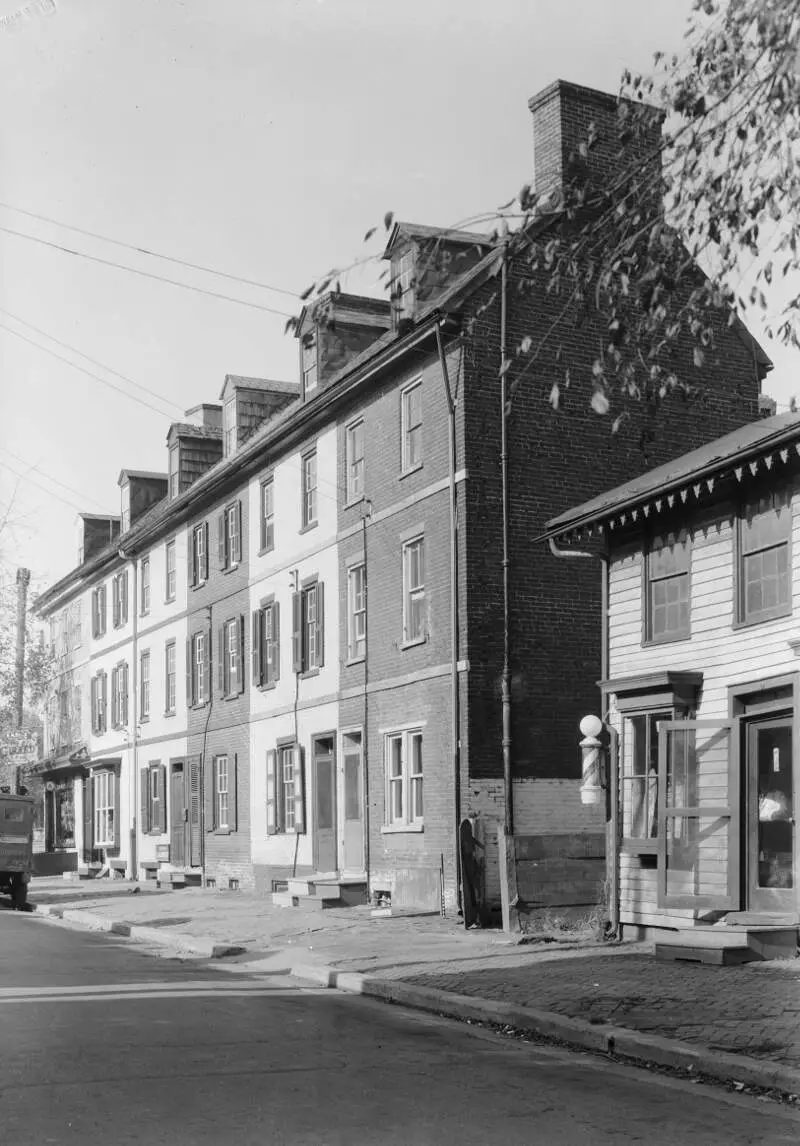
New Castle, DE Photos

Rankings & Articles For New Castle


Locations Around New Castle
Map Of New Castle, DE
Best Places Around New Castle
Swarthmore, PA
Population 6,550
Folsom, PA
Population 8,671
Kennett Square, PA
Population 6,243
Village Green-Green Ridge, PA
Population 9,073
Ridley Park, PA
Population 7,261
Media, PA
Population 5,870
Woodlyn, PA
Population 9,736
Brookhaven, PA
Population 8,331
Pennsville, NJ
Population 12,233
Carneys Point, NJ
Population 8,050
New Castle Demographics And Statistics
Population over time in New Castle
The current population in New Castle is 5,579. The population has increased 6.3% from 2010.
| Year | Population | % Change |
|---|---|---|
| 2024 | 5,579 | 1.1% |
| 2023 | 5,519 | -0.1% |
| 2022 | 5,523 | 0.7% |
| 2021 | 5,482 | 3.4% |
| 2020 | 5,302 | 1.1% |
| 2019 | 5,242 | -2.2% |
| 2018 | 5,359 | -0.1% |
| 2017 | 5,364 | -0.1% |
| 2016 | 5,372 | 0.0% |
| 2015 | 5,371 | 0.5% |
| 2014 | 5,346 | 0.1% |
| 2013 | 5,343 | 0.6% |
| 2012 | 5,309 | 0.7% |
| 2011 | 5,270 | 0.4% |
| 2010 | 5,250 | - |
Race / Ethnicity in New Castle
See the full breakdown
New Castle is:
60.4% White with 3,369 White residents.
28.4% African American with 1,587 African American residents.
0.1% American Indian with 4 American Indian residents.
0.9% Asian with 52 Asian residents.
0.0% Hawaiian with 0 Hawaiian residents.
0.6% Other with 33 Other residents.
1.4% Two Or More with 80 Two Or More residents.
8.1% Hispanic with 454 Hispanic residents.
| Race | New Castle | DE | USA |
|---|---|---|---|
| White | 60.4% | 58.1% | 57.4% |
| African American | 28.4% | 21.4% | 11.9% |
| American Indian | 0.1% | 0.1% | 0.5% |
| Asian | 0.9% | 4.3% | 5.9% |
| Hawaiian | 0.0% | 0.0% | 0.2% |
| Other | 0.6% | 0.5% | 0.6% |
| Two Or More | 1.4% | 4.5% | 4.3% |
| Hispanic | 8.1% | 11.0% | 19.3% |
Gender in New Castle
See the full breakdown
New Castle is 52.0% female with 2,902 female residents.
New Castle is 48.0% male with 2,676 male residents.
| Gender | New Castle | DE | USA |
|---|---|---|---|
| Female | 52.0% | 51.6% | 50.5% |
| Male | 48.0% | 48.4% | 49.5% |
Highest level of educational attainment in New Castle for adults over 25
See the full breakdown
1.0% of adults in New Castle completed < 9th grade.
5.0% of adults in New Castle completed 9-12th grade.
31.0% of adults in New Castle completed high school / ged.
19.0% of adults in New Castle completed some college.
10.0% of adults in New Castle completed associate's degree.
15.0% of adults in New Castle completed bachelor's degree.
14.0% of adults in New Castle completed master's degree.
4.0% of adults in New Castle completed professional degree.
1.0% of adults in New Castle completed doctorate degree.
| Education | New Castle | DE | USA |
|---|---|---|---|
| < 9th Grade | 1.0% | 4.0% | 4.0% |
| 9-12th Grade | 5.0% | 5.0% | 6.0% |
| High School / GED | 31.0% | 29.0% | 26.0% |
| Some College | 19.0% | 19.0% | 19.0% |
| Associate's Degree | 10.0% | 8.0% | 9.0% |
| Bachelor's Degree | 15.0% | 20.0% | 22.0% |
| Master's Degree | 14.0% | 11.0% | 10.0% |
| Professional Degree | 4.0% | 2.0% | 2.0% |
| Doctorate Degree | 1.0% | 2.0% | 2.0% |
Household Income For New Castle, Delaware
See the full breakdown
2.8% of households in New Castle earn Less than $10,000.
0.5% of households in New Castle earn $10,000 to $14,999.
3.9% of households in New Castle earn $15,000 to $24,999.
7.2% of households in New Castle earn $25,000 to $34,999.
8.0% of households in New Castle earn $35,000 to $49,999.
17.6% of households in New Castle earn $50,000 to $74,999.
16.7% of households in New Castle earn $75,000 to $99,999.
28.4% of households in New Castle earn $100,000 to $149,999.
6.7% of households in New Castle earn $150,000 to $199,999.
8.1% of households in New Castle earn $200,000 or more.
| Income | New Castle | DE | USA |
|---|---|---|---|
| Less than $10,000 | 2.8% | 4.2% | 5.0% |
| $10,000 to $14,999 | 0.5% | 2.6% | 3.4% |
| $15,000 to $24,999 | 3.9% | 5.1% | 6.3% |
| $25,000 to $34,999 | 7.2% | 5.9% | 6.6% |
| $35,000 to $49,999 | 8.0% | 10.5% | 10.1% |
| $50,000 to $74,999 | 17.6% | 15.9% | 15.5% |
| $75,000 to $99,999 | 16.7% | 13.5% | 12.6% |
| $100,000 to $149,999 | 28.4% | 19.0% | 17.5% |
| $150,000 to $199,999 | 6.7% | 10.9% | 9.6% |
| $200,000 or more | 8.1% | 12.4% | 13.4% |
Source: U.S. Census ACS 5-year estimates (2024)


