Kennett Square SnackAbility
Overall SnackAbility
Cost of living in Kennett Square summary. We use data on the cost of living to determine how expensive it is to live in Kennett Square. Real estate prices drive most of the variance in cost of living around Pennsylvania. Key points include:
The cost of living in Kennett Square is 110 with 100 being average.
The cost of living in Kennett Square is 1.1x higher than the national average.
The median home value in Kennett Square is $620,982.
The median income in Kennett Square is $80,505.
Kennett Square's Overall Cost Of Living
Higher Than The National Average
Cost Of Living In Kennett Square Comparison Table
| Living Expense | Kennett Square | Pennsylvania | National Average |
|---|---|---|---|
| Overall | 110 | 97 | 100 |
| Services | 101 | 99 | 100 |
| Groceries | 101 | 100 | 100 |
| Health | 135 | 88 | 100 |
| Housing | 100 | 102 | 100 |
| Transportation | 101 | 100 | 100 |
| Utilities | 103 | 101 | 100 |
Source: Cost of living index, normalized to US average = 100
Kennett Square, PA Weather
The average high in Kennett Square is 62.7° and the average low is 42.6°.
There are 77.0 days of precipitation each year.
Expect an average of 47.0 inches of precipitation each year with 23.2 inches of snow.
| Stat | Kennett Square |
|---|---|
| Average Annual High | 62.7 |
| Average Annual Low | 42.6 |
| Annual Precipitation Days | 77.0 |
| Average Annual Precipitation | 47.0 |
| Average Annual Snowfall | 23.2 |
Average High
Days of Rain
Source: NOAA climate normals (30-year)
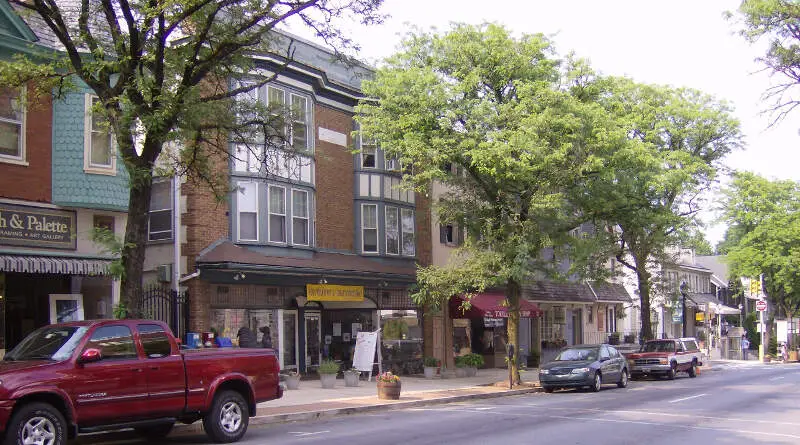
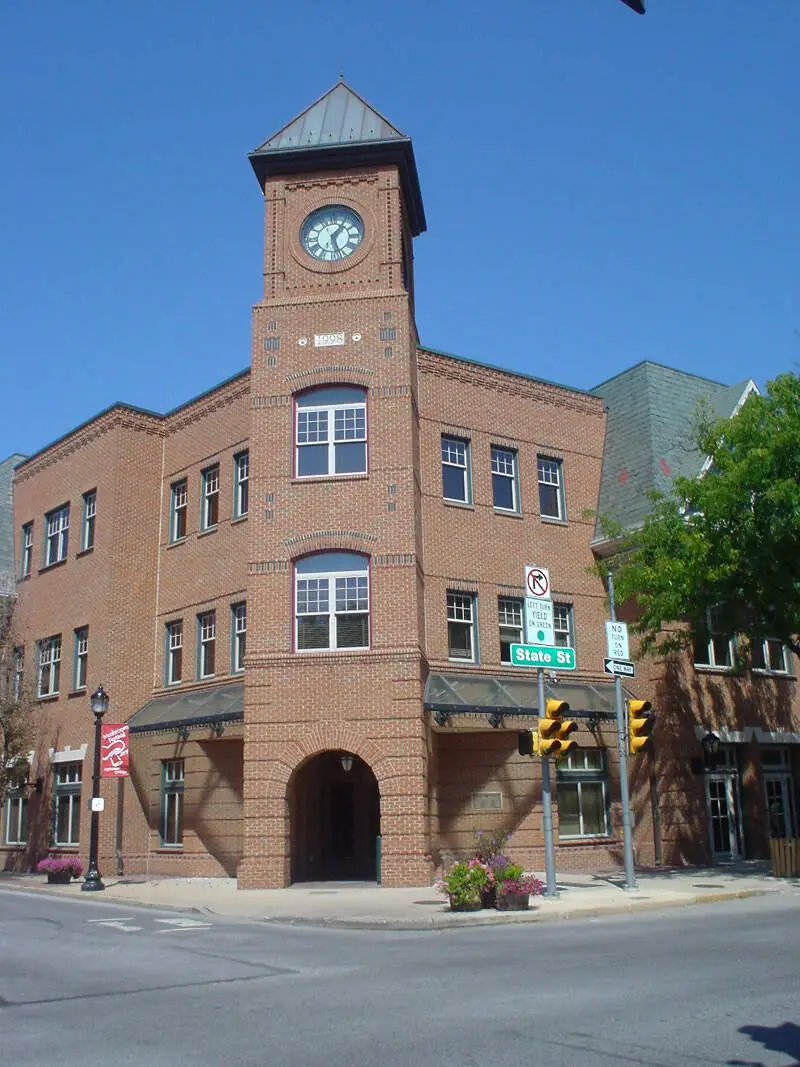
Kennett Square, PA Photos
Rankings & Articles For Kennett Square


Locations Around Kennett Square
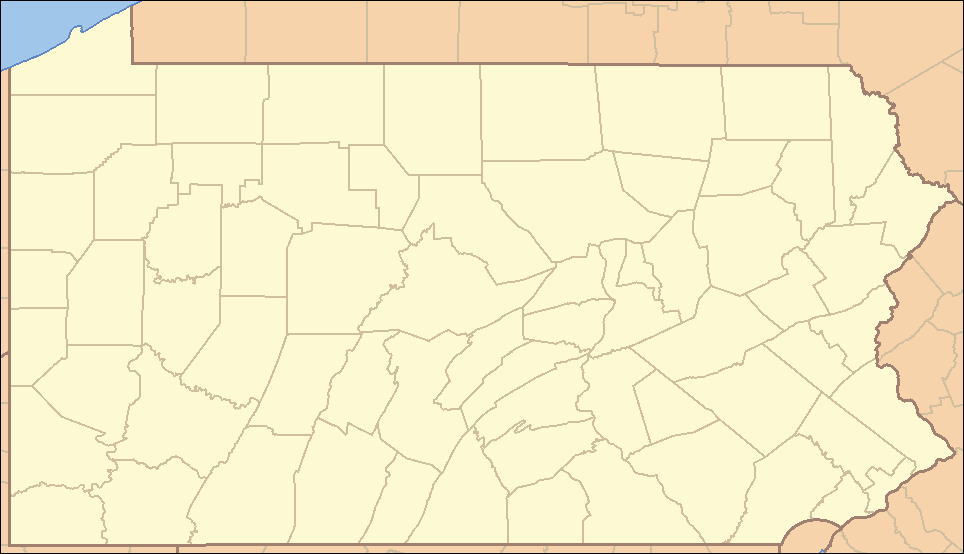
Map Of Kennett Square, PA
Best Places Around Kennett Square
Paoli, PA
Population 6,362
Swarthmore, PA
Population 6,550
Lionville, PA
Population 7,683
Village Green-Green Ridge, PA
Population 9,073
West Chester, PA
Population 20,666
Media, PA
Population 5,870
Woodlyn, PA
Population 9,736
Brookhaven, PA
Population 8,331
Coatesville, PA
Population 13,353
Pennsville, NJ
Population 12,233
Kennett Square Demographics And Statistics
Population over time in Kennett Square
The current population in Kennett Square is 6,243. The population has increased 4.8% from 2010.
| Year | Population | % Change |
|---|---|---|
| 2024 | 6,243 | 2.4% |
| 2023 | 6,096 | 1.9% |
| 2022 | 5,982 | 0.4% |
| 2021 | 5,959 | -3.6% |
| 2020 | 6,182 | -0.1% |
| 2019 | 6,190 | 0.5% |
| 2018 | 6,159 | 0.3% |
| 2017 | 6,138 | -0.0% |
| 2016 | 6,139 | 0.4% |
| 2015 | 6,117 | -0.1% |
| 2014 | 6,123 | 0.7% |
| 2013 | 6,078 | 0.4% |
| 2012 | 6,054 | 0.5% |
| 2011 | 6,024 | 1.1% |
| 2010 | 5,959 | - |
Race / Ethnicity in Kennett Square
See the full breakdown
Kennett Square is:
46.5% White with 2,902 White residents.
3.1% African American with 193 African American residents.
0.1% American Indian with 6 American Indian residents.
0.2% Asian with 13 Asian residents.
0.0% Hawaiian with 0 Hawaiian residents.
0.0% Other with 0 Other residents.
4.0% Two Or More with 248 Two Or More residents.
46.1% Hispanic with 2,881 Hispanic residents.
| Race | Kennett Square | PA | USA |
|---|---|---|---|
| White | 46.5% | 73.0% | 57.4% |
| African American | 3.1% | 10.3% | 11.9% |
| American Indian | 0.1% | 0.1% | 0.5% |
| Asian | 0.2% | 3.8% | 5.9% |
| Hawaiian | 0.0% | 0.0% | 0.2% |
| Other | 0.0% | 0.5% | 0.6% |
| Two Or More | 4.0% | 3.6% | 4.3% |
| Hispanic | 46.1% | 8.7% | 19.3% |
Gender in Kennett Square
See the full breakdown
Kennett Square is 48.6% female with 3,035 female residents.
Kennett Square is 51.4% male with 3,207 male residents.
| Gender | Kennett Square | PA | USA |
|---|---|---|---|
| Female | 48.6% | 50.7% | 50.5% |
| Male | 51.4% | 49.3% | 49.5% |
Highest level of educational attainment in Kennett Square for adults over 25
See the full breakdown
16.0% of adults in Kennett Square completed < 9th grade.
5.0% of adults in Kennett Square completed 9-12th grade.
27.0% of adults in Kennett Square completed high school / ged.
12.0% of adults in Kennett Square completed some college.
4.0% of adults in Kennett Square completed associate's degree.
19.0% of adults in Kennett Square completed bachelor's degree.
12.0% of adults in Kennett Square completed master's degree.
3.0% of adults in Kennett Square completed professional degree.
2.0% of adults in Kennett Square completed doctorate degree.
| Education | Kennett Square | PA | USA |
|---|---|---|---|
| < 9th Grade | 16.0% | 3.0% | 4.0% |
| 9-12th Grade | 5.0% | 5.0% | 6.0% |
| High School / GED | 27.0% | 33.0% | 26.0% |
| Some College | 12.0% | 15.0% | 19.0% |
| Associate's Degree | 4.0% | 9.0% | 9.0% |
| Bachelor's Degree | 19.0% | 21.0% | 22.0% |
| Master's Degree | 12.0% | 10.0% | 10.0% |
| Professional Degree | 3.0% | 2.0% | 2.0% |
| Doctorate Degree | 2.0% | 2.0% | 2.0% |
Household Income For Kennett Square, Pennsylvania
See the full breakdown
3.5% of households in Kennett Square earn Less than $10,000.
1.6% of households in Kennett Square earn $10,000 to $14,999.
2.4% of households in Kennett Square earn $15,000 to $24,999.
4.6% of households in Kennett Square earn $25,000 to $34,999.
23.1% of households in Kennett Square earn $35,000 to $49,999.
9.5% of households in Kennett Square earn $50,000 to $74,999.
11.2% of households in Kennett Square earn $75,000 to $99,999.
20.8% of households in Kennett Square earn $100,000 to $149,999.
6.1% of households in Kennett Square earn $150,000 to $199,999.
17.2% of households in Kennett Square earn $200,000 or more.
| Income | Kennett Square | PA | USA |
|---|---|---|---|
| Less than $10,000 | 3.5% | 4.9% | 5.0% |
| $10,000 to $14,999 | 1.6% | 3.5% | 3.4% |
| $15,000 to $24,999 | 2.4% | 6.7% | 6.3% |
| $25,000 to $34,999 | 4.6% | 6.9% | 6.6% |
| $35,000 to $49,999 | 23.1% | 10.5% | 10.1% |
| $50,000 to $74,999 | 9.5% | 15.9% | 15.5% |
| $75,000 to $99,999 | 11.2% | 12.8% | 12.6% |
| $100,000 to $149,999 | 20.8% | 17.7% | 17.5% |
| $150,000 to $199,999 | 6.1% | 9.3% | 9.6% |
| $200,000 or more | 17.2% | 11.8% | 13.4% |
Source: U.S. Census ACS 5-year estimates (2024)


