Boca Raton SnackAbility
Overall SnackAbility
Crime in Boca Raton summary. We use data from the FBI to determine the crime rates in Boca Raton. Key points include:
There were 1,858 total crimes in Boca Raton in the last reporting year.
The overall crime rate per 100,000 people in Boca Raton is 1,847.7 / 100k people.
The violent crime rate per 100,000 people in Boca Raton is 171.0 / 100k people.
The property crime rate per 100,000 people in Boca Raton is 1,676.7 / 100k people.
Overall, crime in Boca Raton is -12.81% below the national average.
Total Crimes
Below National Average
Crime In Boca Raton Comparison Table
| Statistic | Count Raw |
Boca Raton / 100k People |
Florida / 100k People |
National / 100k People |
|---|---|---|---|---|
| Total Crimes Per 100K | 1,858 | 1,847.7 | 1,687.5 | 2,119.2 |
| Violent Crime | 172 | 171.0 | 267.1 | 359.0 |
| Murder | 2 | 2.0 | 3.9 | 5.0 |
| Robbery | 34 | 33.8 | 38.2 | 61.0 |
| Aggravated Assault | 100 | 99.4 | 197.1 | 256.0 |
| Property Crime | 1,686 | 1,676.7 | 1,420.4 | 1,760.0 |
| Burglary | 156 | 155.1 | 152.5 | 229.0 |
| Larceny | 1,429 | 1,421.1 | 1,144.9 | 1,272.0 |
| Car Theft | 101 | 100.4 | 123.0 | 259.0 |
Source: FBI Uniform Crime Reporting (2024)
Cost of living in Boca Raton summary. We use data on the cost of living to determine how expensive it is to live in Boca Raton. Real estate prices drive most of the variance in cost of living around Florida. Key points include:
The cost of living in Boca Raton is 148 with 100 being average.
The cost of living in Boca Raton is 1.5x higher than the national average.
The median home value in Boca Raton is $562,565.
The median income in Boca Raton is $106,273.
Boca Raton's Overall Cost Of Living
Higher Than The National Average
Cost Of Living In Boca Raton Comparison Table
| Living Expense | Boca Raton | Florida | National Average |
|---|---|---|---|
| Overall | 148 | 104 | 100 |
| Services | 100 | 101 | 100 |
| Groceries | 104 | 105 | 100 |
| Health | 246 | 99 | 100 |
| Housing | 100 | 104 | 100 |
| Transportation | 116 | 109 | 100 |
| Utilities | 112 | 105 | 100 |
Source: Cost of living index, normalized to US average = 100
Boca Raton, FL Weather
The average high in Boca Raton is 83.1° and the average low is 68.4°.
There are 84.1 days of precipitation each year.
Expect an average of 56.1 inches of precipitation each year with 0.0 inches of snow.
| Stat | Boca Raton |
|---|---|
| Average Annual High | 83.1 |
| Average Annual Low | 68.4 |
| Annual Precipitation Days | 84.1 |
| Average Annual Precipitation | 56.1 |
| Average Annual Snowfall | 0.0 |
Average High
Days of Rain
Source: NOAA climate normals (30-year)
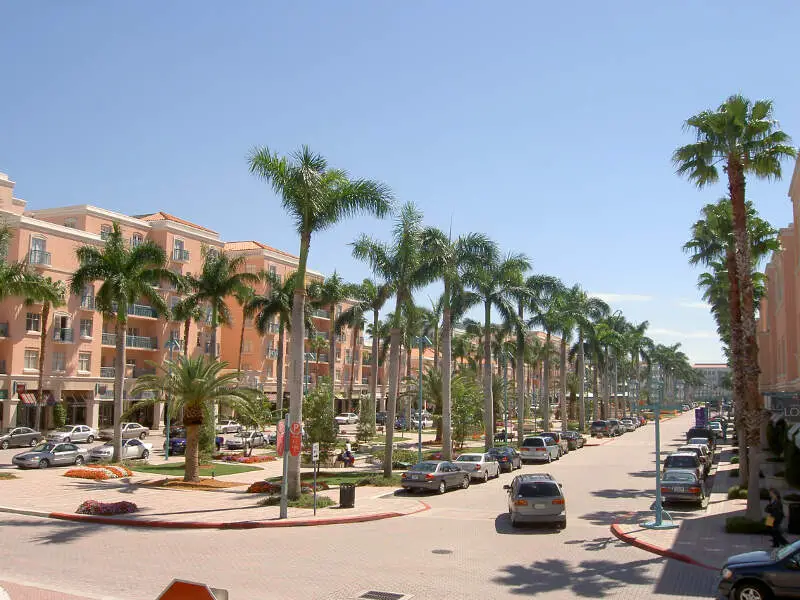
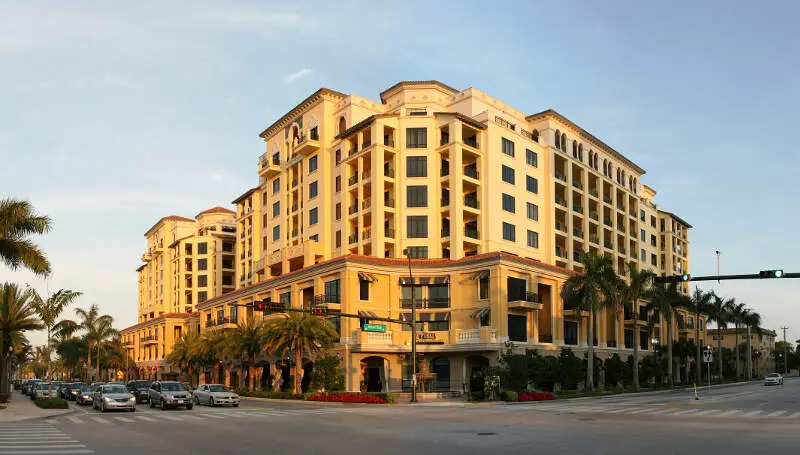
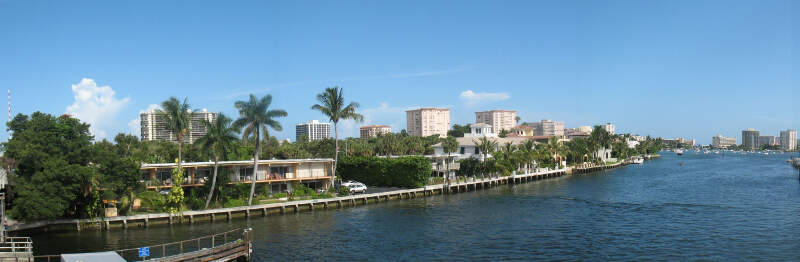
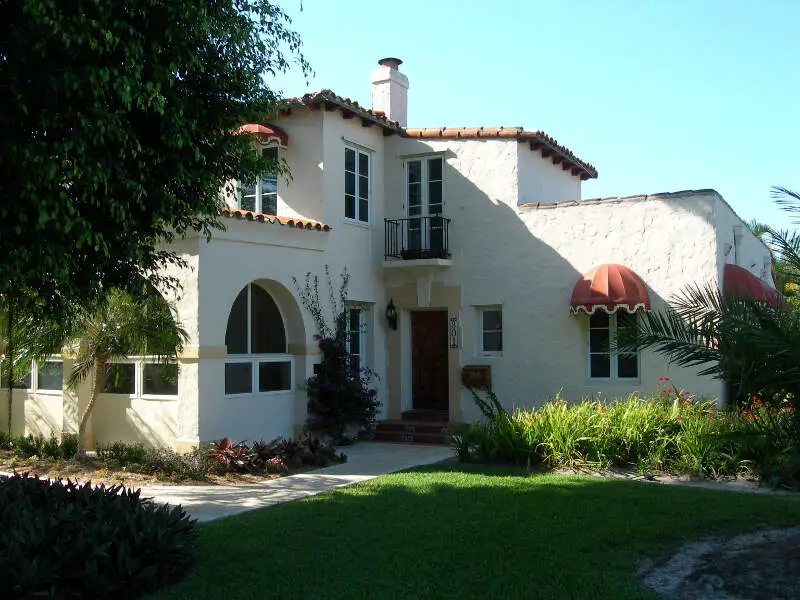
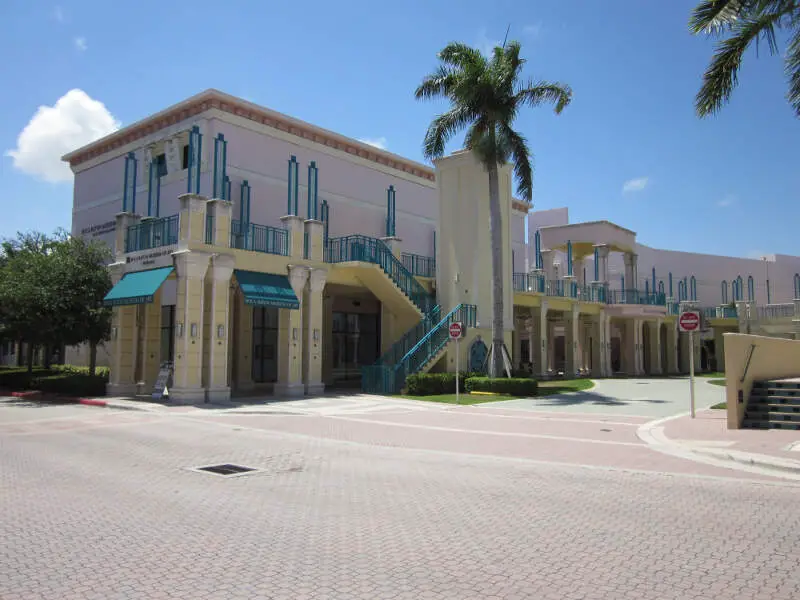
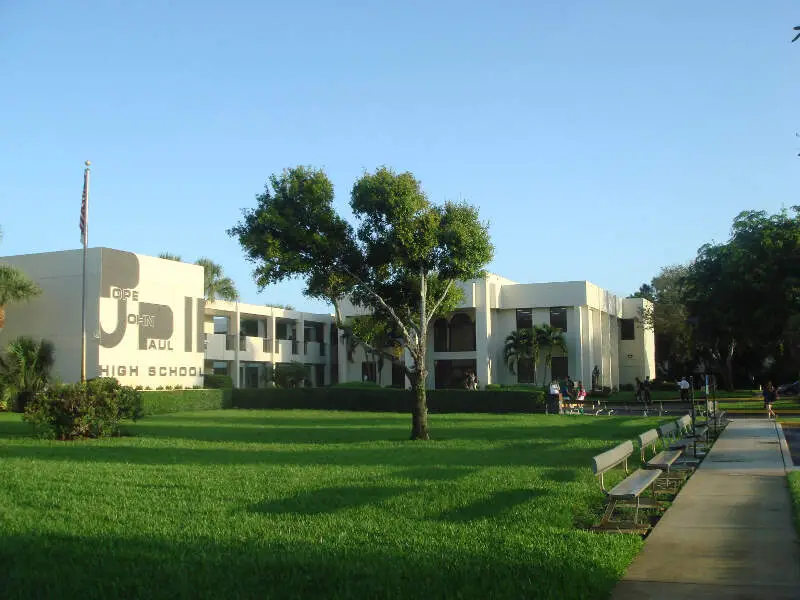
Boca Raton, FL Photos


1 Reviews & Comments About Boca Raton

Wow! I lived in Boca Raton for 2 years. We used to call it boca rotten. Guess it wasn't so bad. Now, I am looking for a small, inexpensive retirement condo. Looking online, doing research. Smaller towns right outside St, Petersburg are catching my attention.
Rankings & Articles For Boca Raton


Locations Around Boca Raton
Map Of Boca Raton, FL
Best Places Around Boca Raton
Coral Springs, FL
Population 136,103
Coconut Creek, FL
Population 58,330
Parkland, FL
Population 37,178
Lighthouse Point, FL
Population 10,600
Oakland Park, FL
Population 44,682
North Lauderdale, FL
Population 45,234
Wilton Manors, FL
Population 11,511
Margate, FL
Population 59,198
Greenacres, FL
Population 44,373
Sunrise, FL
Population 97,918
Boca Raton Demographics And Statistics
Population over time in Boca Raton
The current population in Boca Raton is 100,234. The population has increased 17.8% from 2010.
| Year | Population | % Change |
|---|---|---|
| 2024 | 100,234 | 1.4% |
| 2023 | 98,833 | 0.9% |
| 2022 | 97,980 | 2.8% |
| 2021 | 95,347 | -3.5% |
| 2020 | 98,776 | 1.3% |
| 2019 | 97,468 | 1.8% |
| 2018 | 95,745 | 1.9% |
| 2017 | 93,964 | 2.5% |
| 2016 | 91,702 | 2.1% |
| 2015 | 89,793 | 1.8% |
| 2014 | 88,187 | 1.7% |
| 2013 | 86,671 | 1.1% |
| 2012 | 85,738 | 1.0% |
| 2011 | 84,876 | -0.2% |
| 2010 | 85,084 | - |
Race / Ethnicity in Boca Raton
See the full breakdown
Boca Raton is:
70.8% White with 70,918 White residents.
5.3% African American with 5,348 African American residents.
0.0% American Indian with 46 American Indian residents.
2.8% Asian with 2,821 Asian residents.
0.0% Hawaiian with 15 Hawaiian residents.
0.6% Other with 626 Other residents.
4.7% Two Or More with 4,746 Two Or More residents.
15.7% Hispanic with 15,714 Hispanic residents.
| Race | Boca Raton | FL | USA |
|---|---|---|---|
| White | 70.8% | 50.4% | 57.4% |
| African American | 5.3% | 14.6% | 11.9% |
| American Indian | 0.0% | 0.1% | 0.5% |
| Asian | 2.8% | 2.9% | 5.9% |
| Hawaiian | 0.0% | 0.1% | 0.2% |
| Other | 0.6% | 0.7% | 0.6% |
| Two Or More | 4.7% | 3.8% | 4.3% |
| Hispanic | 15.7% | 27.4% | 19.3% |
Gender in Boca Raton
See the full breakdown
Boca Raton is 53.2% female with 53,331 female residents.
Boca Raton is 46.8% male with 46,903 male residents.
| Gender | Boca Raton | FL | USA |
|---|---|---|---|
| Female | 53.2% | 50.9% | 50.5% |
| Male | 46.8% | 49.1% | 49.5% |
Highest level of educational attainment in Boca Raton for adults over 25
See the full breakdown
3.0% of adults in Boca Raton completed < 9th grade.
2.0% of adults in Boca Raton completed 9-12th grade.
12.0% of adults in Boca Raton completed high school / ged.
15.0% of adults in Boca Raton completed some college.
7.0% of adults in Boca Raton completed associate's degree.
36.0% of adults in Boca Raton completed bachelor's degree.
15.0% of adults in Boca Raton completed master's degree.
7.0% of adults in Boca Raton completed professional degree.
3.0% of adults in Boca Raton completed doctorate degree.
| Education | Boca Raton | FL | USA |
|---|---|---|---|
| < 9th Grade | 3.0% | 5.0% | 4.0% |
| 9-12th Grade | 2.0% | 6.0% | 6.0% |
| High School / GED | 12.0% | 27.0% | 26.0% |
| Some College | 15.0% | 19.0% | 19.0% |
| Associate's Degree | 7.0% | 10.0% | 9.0% |
| Bachelor's Degree | 36.0% | 21.0% | 22.0% |
| Master's Degree | 15.0% | 9.0% | 10.0% |
| Professional Degree | 7.0% | 2.0% | 2.0% |
| Doctorate Degree | 3.0% | 1.0% | 2.0% |
Household Income For Boca Raton, Florida
See the full breakdown
5.3% of households in Boca Raton earn Less than $10,000.
1.9% of households in Boca Raton earn $10,000 to $14,999.
4.8% of households in Boca Raton earn $15,000 to $24,999.
4.7% of households in Boca Raton earn $25,000 to $34,999.
9.0% of households in Boca Raton earn $35,000 to $49,999.
12.3% of households in Boca Raton earn $50,000 to $74,999.
9.7% of households in Boca Raton earn $75,000 to $99,999.
16.9% of households in Boca Raton earn $100,000 to $149,999.
9.0% of households in Boca Raton earn $150,000 to $199,999.
26.3% of households in Boca Raton earn $200,000 or more.
| Income | Boca Raton | FL | USA |
|---|---|---|---|
| Less than $10,000 | 5.3% | 5.1% | 5.0% |
| $10,000 to $14,999 | 1.9% | 3.3% | 3.4% |
| $15,000 to $24,999 | 4.8% | 6.6% | 6.3% |
| $25,000 to $34,999 | 4.7% | 7.3% | 6.6% |
| $35,000 to $49,999 | 9.0% | 11.1% | 10.1% |
| $50,000 to $74,999 | 12.3% | 16.8% | 15.5% |
| $75,000 to $99,999 | 9.7% | 13.1% | 12.6% |
| $100,000 to $149,999 | 16.9% | 17.2% | 17.5% |
| $150,000 to $199,999 | 9.0% | 8.4% | 9.6% |
| $200,000 or more | 26.3% | 11.0% | 13.4% |
Source: U.S. Census ACS 5-year estimates (2024)


