Coral Springs SnackAbility
Overall SnackAbility
Crime in Coral Springs summary. We use data from the FBI to determine the crime rates in Coral Springs. Key points include:
There were 1,663 total crimes in Coral Springs in the last reporting year.
The overall crime rate per 100,000 people in Coral Springs is 1,230.4 / 100k people.
The violent crime rate per 100,000 people in Coral Springs is 136.9 / 100k people.
The property crime rate per 100,000 people in Coral Springs is 1,093.5 / 100k people.
Overall, crime in Coral Springs is -41.94% below the national average.
Total Crimes
Below National Average
Crime In Coral Springs Comparison Table
| Statistic | Count Raw |
Coral Springs / 100k People |
Florida / 100k People |
National / 100k People |
|---|---|---|---|---|
| Total Crimes Per 100K | 1,663 | 1,230.4 | 1,687.5 | 2,119.2 |
| Violent Crime | 185 | 136.9 | 267.1 | 359.0 |
| Murder | 4 | 3.0 | 3.9 | 5.0 |
| Robbery | 27 | 20.0 | 38.2 | 61.0 |
| Aggravated Assault | 118 | 87.3 | 197.1 | 256.0 |
| Property Crime | 1,478 | 1,093.5 | 1,420.4 | 1,760.0 |
| Burglary | 110 | 81.4 | 152.5 | 229.0 |
| Larceny | 1,334 | 987.0 | 1,144.9 | 1,272.0 |
| Car Theft | 34 | 25.2 | 123.0 | 259.0 |
Source: FBI Uniform Crime Reporting (2024)
Cost of living in Coral Springs summary. We use data on the cost of living to determine how expensive it is to live in Coral Springs. Real estate prices drive most of the variance in cost of living around Florida. Key points include:
The cost of living in Coral Springs is 131 with 100 being average.
The cost of living in Coral Springs is 1.3x higher than the national average.
The median home value in Coral Springs is $520,101.
The median income in Coral Springs is $93,602.
Coral Springs's Overall Cost Of Living
Higher Than The National Average
Cost Of Living In Coral Springs Comparison Table
| Living Expense | Coral Springs | Florida | National Average |
|---|---|---|---|
| Overall | 131 | 104 | 100 |
| Services | 101 | 101 | 100 |
| Groceries | 106 | 105 | 100 |
| Health | 192 | 99 | 100 |
| Housing | 107 | 104 | 100 |
| Transportation | 111 | 109 | 100 |
| Utilities | 104 | 105 | 100 |
Source: Cost of living index, normalized to US average = 100
Coral Springs, FL Weather
The average high in Coral Springs is 84.0° and the average low is 67.7°.
There are 63.9 days of precipitation each year.
Expect an average of 55.3 inches of precipitation each year with 0.0 inches of snow.
| Stat | Coral Springs |
|---|---|
| Average Annual High | 84.0 |
| Average Annual Low | 67.7 |
| Annual Precipitation Days | 63.9 |
| Average Annual Precipitation | 55.3 |
| Average Annual Snowfall | 0.0 |
Average High
Days of Rain
Source: NOAA climate normals (30-year)
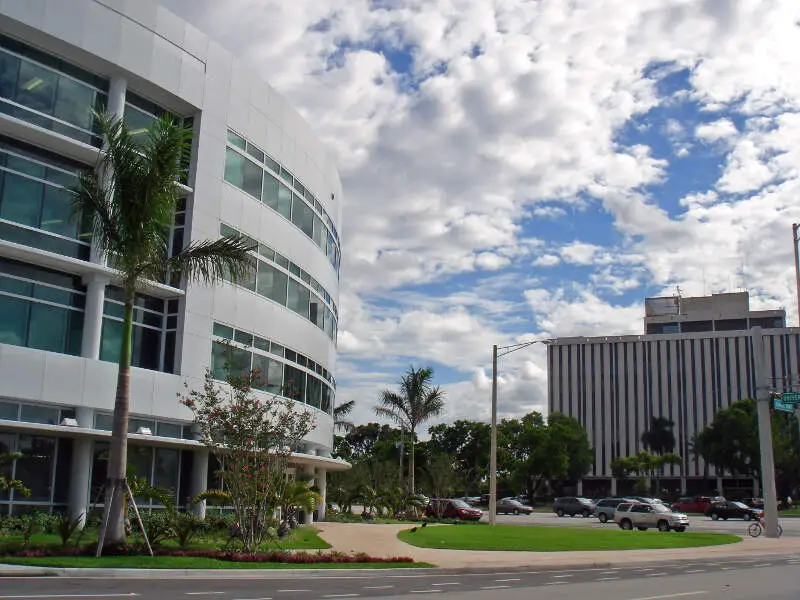
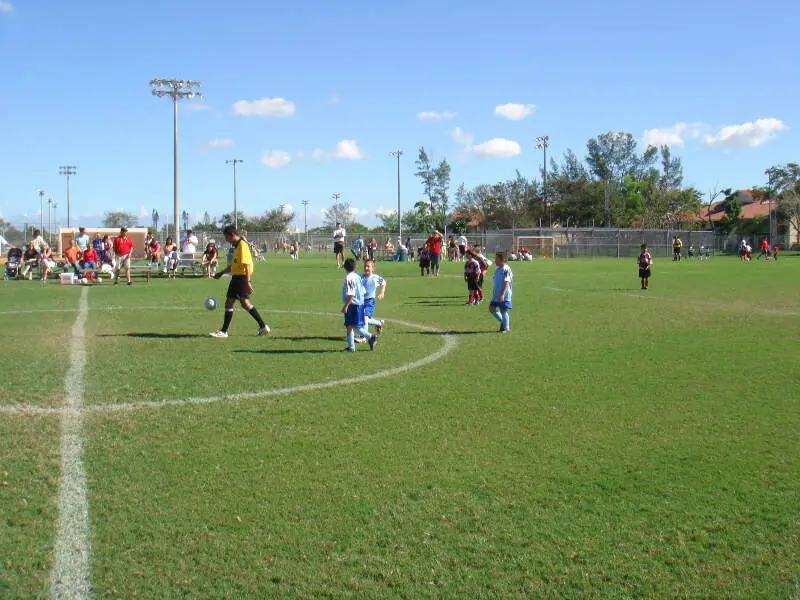
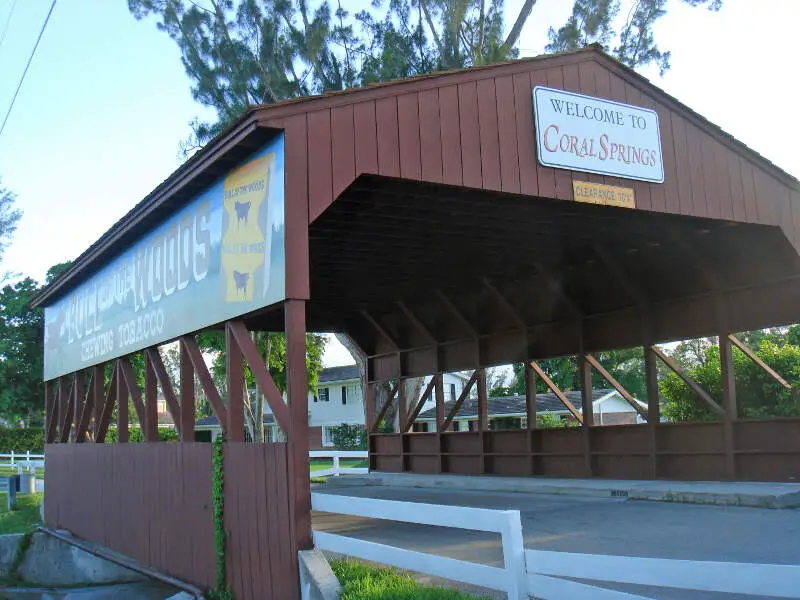
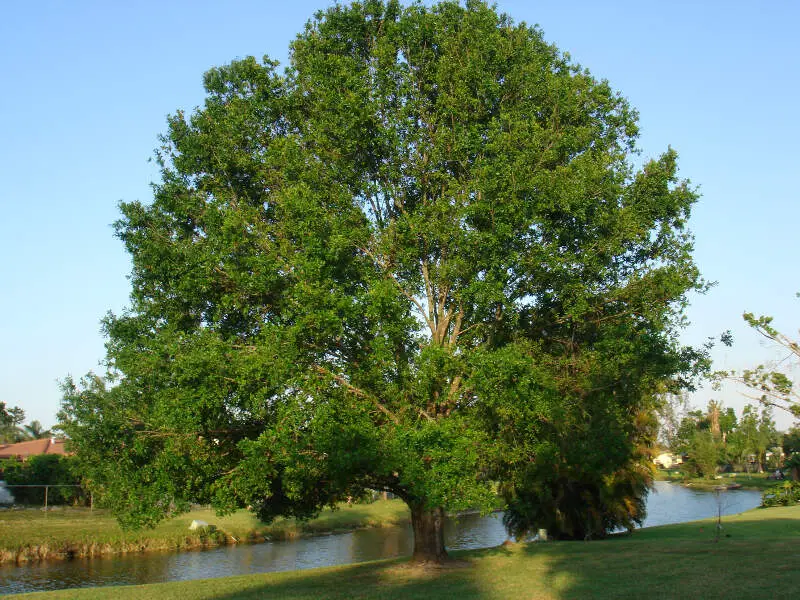
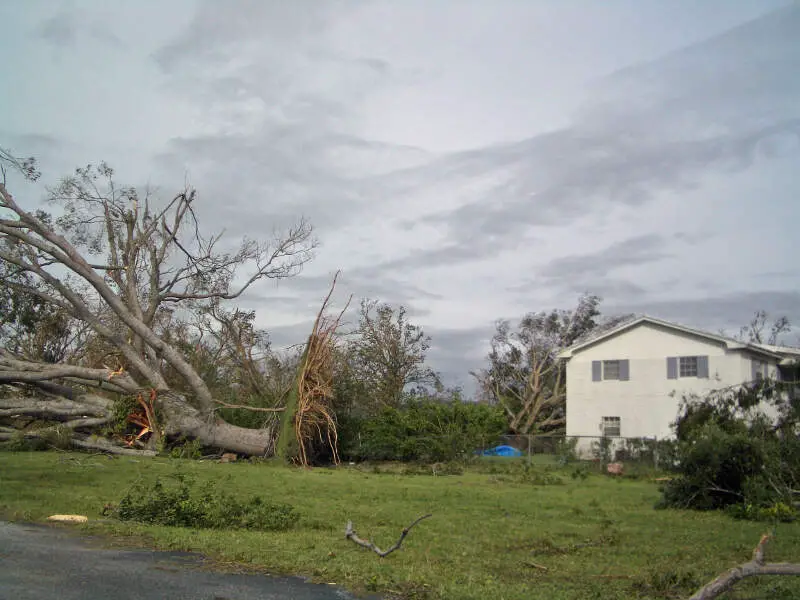
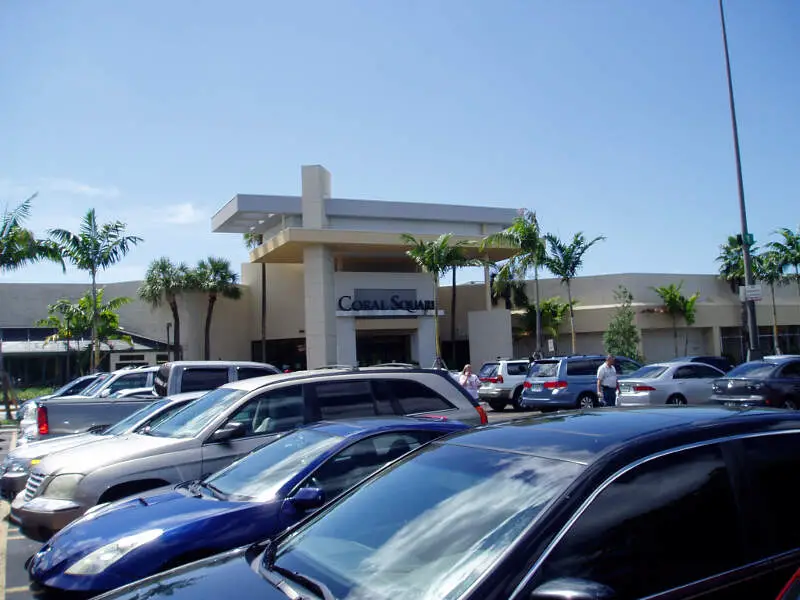
Coral Springs, FL Photos
1 Reviews & Comments About Coral Springs

Coral Springs is a suburban neighborhood, surrounded by commercial properties. In other words, it is a small city. It is an expensive place to live. There are hardly any violent crimes. It is safe to walk around at any time. The main crimes are burglaries, shoplifting, or car theft. The police are very active to ensure that suspicious people are questioned. Traffic laws are enforced strictly.
It gets real hot and humid in May until September. It rains hard almost every day in the summer time. There are many insects that live in the grass and could crawl or fly into your residence.
Rankings & Articles For Coral Springs


Locations Around Coral Springs
Map Of Coral Springs, FL
Best Places Around Coral Springs
Weston, FL
Population 68,837
Coconut Creek, FL
Population 58,330
Boca Raton, FL
Population 100,234
Parkland, FL
Population 37,178
Pembroke Pines, FL
Population 173,194
Lighthouse Point, FL
Population 10,600
Davie, FL
Population 108,346
Oakland Park, FL
Population 44,682
North Lauderdale, FL
Population 45,234
Wilton Manors, FL
Population 11,511
Coral Springs Demographics And Statistics
Population over time in Coral Springs
The current population in Coral Springs is 136,103. The population has increased 12.4% from 2010.
| Year | Population | % Change |
|---|---|---|
| 2024 | 136,103 | 1.6% |
| 2023 | 133,962 | 0.1% |
| 2022 | 133,801 | 0.1% |
| 2021 | 133,693 | 0.2% |
| 2020 | 133,370 | 0.6% |
| 2019 | 132,568 | 1.1% |
| 2018 | 131,151 | 0.8% |
| 2017 | 130,110 | 1.9% |
| 2016 | 127,673 | 0.8% |
| 2015 | 126,673 | 1.2% |
| 2014 | 125,150 | 1.4% |
| 2013 | 123,476 | 1.0% |
| 2012 | 122,219 | 0.8% |
| 2011 | 121,275 | 0.1% |
| 2010 | 121,116 | - |
Race / Ethnicity in Coral Springs
See the full breakdown
Coral Springs is:
33.0% White with 44,909 White residents.
24.0% African American with 32,669 African American residents.
0.1% American Indian with 144 American Indian residents.
4.9% Asian with 6,721 Asian residents.
0.0% Hawaiian with 0 Hawaiian residents.
1.7% Other with 2,333 Other residents.
5.1% Two Or More with 6,875 Two Or More residents.
31.2% Hispanic with 42,452 Hispanic residents.
| Race | Coral Springs | FL | USA |
|---|---|---|---|
| White | 33.0% | 50.4% | 57.4% |
| African American | 24.0% | 14.6% | 11.9% |
| American Indian | 0.1% | 0.1% | 0.5% |
| Asian | 4.9% | 2.9% | 5.9% |
| Hawaiian | 0.0% | 0.1% | 0.2% |
| Other | 1.7% | 0.7% | 0.6% |
| Two Or More | 5.1% | 3.8% | 4.3% |
| Hispanic | 31.2% | 27.4% | 19.3% |
Gender in Coral Springs
See the full breakdown
Coral Springs is 52.8% female with 71,876 female residents.
Coral Springs is 47.2% male with 64,226 male residents.
| Gender | Coral Springs | FL | USA |
|---|---|---|---|
| Female | 52.8% | 50.9% | 50.5% |
| Male | 47.2% | 49.1% | 49.5% |
Highest level of educational attainment in Coral Springs for adults over 25
See the full breakdown
1.0% of adults in Coral Springs completed < 9th grade.
4.0% of adults in Coral Springs completed 9-12th grade.
24.0% of adults in Coral Springs completed high school / ged.
19.0% of adults in Coral Springs completed some college.
11.0% of adults in Coral Springs completed associate's degree.
25.0% of adults in Coral Springs completed bachelor's degree.
11.0% of adults in Coral Springs completed master's degree.
3.0% of adults in Coral Springs completed professional degree.
2.0% of adults in Coral Springs completed doctorate degree.
| Education | Coral Springs | FL | USA |
|---|---|---|---|
| < 9th Grade | 1.0% | 5.0% | 4.0% |
| 9-12th Grade | 4.0% | 6.0% | 6.0% |
| High School / GED | 24.0% | 27.0% | 26.0% |
| Some College | 19.0% | 19.0% | 19.0% |
| Associate's Degree | 11.0% | 10.0% | 9.0% |
| Bachelor's Degree | 25.0% | 21.0% | 22.0% |
| Master's Degree | 11.0% | 9.0% | 10.0% |
| Professional Degree | 3.0% | 2.0% | 2.0% |
| Doctorate Degree | 2.0% | 1.0% | 2.0% |
Household Income For Coral Springs, Florida
See the full breakdown
2.4% of households in Coral Springs earn Less than $10,000.
1.8% of households in Coral Springs earn $10,000 to $14,999.
5.6% of households in Coral Springs earn $15,000 to $24,999.
4.5% of households in Coral Springs earn $25,000 to $34,999.
8.2% of households in Coral Springs earn $35,000 to $49,999.
16.2% of households in Coral Springs earn $50,000 to $74,999.
14.5% of households in Coral Springs earn $75,000 to $99,999.
18.3% of households in Coral Springs earn $100,000 to $149,999.
12.9% of households in Coral Springs earn $150,000 to $199,999.
15.5% of households in Coral Springs earn $200,000 or more.
| Income | Coral Springs | FL | USA |
|---|---|---|---|
| Less than $10,000 | 2.4% | 5.1% | 5.0% |
| $10,000 to $14,999 | 1.8% | 3.3% | 3.4% |
| $15,000 to $24,999 | 5.6% | 6.6% | 6.3% |
| $25,000 to $34,999 | 4.5% | 7.3% | 6.6% |
| $35,000 to $49,999 | 8.2% | 11.1% | 10.1% |
| $50,000 to $74,999 | 16.2% | 16.8% | 15.5% |
| $75,000 to $99,999 | 14.5% | 13.1% | 12.6% |
| $100,000 to $149,999 | 18.3% | 17.2% | 17.5% |
| $150,000 to $199,999 | 12.9% | 8.4% | 9.6% |
| $200,000 or more | 15.5% | 11.0% | 13.4% |
Source: U.S. Census ACS 5-year estimates (2024)


